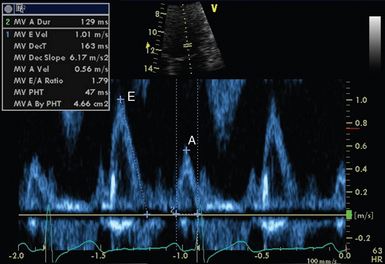
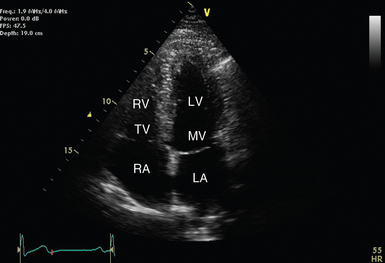
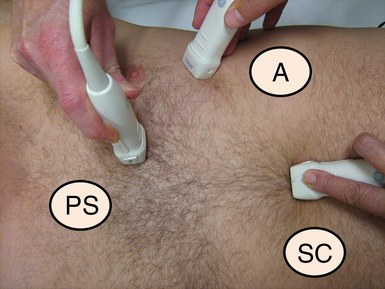
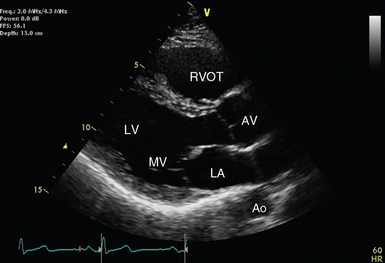
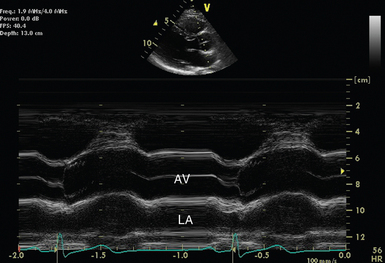
26 The first reported use of ultrasound to assess cardiac function was almost 60 years ago.1 Technologic advances have now placed echocardiography as the intensivist’s only option for bedside visualization of cardiac anatomy and function in real time. Although echocardiography began as the domain of the specialist cardiologist, a number of factors have contributed to increasing interest and training among critical care physicians. These include, a move away from invasive hemodynamic monitoring (such as the pulmonary artery catheter); increasing clinical and research echocardiography experience in the critically ill; availability of smaller, less expensive, better-quality ultrasound machines; as well as greater access to education and training in clinical ultrasound.2 Echocardiography typically uses phased-array transducers. The latter have a small footprint and consist of multiple miniature ultrasonic elements capable of being pulsed independently. Elements are activated with phase differences to generate a high-frequency (high-resolution) beam that can be focused and steered electronically. The tissue to be imaged is interrogated by sweeping the transducer around, something like using a searchlight. The resultant image is reconstructed from multiple beams and is represented by an expanding field of view that is also typical of a curvilinear transducer (see Chapter 1). Radiologic and cardiologic laboratories tend to be well equipped with state-of-the-art echocardiography machines. These are well suited to comprehensive examination performed by experienced technicians in nonemergent circumstances.3 The critical care environment, on the other hand, lends itself to the application of compact, robust equipment. Image quality is balanced against the desirability of a small physical profile when attempting to access critically ill patients during concurrent resuscitation. Compact devices capable of focused echocardiography complement other hemodynamic and physical examination findings. Modern echocardiography machines have a dazzling array of knobs and buttons. Familiarity with your machine’s user interface is essential to manipulate and optimize image quality. The knowledge required to optimize images via the machine’s user interface has become known as knobology (see Chapter 1). Knobs are generally clustered according to function and are generally grouped into those controlling power, gain, time gain compensation (TGC), dynamic range, depth, zoom/magnification, freeze, calculations, alphanumeric, and save/print functions. Used appropriately, device presets usually minimize the amount of adjustment required by the user. When optimizing an image, it is generally advisable to adjust variables in the following order: • Depth: Always start deeper than the area of interest to ensure that deeper structures and pathology may be appreciated. • Focus: Adjust so that area of highest lateral resolution coincides with area of interest. Modern machines often have multiple focal zones. Beware: activation of more focal zones results in slower frame rates and loss of temporal resolution. • TGC: Compensates for attenuation of ultrasound passing deeper into tissues. The resultant image should demonstrate a consistent level of ultrasonic intensity. Interchangeable terminology for TGC includes distance gain compensation (DGC) and spatial time compensation (STC). • Zoom: May be used to magnify point of interest. • Gain: Optimize to allow visualization of most points of interest. High gain can obscure detail. • Dynamic range (contrast): High “dynamic range” translates to low “contrast.” Echocardiographic images must be accompanied with an electrocardiographic (ECG) signal on the same time axis. This is mandatory to allow timing of images according to the cardiac cycle (systole/diastole).4 Some echocardiography machines will also allow slaving of respiratory phase data from the ventilator or monitoring equipment. Respiratory phase may also be determined from thoracic electrical bioimpedence (from ECG leads). Incorporation of respiratory phase data allows appreciation and quantification of heart –lung interactions. Although both motion mode (M-mode) and Doppler modalities historically preceded 2D echocardiography, 2D will be detailed first because of the practicality that M-mode and Doppler modalities are now mostly used with 2D guidance. Cross-sectional ultrasonographic “slices” through the beating heart can be visualized in real time or recorded (as “clips”) for subsequent review and analysis. Nomenclature and image orientation standards in TTE allow for description of images based upon transducer location and orientation to the heart (plane).5 When placed in the suprasternal notch, this is referred to as the suprasternal location. When located near the midline of the body and beneath the lowest ribs, this is referred to as the subcostal location. When located over the apex impulse, this is the apical location. The area bound by the left clavicle (superiorly), sternum, and apical region (inferiorly) is referred to as the parasternal location. By default, apical and parasternal locations are assumed to be left sided. In unusual circumstances, when right-sided imaging is indicated, the right apical and right parasternal locations may be required (Figures 26-1 to 26-4). Figure 26-1 Approximate transducer placement for common windows. The patient is supine, which is typical in critical care. The patient’s left side is toward the top of the image. A, Apical position; PS, parasternal position; SC, subcostal position. Figure 26-2 Parasternal long-axis view with relevant structures labeled. The left ventricle should appear almost horizontal, and the apex is not displayed. Ao, Descending aorta; AV, aortic valve; LA, left atrium; LV, left ventricle; MV, mitral valve; RVOT, right ventricular outflow tract. Figure 26-3 M-mode across the aortic valve in the parasternal long-axis view. The aortic valve (AV) is labeled during leaflet apposition in ventricular diastole. LA indicates the left atrium. It can be seen that it is potentially difficult to orientate the M-mode cursor squarely across the structure of interest, and as a result, measurements may not be representative. Rather than applying classic anatomic planes (sagittal, transverse, and coronal), 2D echocardiographic planes are based upon cardiac orientation. The long-axis plane transects the heart perpendicular to the ventral body surface and parallel to the long axis of the heart. The short-axis plane is perpendicular to the ventral body surface and long axis of the heart. The plane that transects the heart approximately parallel to the ventral body surface is referred to as the four-chamber plane (see Figures 26-1 to 26-4). With experience, the echocardiographer can imagine 3D cardiac anatomy based upon 2D scans. Rather than displaying a 2D representation of the heart, M-mode displays the depth and intensity of ultrasound reflection in a single dimension against time. Using modern equipment, M-mode is acquired by swinging the M-mode cursor across the structure(s) of interest visualized in a 2D image (see Figure 26-3). It offers excellent temporal resolution because of a high pulse rate and may complement 2D images. The major disadvantage arises from the challenge of aligning the M-mode cursor perpendicularly across the structure of interest to take accurate measurements.6 Doppler echocardiography7 is predominantly used to determine the velocity (speed and direction) of blood flow within the heart and blood vessels. It is based upon the Doppler principle, which states that the frequency of ultrasound is altered by reflection from a moving object, such as red blood cells. The magnitude of frequency change (Doppler shift) is proportional to the speed that the object is moving relative to the probe. The polarity of the shift is dependent on the direction relative to the probe (toward = positive; away = negative). When solved for the velocity (V) of the moving object, the Doppler equation can be represented as: Pulsed wave Doppler (PWD) measures flow velocity at a targeted site (sample volume; Figure 26-5). It achieves this by transmitting ultrasound in pulses and then “listening” for reflected signals returning within the defined time period. A longer delay is expected when the sample volume is placed further from the probe. This technique cannot accurately measure velocities above a certain threshold (Nyquist limit) because of a phenomenon called aliasing. A number of interventions can be applied to prevent aliasing. These include Figure 26-5 Normal mitral inflow Doppler. Peak early (E) and active (A) transmitral diastolic velocities are labeled.
Transthoracic echocardiography: An overview
Overview
Technical aspects
Equipment
Knobology
Image optimization
Biological signals
Echocardiographic modalities
Two-dimensional echocardiography
Transducer location
Imaging planes
M-mode echocardiography
Doppler echocardiography
Pulsed wave doppler
