2 Traumatic Disorders
Fractures
Definition
A fracture is a complete or incomplete break in a bone, with or without dislocation, following direct or indirect trauma or in the absence of trauma.
Pathology
 macroscopic:
– disruption in cortical and/or cancellous bone
– varus/valgus malalignment
– bone marrow contusion
– associated soft tissue injury
 microscopic:
– edema
– hemorrhage
– cortical disruption
– trabecular disruption
– compressed trabecular bone
– periosteal tear
– cartilage defects/disruption
Open/Closed Fractures
 soft tissue damage:
– closed fracture
– grade I open fracture: destruction of soft tissue (due to cartilage fragments) from inside
– grade II open fracture: destruction of soft tissue from outside
– grade III open fracture: extensive soft tissue destruction involving skin, muscle, vessels, and/or nerves
Fracture Types
 complete fractures:
– chisel fracture
– transverse fracture
– oblique fracture
– bending fracture
– torsion or spiral fracture
– segmental fracture (blow to larger surface area)
– defect fracture
– comminuted fracture (more than six fragments)
 incomplete fractures:
– infraction
– fissure
– occult fracture
– bone bruise
– greenstick fracture
Clinical Signs
 Deformity
 abnormal mobility
 crepitation
 functional loss
 localized spontaneous pain, tenderness, pain with movement
 local swelling
 local bruising
Diagnostic Evaluation
 (→ method of choice for detecting fractures)
 localization and extent of fracture
 fracture type (according to AO classification, if possible)
 joint involvement
 fragment (dis)location:
– axially
– laterally
– longitudinally with/without contracture
– peripherally
 (→ supplementary method, depending on the physician’s preference)
 joint effusion
 hematomas
 associated injury to ligaments, tendons, muscles, menisci, joint capsules
 functional test (abnormal mobility, instability)
 fracture diagnosis (gap width, joint surface involvement, signs of consolidation)
 (→ complementary method of choice)
 optimized fracture typing (preferably according to AO classification)
 exact determination of localization and extent of fracture
 longitudinal displacement and degree of malrotation, comparing sides
 joint involvement
 associated soft tissue damage
 fragment (dis)placement
 number and size of fragments
 intra-articular loose bodies
 (→ complementary method)
 occult fractures
 detection/confirmation of fatigue breaks and stress fractures
 osteochondral fractures/dissection
 cartilage damage
 intra-articular loose bodies
 associated soft tissue damage (tendons, muscles, collateral ligaments, cruciate ligaments, patella retinaculae, menisci)
 effusion, hematoma
 functional test
Fracture Causes
Traumatic Fractures
Definition
A traumatic fracture is a complete or incomplete break in a bone with or without dislocation, caused by one-time excessive stress on its physiological elasticity from a direct or indirect blow.
Role of Imaging
 demonstrate anatomy of bony and soft tissue structures
 demonstrate full extent of cortical and cancellous bone fractures and soft tissue damage
 demonstrate fragment shape, position and localization, intrarticular loose bodies, and articular surface involvement
 demonstrate relationship of injured bony and soft tissue structures to one another
 demonstrate local or systemic processes causing bone destruction and soft tissue infiltration
Pathology
 macroscopic:
– disruption in cortical and/or cancellous bone
– varus/valgus malalignment
– bone marrow contusion
– associated soft tissue injury
 microscopic:
– edema
– hemorrhage
– trabecular disruption
– compressed trabecular bone
– periosteal tear
– cartilage defects/disruption
Fracture Localization
 distal femur:
– extra-articular metaphyseal
– partially/completely intra-articular
– wedge fracture
– simple/multifragmentary
– unicondylar/bicondylar
 proximal tibia:
– extra-articular metaphyseal
– partially/completely intra-articular
– split/depression fracture
 patella:
– differential diagnosis (DD) bipartite/tripartite patella (congenital, asymptomatic, predominantly among men, unilateral in 50%, craniolateral in three-quarters of cases, otherwise lateral or cranial, no hematoma/edema, no bone bruise)
Tibial Plateau Fracture Classification (Based on Mueller)
 grade I: undisplaced vertical or wedgeshaped fracture
 grade II: central depression of medial or lateral joint surface
 grade III: vertical or wedgeshaped fracture with central depression of medial or lateral joint surface and proximal fibula fracture
 grade IV: comminuted fracture involving medial and lateral joint surface and proximal fibula fracture
Tibial Plateau Fracture Classification (Based on Hohl)
 grade I: undisplaced vertical sagittal fracture
 grade II: central depression of medial or lateral joint surface
 grade III: displaced vertical sagittal fracture with central depression of medial or lateral joint surface and sometimes proximal fibular head fracture
 grade IV: displaced entirely medial joint surface depression without comminution
 grade V: undisplaced vertical coronal anterior or posterior fracture without depression
 grade VI: comminuted fracture involving medial and lateral joint surfaces and possibly fibular head fracture
Clinical Signs
 Deformity
 abnormal mobility
 crepitation
 functional loss
 local spontaneous pain, tenderness, and pain with movement
 local swelling
 local hematoma
Diagnostic Evaluation (Figs. 2.1–2.6)
 (→ method of choice)
Recommended Radiography Projections
 standard projections:
– anteroposterior (AP) projection
– lateral projection, mediolateral roentgen ray path
 special projections (depending on fracture localization):
– Tunnel view/Notch view to demonstrate intercondylar fossa and eminence
– axial projection of the patella
– “defilée” views (axial projection with knee bent 30°, 60°, 90°) of the patella to demonstrate the patellofemoral joint
– 45° oblique views for better evaluation of the tibial plateau and proximal fibula
 conventional tomography:
– almost entirely replaced by multislice CT and two-dimensional/three-dimensional (2-D/3-D) reconstructions
– maybe indicated for postoperative surveillance (position, “knitting together” of bones) if more extensive metal implants are causing artifacts in CT
Findings
 Path of fracture lines
 fracture localization and extent
 fragment (dis)placement
 number of fragments
 fracture type (according to AO classification, if possible)
 joint involvement
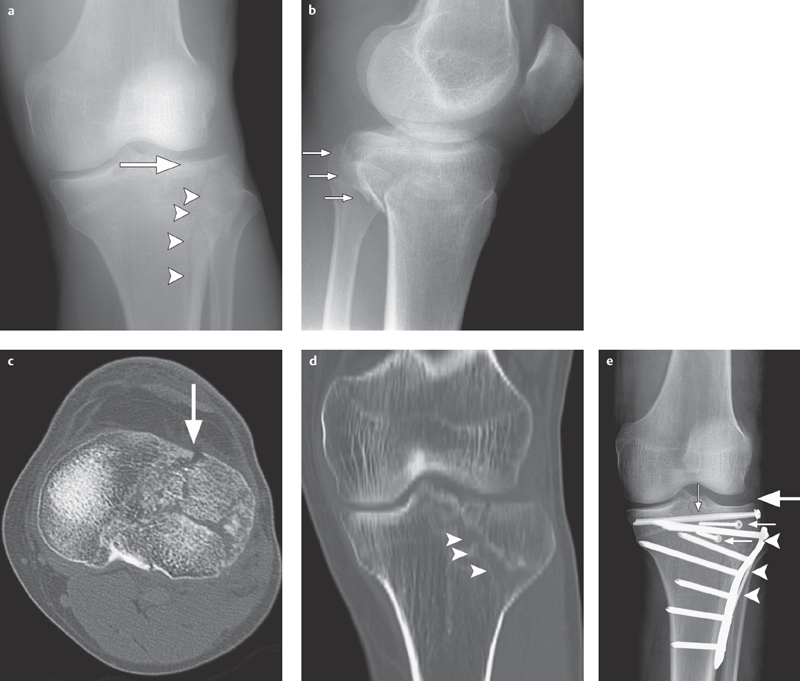
Fig. 2.1 a–e  Complex lateral tibial plateau fracture (left side).
a, b AP projection and lateral view. Conventional radiography demonstrates a complex lateral tibial plateau fracture on the left side with involvement of the tibial plateau (arrow), split fracture (arrowheads; type II based on Moore/B3 in AO classification) and dorsal displacement (small arrows in b).
c Axial CT demonstrates full extent of lateral infraction of the tibial plateau (arrow).
d Split fracture documented in coronal 2-D reconstruction (arrow tips).
e After osteosynthesis using plates (arrow-heads) and screws (small arrows) the tibial plateau is completely reduced (large arrow).
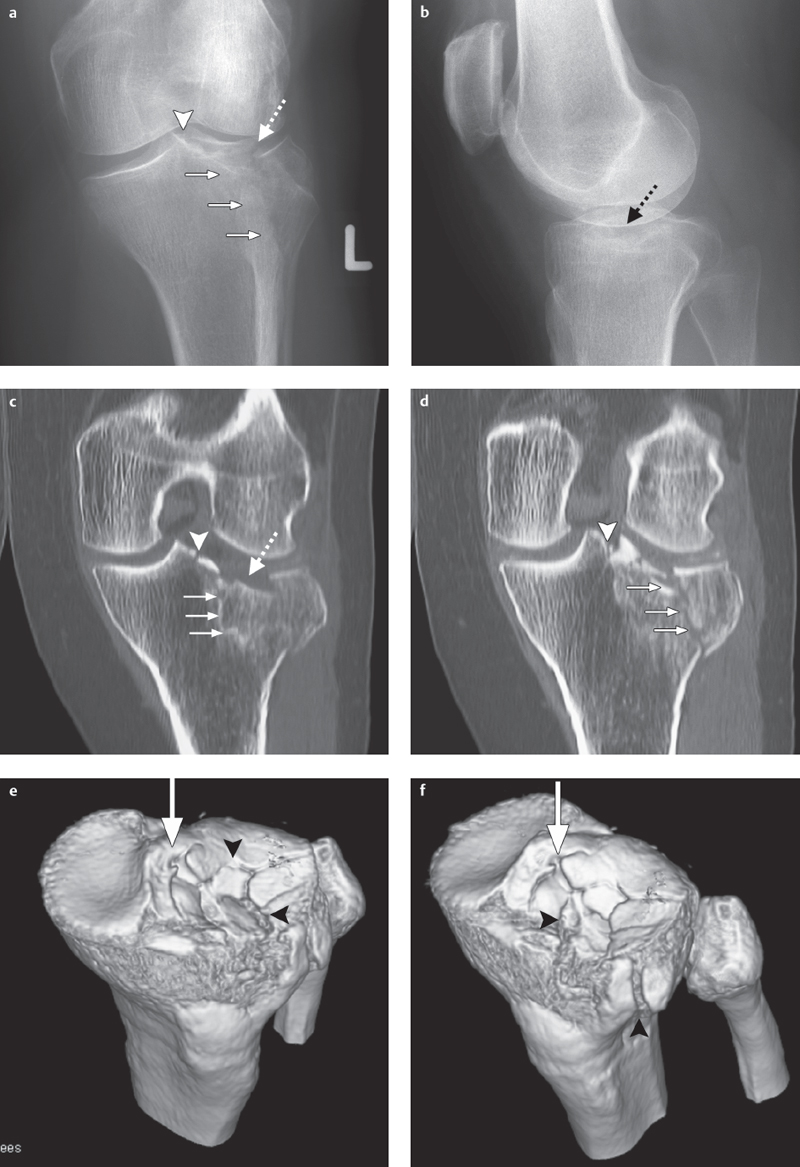
Fig. 2.2 a–f  Lateral tibial plateau fracture.
a, b Radiography projection in two planes of a lateral tibial plateau fracture ascending to medial (small arrows) involving the intercondylar eminence (arrow-head), and exhibiting a tibial plateau depression (dotted arrow) corresponding to a type II fracture (based on Moore).
c, d Coronal two-dimensional CT reconstructions.
e, f A three-dimensional CT reconstruction facilitates operation planning and shows clearly the extent of articular surface involvement (arrowheads), degree of depression, and fragment position, especially at the intercondylar eminence (large arrow).
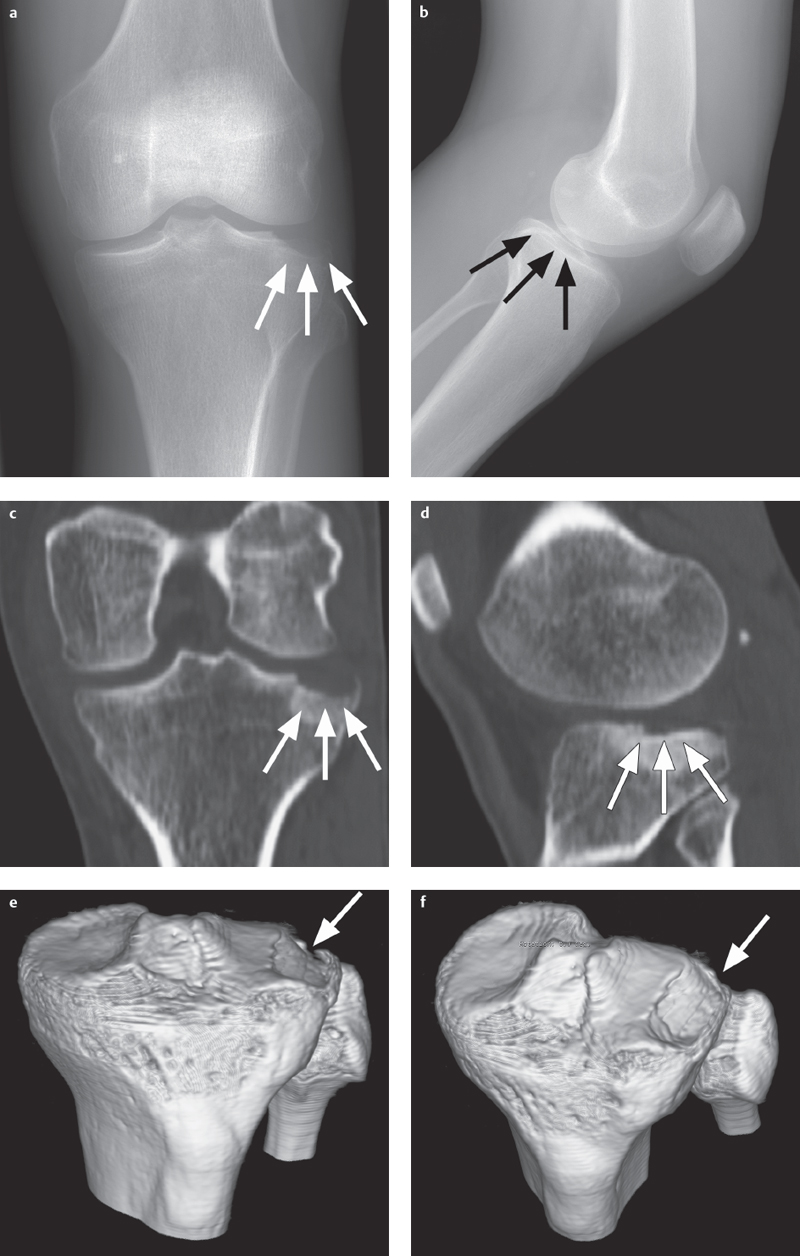
Fig. 2.3 a–f  Complex tibial plateau fracture.
a, b AP and lateral projections. Even conventional radiographic projections allow detection of a complex tibial plateau fracture with lateral plateau depression (arrows) following dislocation of the knee joint.
c, d 2-D reconstruction of the CT data set enables exact classification as a type IV fracture (based on Moore) with a lateral tibial plateau depression (arrows).
e, f 3-D reconstruction offers a better view of the overall situation and extent of the lateral depression (arrow), thus providing the surgeon with valuable additional information.
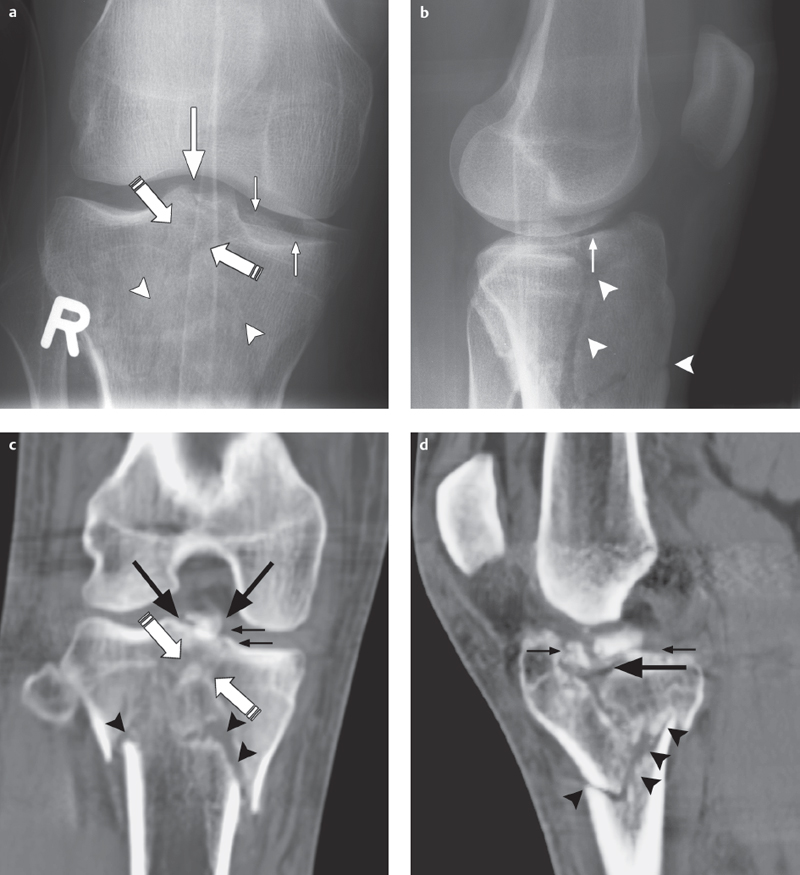
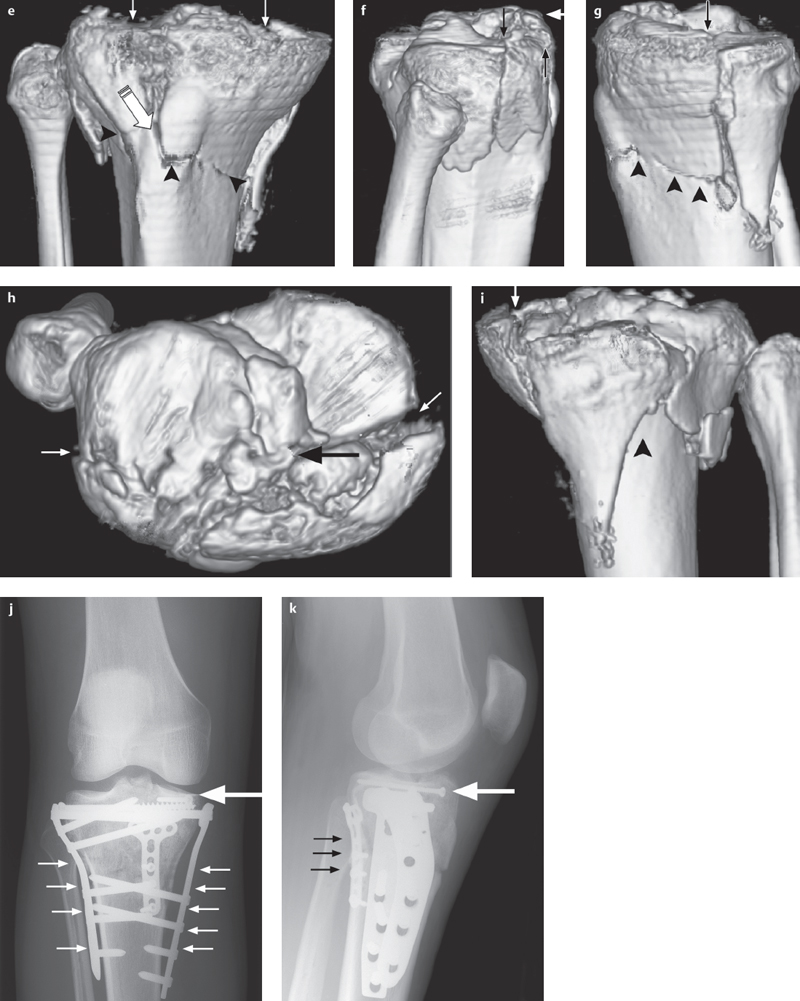
Fig. 2.4 a–k  Comminuted fracture of the tibial plateau.
a, b AP and lateral projections show the extensive involvement of the articular surface (small arrows) and separation of the intercondylar eminence (arrow) from the shaft (arrowhead) and from both condyles (broken arrow) as a type V fracture (based on Moore).
c, d Coronal and sagittal 2-D reconstructions.
e-i 3-D reconstruction is especially advantageous for surgical planning with such complex fractures. The joint fragments (small arrows), shaft fracture (arrow-heads), and separation (large arrows) of the intercondylar eminence are clearly demonstrated in their complex relationship to one another.
j, k Postoperative condition after osteosynthesis using plates (small arrows) and a screw (large arrow).
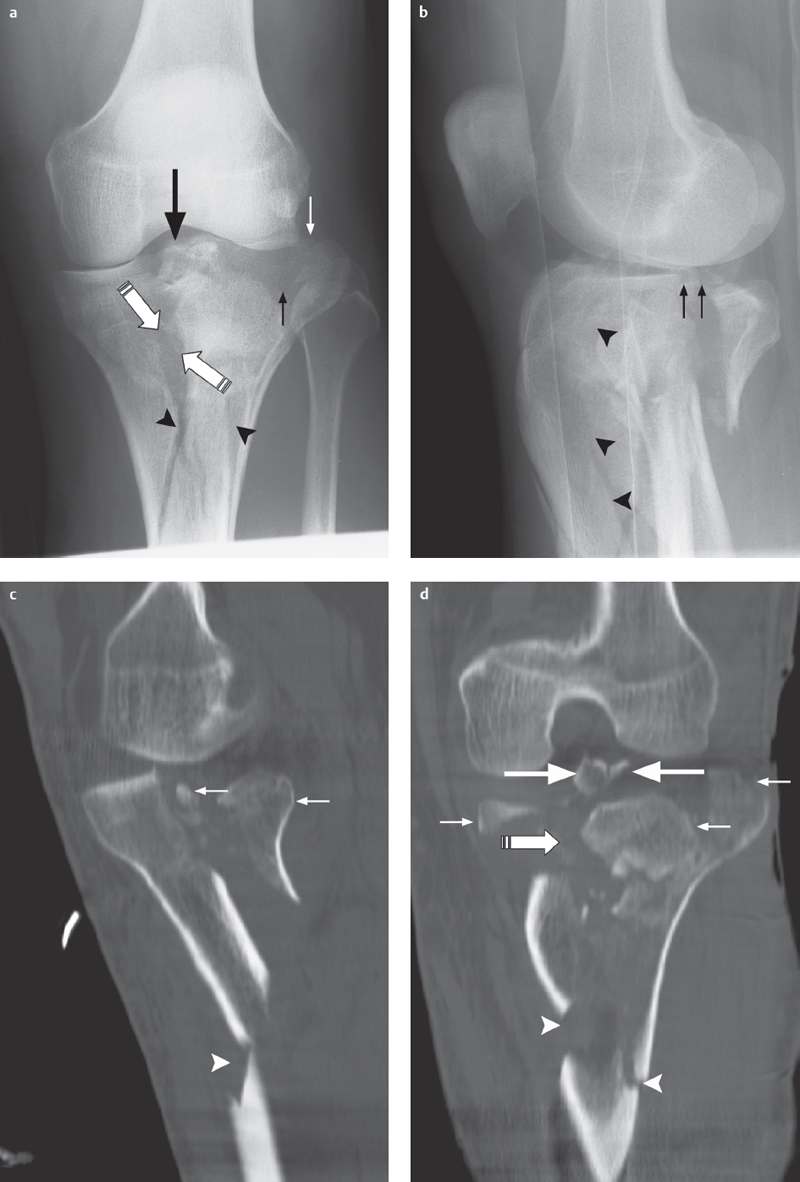
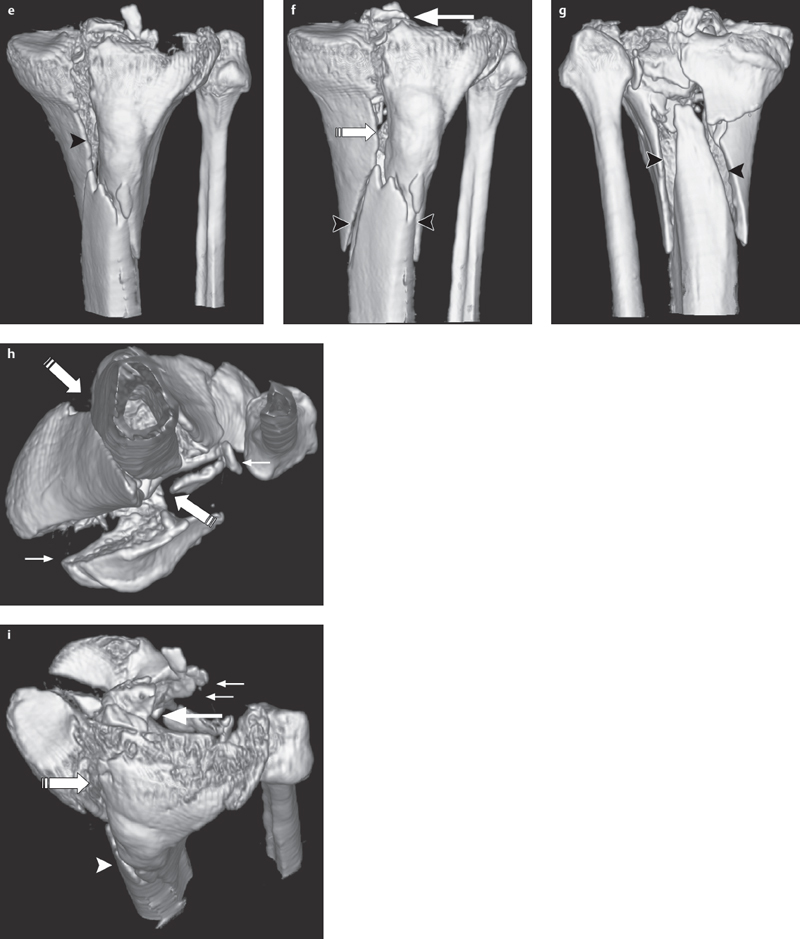
Fig. 2.5 a–i  Complex comminuted fracture of the tibial plateau.
a, b AP and lateral projections show a complex comminuted fracture of the tibial plateau with extensive involvement of the articular surface (small arrows), separation of the intercondylar eminence (large arrow) from the shaft (arrowhead) and separation of both condyles (striped arrow) as in a type V fracture (based on Moore).
c, d 2-D reconstruction, in the coronal and sagittal planes, allows an exact depiction of the overall situation.
e–i 3-D reconstructions, in particular, provide important additional information for surgical planning. Joint fragments (small arrows), the shaft fracture (arrowheads), separation of the condyles (striped arrow), and the separation (large arrow) of the intercondylar eminence are clearly visible here in their relation to one another.
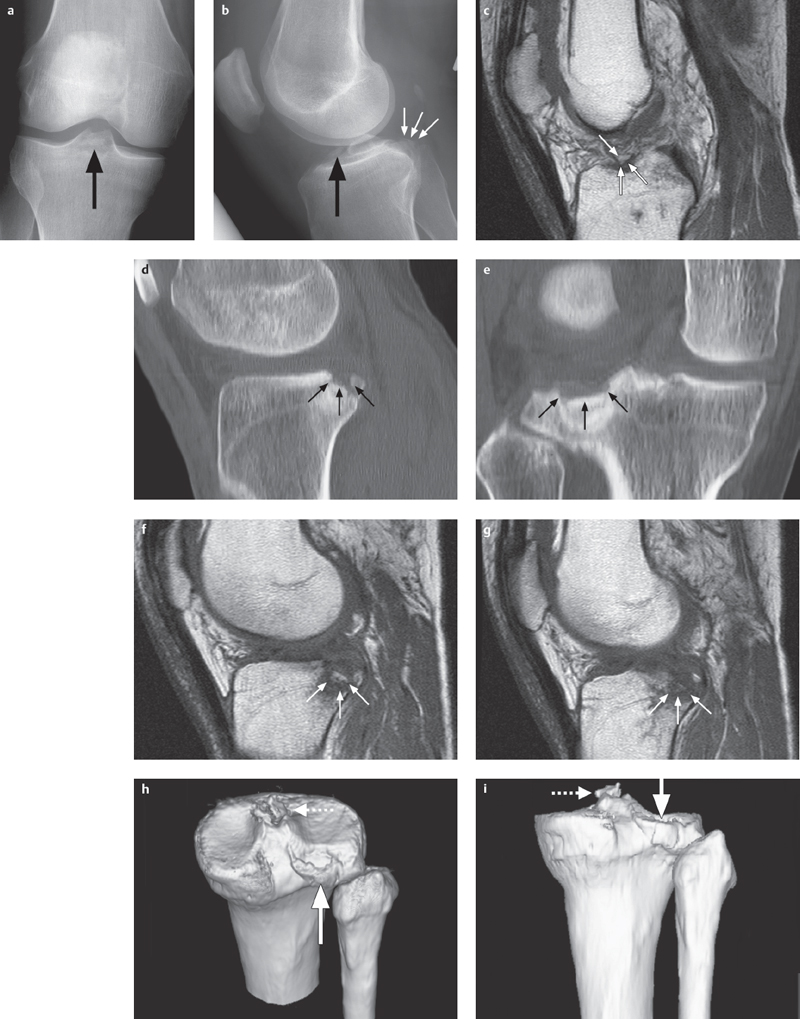
Fig. 2.6 a–i  Avulsion of the cruciate ligament and fracture of the tibial plateau.
a, b This AP radiograph shows a bony avulsion of the anterior cruciate ligament (large arrow), lateral projection additionally shows a displaced fracture of the dorsal tibial plateau (small arrows).
c Using MRI a T1 SE sequence shows the small bony fragment from the tibial avulsion of the anterior cruciate ligament and a surrounding hypointense bone bruise.
d, e 2-D CT reconstructions in the sagittal and coronal planes are best suited for showing the extent of the fracture of the dorsal tibial plateau as well as fragment position (small arrows).
f, g This also applies to the corresponding planes on the T1 SE sequence.
h, i 3-D reconstruction can optimize the overall view, demonstrating the extent of fracture (bold arrow) of the posterolateral tibial plateau and the intercondylar eminence fragment (dotted arrow).
 (→ complementary method, not clinically relevant for fracture diagnosis)
Recommended Imaging Planes
 suprapatellar longitudinal and transverse scan
 infrapatellar longitudinal scan
 medial and lateral imaging plane
 posterior longitudinal plane
Findings
 effusion
 associated injury to ligaments, tendons, muscles, menisci, joint capsule
 functional test (abnormal mobility, instability)
 fracture diagnosis (gap width, joint surface irregularity, signs of consolidation)
 (→ complementary method of choice)
Recommended Imaging Mode
 standard CT:
– slice thickness: 1–2 mm
– table increment: 1–2 mm
– 2-D reconstruction (sagittal and coronal): 1–2 mm slice thickness
– 3-D reconstruction: if joint surface involvement, subtraction of unfractured bones for an unobstructed view of position of fractured articular surface
 (multislice) spiral CT:
– slice thickness: 0.5–2 mm
– table increment: 2–5 mm/rotation
– increment: 0.5–2 mm
– 2-D reconstruction (sagittal and coronal): 1–2 mm slice thickness
– 3-D reconstruction: if joint surface involvement, subtraction of unfractured bones for an unobstructed view of position of fractured articular surface
Findings
 exact determination of localization and extent of fracture
 longitudinal displacement and degree of malrotation, comparing sides
 joint involvement
 number and size of fragments
 fragment (dis)placement
 intra-articular loose bodies
 optimized fracture typing (preferably according to AO classification)
 (→ complementary method, especially for occult fractures, DD bipartite/tripartite patella vs. fracture)
Recommended Sequences
 fat-suppressed sequences whenever possible (with the exception of plain T1-weighted [T1] sequence)
 coronal plain short tau inversion recovery (STIR) sequence
 sagittal and possibly coronal plain T1 and T2-weighted (T2) turbo spin-echo (TSE) sequences (depending on clinical question)
 axial (patellar chondral surface) and/or coronal or sagittal plain fat-saturated, proton density-weighted spin-echo (PD SE) or fat-saturated 2-D or 3-D gradient-echo (GE) sequences for cartilage imaging
 possibly 15–20° angled T1 sequences parallel to the course of the anterior cruciate ligament (ACL) and/or posterior cruciate ligament (PCL) (preferably following administration of a contrast agent if contrast enhancement used in exam)
 possibly angled T1 sequences parallel to the course of the suspected ruptured tendon
 possible contrast enhancement:
 to identify fracture gap
– with osteochondral fragments for demonstrating the extent and degree of perfusion/tissue viability
– to better differentiate between traumatic and inflammatory lesions
– postsurgery to differentiate between ligament replacement and granulation tissue or between traumatic and postoperative scarring and granulation tissue
Findings
 general:
– cartilage, bone, or osteochondral fractures
– determination of fracture age
– cartilage damage
– detection of earlier occult fractures (possibly more than one year old)
– pseudarthrosis
– lateral contusion zone with medial ligament lesion
– medial contusion zone with lateral ligament lesion
– posterolateral contusion zone with ACL lesion (recognizable for up to three-quarters of a year, localization always epimetaphyseal)
– potential simulation of bone bruise by nonfatty areas in the bone marrow
– potential fracture simulation by incomplete ossification of the epiphyseal plate
– possible simulation of traumatic lesions by benign (nonossifying fibroma, fibrous cortical defect, benign fibrous histiocytoma, cysts, giant cell tumor) or malignant tumors
 plain T1 SE sequence:
– hypointense fracture gap or pseudarthrosis
– patchy, poorly demarcated hypointense bone bruise (bone marrow hematoma/bone marrow edema)
– hypointense demonstration of an osteochondral fragment/surrounding sclerotic margin/osteochondral defect
 plain STIR/T2-weighted (T2) SE sequence:
– hyperintense fracture gap or pseudarthrosis
– patchy, poorly demarcated hyperintense bone bruise (bone marrow hematoma/bone marrow edema)
– hyperintense edematous osteochondral fragment/osteochondral lesion
– hypointense demonstration of sclerotic osteochondral fragment/surrounding reactive sclerotic margin
 contrast-enhanced T1 SE sequence (preferably fat saturated):
– hypointense fracture gap, hyperintense/hypointense pseudarthrosis (depending on extent of granulation tissue and sclerosis)
– patchy, poorly demarcated hyperintense or hypointense bone bruise (bone marrow hematoma/bone marrow edema)
– hyperintense to hypointense demonstration of osteochondral fragment
– hypointense demonstration of sclerotic margin/osteochondral lesion
 fat-saturated PD 2-D GE/3-D GE sequences:
– hyperintense areas of cartilage damage
Basic Treatment Strategies
 conservative or operative treatment depending on fracture type
 especially with joint involvement: open reduction and internal fixation (ORIF)
Pathologic Fracture
Definition
A pathologic fracture is a complete or incomplete disruption in continuity of bone with local or diffuse pathologic osseous changes. Fracture mayoccur without trauma or as the result of insignificant trauma with or without dislocation.
The cause of fracture may be a result of benign or malignant processes.
Pathology
 macroscopic:
– disruption in cortical and/or cancellous bone
– destruction of bone surrounding the fracture
– dislocation, varus/valgus malalignment
– bone marrow hematoma
– associated soft tissue injury
– soft tissue changes related to local destructive bone processes
 microscopic:
– edema
– hemorrhage
– trabecular disruption/compressed trabecular bone
– absence of callus formation
– bone and soft tissue changes related to local destructive bone processes
– traumatic and nontraumatic uninterrupted or interrupted periosteal reaction
– cartilage defects
Role of Imaging
 demonstration of full extent of cortical and cancellous fractures as well as injury to soft tissue structures
 demonstration of fragment shape, position, and localization
 demonstration of joint and joint surface involvement
 evaluation of local (in)stability
 demonstration of full extent of intraosseous and extraosseous pathologic processes
 relation to surrounding vessel–nerve structures
 signs of additional tumor manifestations
Clinical Signs
 deformity
 abnormal mobility
 crepitation
 functional loss
 localized spontaneous pain, tenderness, pain with movement
 local swelling
 local bruising
 local soft tissue changes associated with local destructive processes of the bone or underlying systemic disease
Diagnostic Evaluation
 (→ method of choice)
Recommended Radiography Projections
 standard projections:
– AP projection
– lateral projection, mediolateral roentgen ray path
 special projections (depending on fracture localization):
– Tunnel view/Notch view to demonstrate intercondylar fossa and eminence
– axial projection of the patella
– “defilée” views (axial projection with knee bent 30°, 60°, 90°) of the patella to demonstrate the patellofemoral joint
– 45° oblique views for better evaluation of the tibial plateau and proximal fibula
 conventional tomography:
– almost entirely replaced by multislice CT and 2-D/3-D reconstructions
– at most may be indicated for postoperative surveillance (position, integration) if extensive metal implants are causing artifacts in CT
Findings
 path of fracture lines
 fracture localization and extent
 fragment (dis)placement
 number of fragments
 fracture type (preferably according to AO classification)
 joint involvement
 local destructive bone processes
 thickening of soft tissue
 systemic changes in bone structure (e.g., osteoporosis)
 (→ complementary method)
Recommended Imaging Planes
 suprapatellar longitudinal and transverse scan
 infrapatellar longitudinal scan
 medial and lateral imaging plane
 posterior longitudinal plane
Findings
 effusion
 associated injury to ligaments, tendons, muscles, menisci, joint capsule
 functional test (abnormal mobility, instability)
 fracture diagnosis (gap width, joint surface involvement, signs of consolidation)
 cortical destruction
 soft tissue masses/infiltration
 associated soft tissue reaction
 (→ complementary method)
Recommended Imaging Mode
 standard CT:
– slice thickness: 1–2 mm
– table increment: 1–2 mm
– 2-D reconstruction (sagittal and coronal): 1–2 mm slice thickness
– 3-D reconstruction for complete imaging of destruction or masses
 (multislice) spiral CT:
– slice thickness: 0.5–2 mm
– table increment: 2–5 mm/rotation
– increment: 0.5–2 mm
– 2-D reconstruction (sagittal and coronal): 1–2 mm slice thickness
– 3-D reconstruction for complete imaging of destruction or masses
Findings
 exact determination of localization and extent of fracture
 joint involvement
 number and size of fragments
 fragment (dis)placement
 intra-articular loose bodies
 optimized fracture typing (preferably according to AO classification)
 local bone destruction associated with underlying disease
 soft tissue involvement associated with local destructive bone processes
 systemic changes to bone structure (e.g., osteoporosis)
 longitudinal displacement and degree of malrotation, comparing sides
 (→ complementary method of choice)
Recommended Sequences
 fat-suppressed sequences should be used whenever possible (with the exception of plain T1 sequence)
 coronal STIR sequence
 plain sagittal T2 TSE sequences
 plain sagittal or coronal T1 SE sequences (depending on clinical question)
 contrast-enhanced axial and sagittal and/or coronal T1 SE sequences (depending on clinical question) to identify fracture gap and intramedullary or extramedullary tumor infiltration
 if needed, contrast-enhanced opposed-phase sequences to identify further tumor manifestations in the axial skeleton
Findings
 plain T1 SE sequence:
– hypointense fracture gap
– patchy, poorly demarcated hypointense bone bruise (bone marrow hematoma/bone marrow edema)
– hypointense and/or hyperintense intramedullary and extramedullary connective tissue tumor
 plain STIR/T2 SE sequence:
– hyperintense fracture gap
– patchy, poorly demarcated hyperintense bone bruise (bone marrow hematoma/bone marrow edema)
– hypointense and/or hyperintense intramedullary and extramedullary connective tissue tumor
 contrast-enhanced T1 SE sequence (fat saturated except with lipomatous tumors):
– hypointense fracture line
– patchy, poorly demarcated hyperintense to hypointense bone bruise (bone marrow hematoma/bone marrow edema)
– hypointense intramedullary and extramedullary connective tissue tumor (depending on tumor perfusion)
– contrast-enhanced opposed-phase sequences of axial skeleton:
– hyperintense demonstration of additional tumor manifestations
 (→ complementary method)
Recommended Imaging Mode
 planar (whole body) and/or SPECT (spot imaging) skeletal nuclear medicine
 administration of 550–750 MBq or 7.4–11.1 MBq/kg 99mTc-MDP per i.v.
Findings
 demonstration of extent of local tumor infiltration
 increased uptake at sites of additional tumor manifestations in the skeletal system
Basic Treatment Strategies
Benign processes
 single or (possibly) two-session removal and reconstruction using autograft or allograft
Joint preservation
 compound osteosynthesis
Joint replacement
 total knee endoprosthesis
 allograft reconstruction
 composite allograft reconstruction
Fatigue Fracture, Stress Fracture
Definition
A complete or incomplete disruption in continuity of a healthy bone resulting from repetitive overuse with or without dislocation is known as a fatigue fracture or stress fracture.
Pathology
 macroscopic:
– disruption in cortical and/or cancellous bone
– endosteal and periosteal new bone formation
– bone marrow hematoma
– associated reactive soft tissue changes
 microscopic:
– microfractures
– imbalance in osteoblastic and osteoclastic cell activity
– osteoclastic resorption zones with areas of new lamellar bone formation
– edema
– hemorrhage
– trabecular disruption/compressed trabecular bone
– reactive soft tissue changes related to local bone processes
– cartilage defects
Clinical Signs
 pain at rest, pain with excessive activity (e.g., long-distance runners)
 localized spontaneous pain, tenderness, pain with movement
 local swelling
 functional loss
 other fracture signs generally mild if present at all
 often no symptoms
 often low body weight (especially among women)
Role of Imaging
 primary detection of stress fracture
 demonstration of full extent of fracture or area of bone transformation
 demonstration of fragment position
 demonstration of articular surface involvement and cartilage lesions
 demonstration of possible soft tissue injury
 demonstration of additionally overloaded osseous structures at risk for fracture as well as soft tissue structures demonstrating inflammatory reactive processes or at risk of rupture
 evaluation of local (in)stability
Diagnostic Evaluation
 (→ method of choice)
Recommended Radiography Projections
 standard projections:
– AP projection
– lateral projection, mediolateral roentgen ray path
 special projections (depending on fracture localization):
– Tunnel view/Notch view to demonstrate intercondylar fossa and eminence
– axial projection of the patella
– “defilée” views (axial projection with knee bent 30°, 60°, 90°) of the patella to demonstrate the patellofemoral joint
– 45° oblique views for better evaluation of the tibial plateau and proximal fibula
 conventional tomography:
– almost entirely replaced by multislice CT and 2-D/3-D reconstructions and MRI
Findings
 mild or early-stage fracture:
– minimal surrounding soft tissue edema possible
– increased cortical transparency and blurriness
– positive scintigram
 moderate or later-stage fracture:
– lamellar periosteal reaction
– bone marrow edema
– positive MRI
 severe or late-stage fracture:
– ossifying periostitis (reactive apposition of osteosclerotic lamellar bone)
– endosteal thickening
– poorly defined, sclerotic, linear condensation of cancellous and cortical bone along the fracture line
– surrounding soft tissue edema or hematoma
– positive radiograph
Basic Treatment Strategies
 Without dislocation
 relatively early physical therapy
 temporary immobilization
 possible temporary orthosis
 possible temporary orthopedic shoes
 possible short-term calcium and vitamin D supplements
With dislocation
 reduction
 fixation
 (→ complementary method)
Findings
 no diagnostic value
 (→ complementary method)
Recommended Imaging Mode
 standard CT (no longer up-to-date):
– slice thickness: 1–2 mm
– table increment: 1–2 mm
– 2-D reconstruction (sagittal and coronal): 1–2 mm slice thickness
– 3-D reconstruction generally of little use given lacking dislocation
 (multislice) spiral CT, possibly in addition to MRI:
– slice thickness: 0.5–2 mm
– table increment: 2–5 mm/rotation
– increment: 0.5–2 mm
– 2-D reconstruction (sagittal and coronal): 1–2 mm slice thickness
– 3-D reconstruction of little use given lacking dislocation
Findings
 detection and demonstration of fracture line
 demonstration of surrounding reactive sclerotic zone
 (→ complementary method of choice)
Recommended Sequences
 fat-suppressed sequences should be used whenever possible (with the exception of plain T1 sequence)
 coronal STIR sequence
 plain sagittal T2 TSE sequences
 plain axial, sagittal, and/or coronal T1 SE sequences (according to clinical question) depending on suspected fracture localization
 contrast-enhanced imaging to identify fracture gap and potential intramedullary/extramedullary tumor infiltration or osteomyelitis
MRI Classification Based on the Cincinnati Knee Rating System
 grade I:
– hyperintense on STIR images
– unremarkable on T1 sequences
– involving marrow cavity only
 grade II:
– hyperintense on STIR images
– hypointenseon T1 sequences
– involving marrow cavity only
 grade III:
– hyperintense on STIR images
– hypointenseon T1 sequences
– involving marrow cavity and cortical bone
 grade IV:
– hyperintense on STIR images
– hypointense on T1 sequences
– involving marrow cavity, cortical bone, and cartilage
Findings
 plain T1 SE sequence:
– hypointense fracture gap, if detectable
– patchy, poorly defined hypointense bone bruise (bone marrow hematoma/bone marrow edema)
– hypointense demonstration of cancellous and cortical sclerosis
– hypointense demonstration of surrounding soft tissue edema/hematoma (the latter depending on hemorrhage age)
 plain STIR/T2 SE sequence:
– hyperintense fracture gap
– patchy, poorly defined hyperintense bone bruise (bone marrow hematoma/bone marrow edema)
– hypointense demonstration of cancellous and cortical sclerosis
– hypointense demonstration of surrounding soft tissue edema/hematoma (the latter depending on hemorrhage age)
 contrast-enhanced T1 SE sequence (preferably fat saturated):
– hypointense fracture gap
– patchy, poorly defined hyperintense to hypointense bone bruise (bone marrow hematoma/bone marrow edema)
– hypointense demonstration of cancellous and cortical sclerosis
 (→ complementary method)
Recommended Imaging Mode
 planar (whole body) and/or SPECT (spot imaging) skeletal nuclear medicine
 administration of 550–750 MBq or 7.4–11.1 MBq/kg 99m Tc-MDP per i.v.
Findings
 increased uptake at fracture sites even in the earliest stages
Chondral and Osteochondral Fractures
Definition
Chondral and osteochondral fractures involve traumatic damage to the cartilage and the subchondral bone, caused by excessive shearing and/or rotational forces, and may be associated with the formation of loose intra-articular osteochondral fragments.
Pathology
 traumatic chondral, cortical, and cancellous fragment separation
 compression, impaction, and/or cancellous subchondral fracture with intact cartilage
 isolated traumatic cartilage damage
 surrounding bone marrow edema/hematoma
Stages (Based on A. Greenspan)
 stage I:
– undisplaced subchondral bone fragment
 stage II:
– undisplaced cartilage and subchondral bone fragment
 stage III:
– displaced cartilage, undisplaced subchondral bone fragment
 stage IV:
– displaced cartilage and bone fragment
Clinical Signs
 pain at rest, weight-bearing pain
 nonspecific pain and limited function
 joint obstruction
 hemarthrosis/joint effusion
Diagnostic Evaluation
 (→ initial method)
Recommended Radiography Projections
 standard projections:
– AP projection
– lateral projection, mediolateral roentgen ray path
 special projections (depending on fracture localization):
– Tunnel view/Notch view to demonstrate intercondylar fossa and eminence
– axial projection of the patella
– “defilée” views (axial projection with knee bent 30°, 60°, 90°) of the patella to demonstrate the patellofemoral joint
– 45° oblique views for better evaluation of the tibial plateau and proximal fibula
 conventional tomography:
– almost entirely replaced by multislice CT and MRI
Findings
 disruption/irregularity in cortical bone
 subchondral condensation of bone
 partial or complete fragment separation
 displaced osteochondral fragment/intra-articular loose bodies
 empty osteochondral lesion
 (→ complementary method)
Recommended Imaging Planes
 suprapatellar longitudinal and transverse scan
 infrapatellar longitudinal scan
 medial and lateral imaging plane
 posterior longitudinal plane
Findings
 joint effusion
 associated reaction in surrounding soft tissues (low to high echogenicity possible)
 demonstration of irregularity in cortical bone or empty osteochondral lesion
 often fruitless however
 (→ complementary method)
Recommended Imaging Mode
 standard CT:
– slice thickness: 1–2 mm
– table increment: 1–2 mm
– 2-D reconstruction (sagittal and coronal): 1–2 mm slice thickness
– 3-D reconstruction
 (multislice) spiral CT:
– slice thickness: 0.5–2 mm
– table increment: 2–5 mm/rotation
– increment: 0.5–2 mm
– 2-D reconstruction (sagittal and coronal): 1–2 mm slice thickness
– 3-D reconstruction
Findings
 subchondral sclerosis
 subchondral impaction of bone
 empty osteochondral lesion
 loose intra-articular osseous bodies
 localization of the defect and fragments
 (→ complementary method of choice)
Recommended Sequences
 coronal STIR sequence
 plain sagittal T2 TSE sequences
 plain axial, sagittal, and/or coronal T1 SE sequences (according to clinical question) depending on presumed fracture localization
 (fat-saturated) PD or 2-D GE/3-D GE sequences to demonstrate cartilage
 contrast-enhanced imaging for evaluation of perfusion and demonstration of fracture gap
Findings
 plain T1 SE sequence:
– hypointense fracture gap
– patchy, poorly defined hypointense subchondral bone bruise (bone marrow hematoma/bone marrow edema)
– hypointense demonstration of cortical and cancellous sclerosis
– hypointense demonstration of fragment
 plain STIR/T2 SE sequence:
– hyperintense fracture gap
– patchy, poorly defined hyperintense subchondral bone bruise (bone marrow hematoma/bone marrow edema)
– hypointense demonstration of cortical and cancellous sclerosis
– hypointense demonstration of fragment
 T1 SE sequence after administering a contrast agent (preferably fat saturated):
– hypointense fracture gap
– patchy, poorly defined hyperintense to hypointense bone bruise (bone marrow hematoma/bone marrow edema)
– hypointense demonstration of cortical and cancellous sclerosis
– hypointense to hyperintense demonstration of fragment depending on perfusion conditions
 PD/GE sequences (preferably fat saturated):
– demonstration of cartilage damage
Role of Imaging
 demonstration of entire region of detachment and fragment size
 demonstration of detachment site localization
 demonstration of fragment displacement and intra-articular localization
 demonstration of perfusion in the area of detachment
 demonstration of surrounding osseous reaction and ligament condition
Basic Treatment Strategies
Without dislocation
 temporary immobilization
 possible relief of affected segment with a brace
With dislocation
 arthroscopic or open reduction of the fragment
 osteochondral cylinder transplantation (OCT)
Occult Fracture, Bone Bruise
Definition
An occult fracture is a subchondral bone contusion caused by trauma, which can only be identified by means of MRI.
Pathology
 macroscopic:
– disruption in cancellous bone
– associated soft tissue injury
– bone marrow hematoma/edema
– epimetaphyseal localization
– localization more often lateral than medial
– often associated with contralateral collateral ligament injury
– posterolateral bone bruise of tibial plateau often with ACL rupture
– detectable up to 3/4 of a year post trauma
 microscopic:
– edema
– hemorrhage
– no cortical disruption
– trabecular disruption
– compressed trabecular bone
– periosteal tear
– cartilage defects/disruption
Common Localizations
 anterior femoral condyle/anterior tibial plateau with PCL rupture
 posterior femoral condyle/posterolateral tibial plateau with ACL rupture
 medial dorsal patella/lateral femoral condyle with patella dislocation
Role of Imaging
 primary detection of fracture
 extent of bone bruise
 demonstration of potential cartilage damage
 exclusion of (previously unnoticed) cortical disruption
 demonstration of possible, associated soft tissue damage
Clinical Signs
 localized tenderness
 localized pain with movement
 local swelling
 joint effusion
Diagnostic Evaluation (Fig. 2.7)
 (→ to exclude fracture)
Recommended Radiography Projections
 standard projections:
– AP projection
– lateral projection, mediolateral roentgen ray path
 special projections (depending on fracture localization):
– Tunnel view/Notch view to demonstrate intercondylar fossa and eminence
– axial projection of the patella
– “defilée” views (axial projection with knee bent 30°, 60°, 90°) of the patella to demonstrate the patellofemoral joint
– 45° oblique views for better evaluation of the tibial plateau and proximal fibula
 conventional tomography:
– not indicated
Findings
 generally does not assist in diagnosis
 local thickening due to swelling/effusion

Findings
 does not yield any diagnostic clues
 (→ not very helpful, supplementary method)
Recommended Imaging Mode
 standard CT:
– slice thickness: 1–2 mm
– table increment: 1–2 mm
– 2-D reconstruction (sagittal and coronal): 1–2 mm slice thickness
– 3-D reconstruction generally of little use given lacking dislocation
 (multislice) spiral CT:
– slice thickness: 0.5–2 mm
– table increment: 2–5 mm/rotation
– increment: 0.5–2 mm
– 2-D reconstruction (sagittal and coronal): 1–2 mm slice thickness
– 3-D reconstruction generally of little use given lacking dislocation
Findings
 joint effusion
 hypodense edema/hematoma
 generally does not assist in diagnosis
 (→ procedure of choice for exact diagnosis)
Recommended Sequences
 STIR sequence
 plain T2 TSE sequences
 plain T1 SE sequences
 contrast-enhanced imaging only for excluding inflammatory or malignant lesions
Findings
 general:
– differentiation between linear (previously undetected, undisplaced fracture with risk of dislocation) and purely diffuse (without recognizable fracture line demarcation) contusion
– depending on severity of primary fracture, detection of bone bruise up to two or even (rarely) nine months later
 plain T1 SE sequence:
– inhomogeneously structured, irregular, and poorly demarcated (linear in occult fractures), hypointensity near the epimetaphyseal cortical bone
 plain STIR/T2 SE sequence:
– inhomogeneously structured, irregular, and poorly demarcated (linear in occult fractures), hyperintensity (edema) to hypointensity (blood) near the epimetaphyseal cortical bone
 contrast-enhanced T1 SE sequence (preferably fat saturated):
– marked inhomogeneous enhancement, except at fracture line
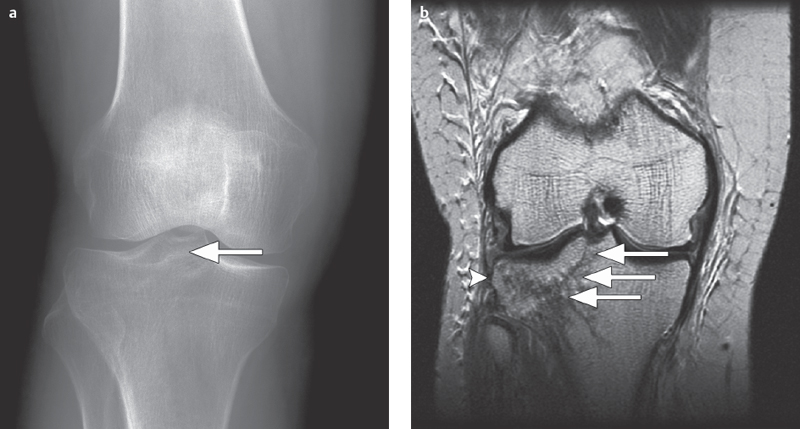
Fig. 2.7a,b  Partially occult tibial plateau fracture.
a A conventional AP radiographic image can barely allow evaluation, of a partially, occult right lateral paramedian tibial plateau fracture (arrow).
b On a coronal T2 FR-FSE sequence the full extent of the fracture can now be seen running through the entire lateral tibial plateau and involving the intercondylar eminence (long arrow) with surrounding contusion (bone bruise, arrowhead).
Possible Classifications
 Mink, Deutsch 1989:
– a bone bruise, like a stress fracture, belongs to a subgroup of occult fractures
 Lynch et al. 1989:
– bone marrow contusion without (type 1) or with (type 2) disruption in cortical bone
 Vellet et al. 1991:
– “reticular bone bruise” (= netlike alterations on MR views without subchondral involvement) or
– “geographic bone bruise” (=foci of discretely altered signal intensity involving subchondral bone) depending on contusion pattern and localization
 Detmer 1986:
 grade I: bone edema (increased signal intensity on T2 MRI sequences)
 grade II: periosteal inflammation or edema
 grade III: additional involvement of muscle
DD-Important Note
 hematopoietic bone marrow: hypointense on T1 views, discretely hyperintense on T2 sequences
 unclosed epiphyseal plate: intermediary signal on T1 views, slightly hyperintense on T2 sequences, mostly sharply contoured without surrounding blurry area
 fibrous cortical defect, nonossifying fibroma: eccentric, clearly demarcated, involving cortical bone, often sclerotic margin (hypointense on T1 and T2 sequences), no contrast enhancement
Basic Treatment Strategies
 possible temporary immobilization depending on clinical symptoms
Osteochondritis Dissecans
Definition
Osteochondritis dissecans describes the tendency of cartilage and/or bone fragments (usually elliptical in shape) to separate from a circumscribed area of subchondral osteonecrosis, causing an osteochondral defect and the formation of an intra-articular loose body. Disease etiology remains uncertain, though trauma, microembolisms, and constitutional factors have been suggested. There is no sex predilection. Traumatic causes are more often found among younger patients active in sports. Spontaneous osteonecrosis of the knee (SONK) is more often found among older, women patients and is frequently associated with cartilage or meniscal lesions and joint effusion.
Pathology
 may be similar to osteonecrosis depending on stage
 osteonecrosis found more frequently among women (75%), older ages, combined with cartilage/meniscal lesions and joint effusion
Stages
(Modified Based on J. Kramer et al.)
 stage I:
– subchondral edema, nonspecific
 stage II (undisplaced cartilage and bone fragment):
– demarcated by narrow sclerotic margin
– possible limited bone marrow changes next to demarcation
 stage III (undisplaced cartilage and bone fragment):
– fibrovascular scar within sclerotic border
– separation beginning near the edges
– sometimes cyst formation in adjacent bone
 stage IV (displaced cartilage, undisplaced bone fragment):
– completely loose fragment at the detachment site, usually surrounded by fluid
 stage V (displaced cartilage and bone fragment):
– dislocation of the fragment
– increasing bony flattening of the osteochondral defect
Role of Imaging
 primary detection of lesion
 demonstration of extent and severity of cartilage damage
 demonstration of intra-articular loose bodies
 evaluation of viability and subchondral stability
 evaluation of condition of surrounding bone
Localization
 ca. three-quarters on the medial surface of medial femoral condyle
 ca. one-tenth on the weight-bearing surface of the medial femoral condyle
 ca. one-tenth on the weight-bearing surface of the lateral femoral condyle
 clearly less frequent in other regions of the femoral condyles or patella
 SONK is more common on weight-bearing surfaces of the medial femoral condyle while osteochondritis dissecans is more common on its non-weight-bearing surfaces
Clinical Signs
 long asymptomatic
 signs of impingement of intra-articular loose body
 possible painful limitation of motion
 swelling
 possible effusion
 early arthritis
Diagnostic Evaluation (Figs. 2.8–2.10)
 (→ method of choice)
Recommended Radiography Projections
 standard projections:
– AP projection
– lateral projection, mediolateral roentgen ray path
– surveillance
 special projections (depending on fracture localization):
– Tunnel view/Notch view to demonstrate intercondylar fossa and eminence
– axial projection of the patella
– “defilée” views (axial projection with knee bent 30°, 60°, 90°) of the patella to demonstrate the patellofemoral joint
– 45° oblique views for better evaluation of the tibial plateau and proximal fibula
 conventional tomography:
– almost entirely replaced by multi-slice CT and 2-D/3-D reconstructions and MRI
Findings
 stage I:
– no visible change
 stage II:
– usually no visible change
– possibly more or less circumscribed, demarcating osteopenia, sclerotic margin
 stage III:
– beginning subchondral lucency between fragment and osteochondral defect
– sclerosis of the fragment
– beginning disruption in subchondral bone
– cyst formation adjacent to the osteochondral lesion
 stage IV:
– increasing subchondral lucency between fragment and osteochondral lesion
– complete disruption in subchondral bone
 stage V:
– intra-articular loose bodies, empty osteochondral lesion
– secondary degeneration
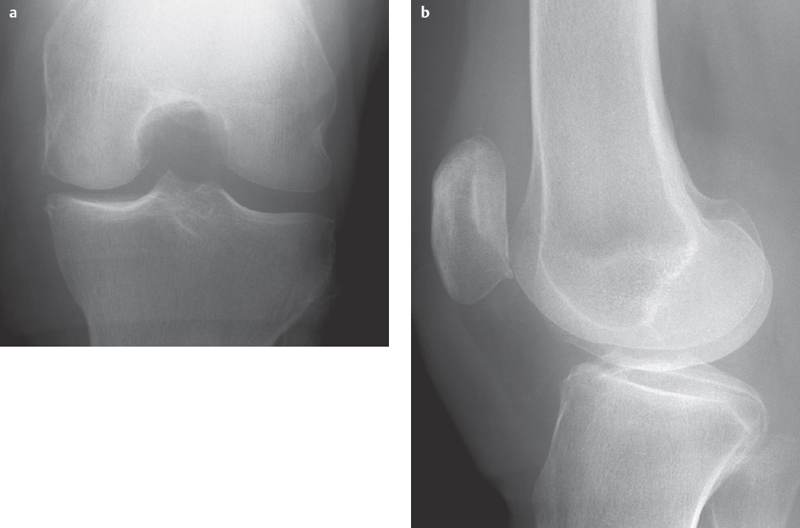
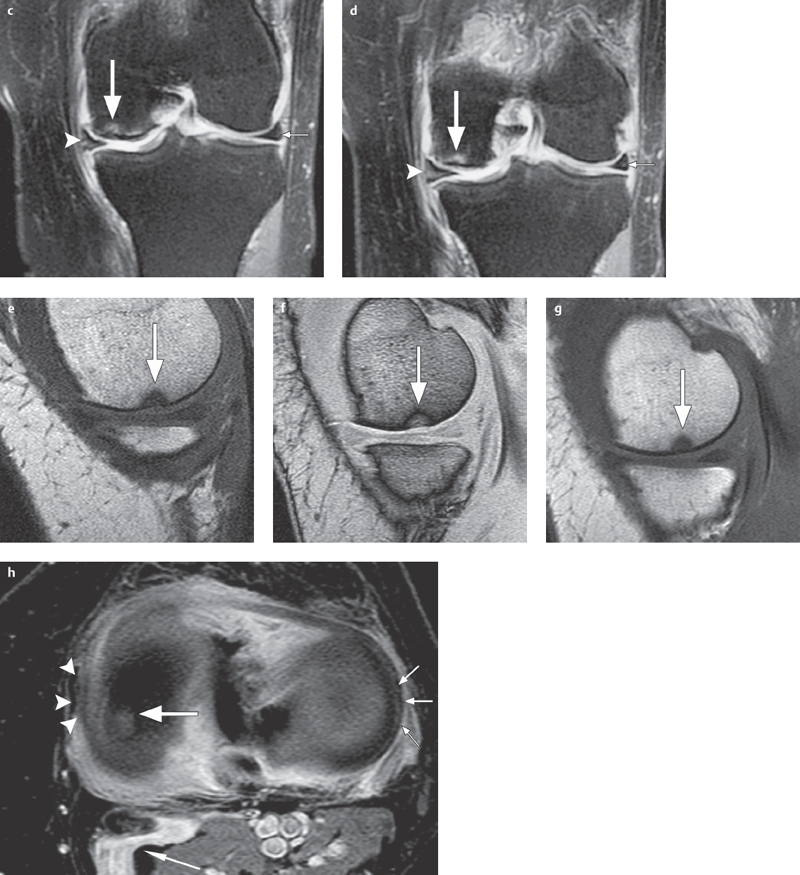
Fig. 2.8 a–h  Early-stage osteochondritis dissecans.
a, b Barely distinguishable using conventional radiography.
c, d
Stay updated, free articles. Join our Telegram channel

Full access? Get Clinical Tree


