Chapter 8 Uncommon Causes of Stroke
Imaging can be invaluable when evaluating patients with stroke of unknown cause. Sometimes it provides the diagnosis, and sometimes clues to guide additional investigations. This chapter illustrates some of the many infrequent causes of stroke and highlights the ways in which neuroimaging can contribute to their identification. For a more comprehensive review on the topic of uncommon causes of stroke, the reader is referred to a monograph edited by Caplan and Bogousslavsky.1
CERVICOCRANIAL ARTERIAL DISSECTIONS
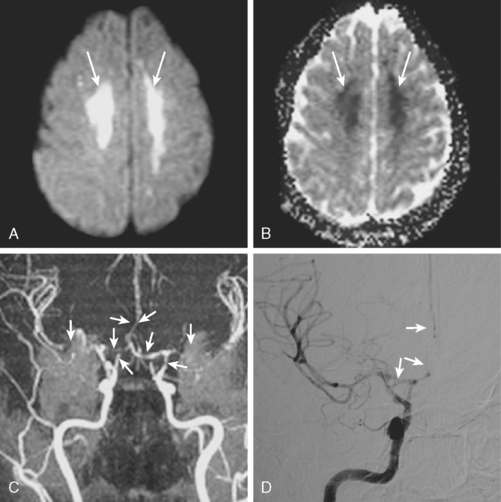
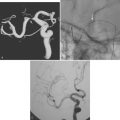
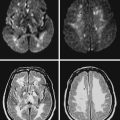
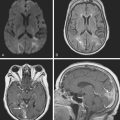
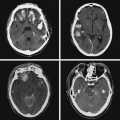
A 41-year-old man with history of smoking and amphetamine use presented to the emergency department with acute confusion, right gaze preference, left homonymous hemianopia, left hemiplegia (involving face, arm, and leg) and marked left-sided neglect. Three hours before the onset of these deficits, he had complained of severe headache and had tried to go to sleep. Upon awakening, the neurological deficits were established. Computed tomography (CT) scan showed a hyperdense sign in the top of the internal carotid and middle cerebral arteries (Figure 8-1, A–B). The patient was emergently taken to the angiographic suite, and a catheter angiogram revealed occlusion of the right internal carotid artery 1.5 to 2 cm beyond its origin (Figure 8-1, E). No revascularization therapy was attempted because of the site of the occlusion, acceptable collateral pathways (the anterior communicating artery and posterior communicating arteries were open), and because the patient started seizing and had to be rapidly transferred to the intensive care unit for anticonvulsive treatment. His blood pressure was augmented with fluids and vasopressors, but he developed a large stroke in the middle cerebral artery territory, as shown on the magnetic resonance imaging (MRI) scan performed within 24 hours of admission (Figure 8-1, C–D). He recovered well but was still moderately disabled at 3-month follow-up. At that time, a magnetic resonance angiogram (MRA) showed persistent occlusion of the right internal carotid artery (Figure 8-1, F).
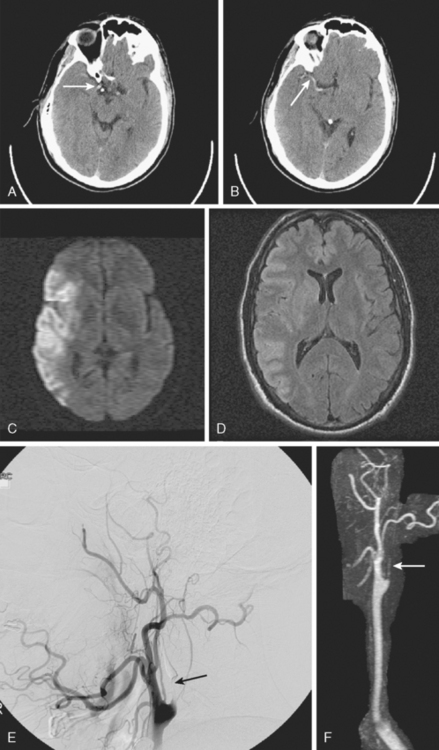
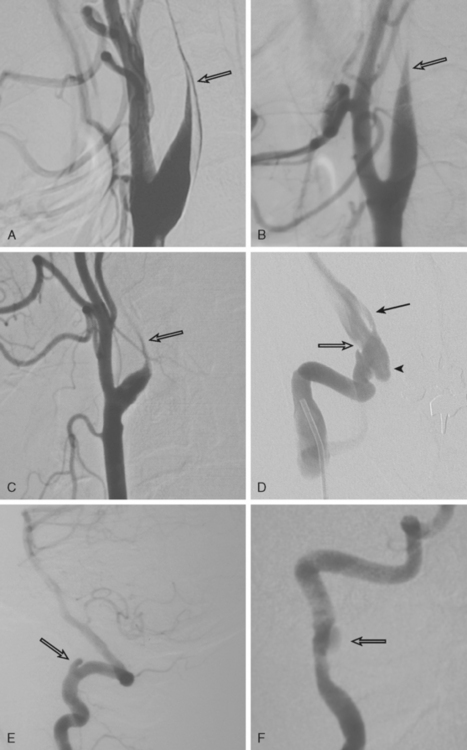
TABLE 8-1 Angiographic signs of cervical artery dissections.
| Tapered luminal narrowing (string sign) |
| With stenosis |
| With occlusion |
| Pseudo-aneurysm (segmental dilatations) |
| Oval segmental dilatation of the lumen |
| Extraluminal pouch |
| Small dilatation at the end of a string sign |
| Intimal flap* |
| Double lumen |
| High carotid stenosis or occlusion |
* Usually only seen on catheter angiography but sometimes noted on thin axial cuts of magnetic resonance imaging scans.
AORTIC DISSECTIONS
FIBROMUSCULAR DYSPLASIA
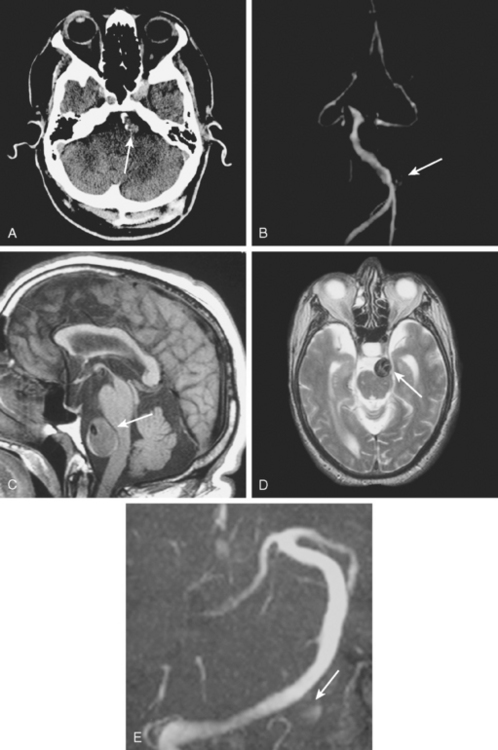
DOLICHOECTASIA
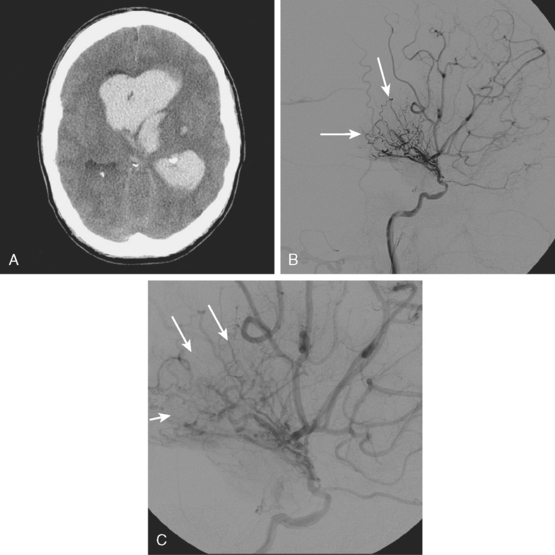
MOYAMOYA
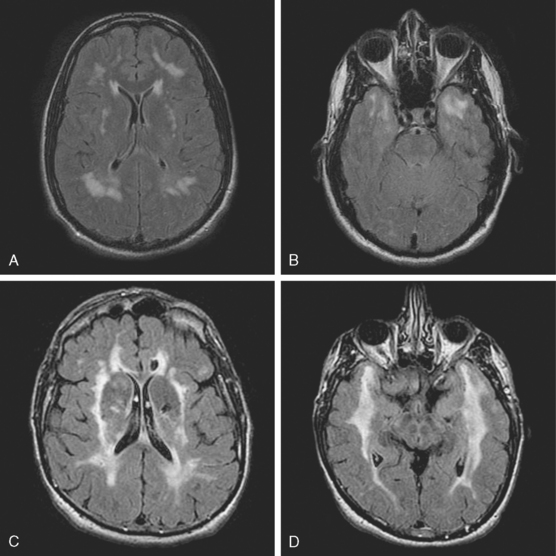
CADASIL
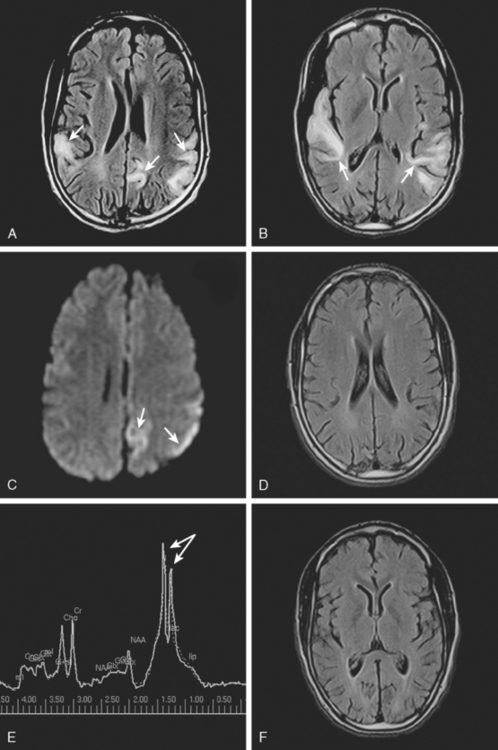
MELAS
REVERSIBLE CEREBRAL VASOCONSTRICTION
< div class='tao-gold-member'>
Related posts:
Stay updated, free articles. Join our Telegram channel

Full access? Get Clinical Tree


