The normal adult renal length, measured by ultrasound, is 9–12 cm. Renal length varies with age, being maximal in the young adult. There may be a difference between the two kidneys, normally of less than 1.5 cm. A kidney with a bifid collecting system is usually 1–2 cm larger than a kidney with a single pelvicaliceal system. Minor changes in size occur in many conditions (Tables 8.1 and 8.2).
Table 8.1 Conditions associated with small kidneys
| Diagnosis | Imaging | |
| Unilateral but may be bilateral | Chronic pyelonephritis | Focal scars and dilated calices |
| Tuberculosis | See Fig. 8.42 | |
| Obstructive atrophy | Dilatation of all calices with uniform loss of renal parenchyma | |
| Renal artery stenosis or occlusion | Outline may be smooth or scarred, but the calices appear normal | |
| Hypoplasia | Very rare; kidneys may be smooth or irregular in outline with fewer calices. Calices may be clubbed | |
| Always bilateral | Radiation nephritis Chronic glomerulonephritis of many types Hypertensive nephropathy Diabetes mellitus Collagen vascular diseases | Small in size but no distinguishing features Usually no distinguishing features. In all these conditions the kidneys may be small with smooth outlines and normal pelvicaliceal system |
| Analgesic nephropathy | Calices often abnormal |
Table 8.2 Conditions associated with enlarged kidneys
| Diagnosis | Imaging | |
| Always unilateral | Compensatory hypertrophy | Opposite kidney small or absent |
| May be unilateral or bilateral | Bifid collecting system | Diagnosis obvious from abnormalities of collecting systems |
| Renal mass | Mass is seen | |
| Hydronephrosis | Visible distension of the renal collecting systems | |
| Lymphomatous infiltration | May show obvious masses; the kidneys may, however, be large but otherwise unremarkable | |
| Always bilateral | Renal vein thrombosis Polycystic disease | No Doppler signal is visible in the renal vein and thrombus may be evident Characteristic imaging appearance (see Fig. 8.52) |
| Acute glomerulonephritis | Non-specific enlargement | |
| Amyloidosis | Non-specific enlargement (rare) |
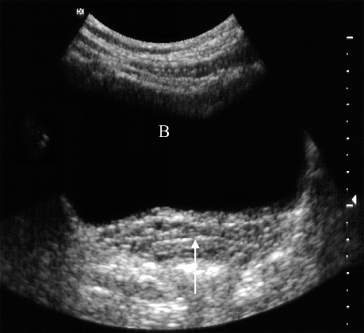
Normal ureters are not usually visualized due to overlying bowel gas. The urinary bladder should be examined in the distended state: the walls should be sharply defined and barely perceptible (Fig. 8.2). The bladder may also be assessed following micturition, to measure the postmicturition residual volume of urine.
Fig. 8.2 Normal ultrasound of the full bladder (B). Note the smooth thin bladder wall. The vagina lies posteriorly (arrow).
Urography
Urography is the term used to describe the imaging of the renal tract using intravenous iodinated contrast medium. The traditional intravenous urogram has largely been replaced by a combination of ultrasound and CT urography. CT has the advantage of being highly sensitive for the detection of stones, including those that may be radiolucent on plain film, allows the characterization of renal lesions and the detection of ureteric lesions, and demonstrates the surrounding retroperitoneal and abdominal tissues. In addition, CT overcomes the overlap of superimposed tissues, which can cause difficulty when interpreting traditional IVU.
The principles of both techniques are similar. Firstly, ‘non-contrast’ imaging of the renal tract is required, in order to identify all renal tract calcifications. In some cases, where the clinical question relates to renal calculi, the non-contrast CT may be sufficient (known as the ‘CT KUB’). However, where a renal mass is suspected or a possible ureteric or bladder mass is suspected, the non-contrast study is followed by the injection of iodinated contrast medium. Images are obtained at specific time intervals in order to demonstrate the nephrogram (contrast within the kidneys) and the urogram (contrast within the ureters and bladder). CT IVU may be reformatted in the coronal plane in order to have a similar appearance to traditional IVU. The main indications for urography are listed in Box 8.1.
- When detailed demonstration of the pelvicaliceal system and ureters are required
- In suspected ureteric injury, e.g. following pelvic surgery or trauma
- Assessment of acute ureteric colic
- Investigation of renal calculi
- Investigation of haematuria
- Characterization of a renal mass
- Staging and follow-up of renal carcinoma
- To delineate renal vascular anatomy (e.g. suspected renal artery stenosis or prior to live related kidney donation)
- To diagnose or exclude renal trauma
Contrast Medium and Its Excretion
Urographic contrast media are highly concentrated solutions of organically bound iodine. A large volume (e.g. 100 mL) is injected intravenously and is carried in the blood to the kidneys, where it passes into the glomerular filtrate. The contrast medium within the glomerular filtrate is concentrated in the renal tubules and then passes into the pelvicaliceal systems.
Adverse reactions to intravenous contrast media are discussed in Chapter 1.
Patients are allowed to drink up to 500 mL of fluid in the 4 hours before IVU or CT but should not eat. It is particularly important not to fluid-restrict patients with impaired renal function before they are given contrast medium as this may predispose to contrast medium-induced nephrotoxicity.
Plain Film Intravenous Urogram
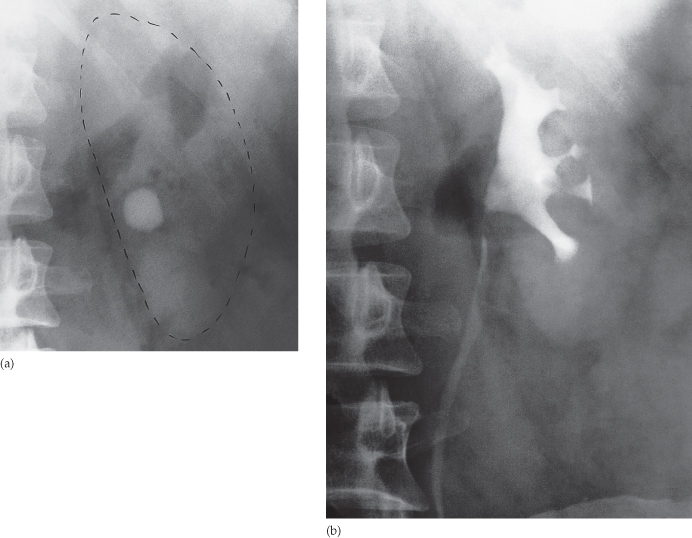
Identify all calcifications. Decide if they are in the kidneys by relating them to the renal outlines during inspiration and expiration or oblique views or tomograms where necessary. Calcifications seen in the line of the ureters or bladder must be reviewed with post contrast scans, to determine whether the calcification lies in the renal tract. Note that calcification can be obscured by contrast medium and stones are missed if no plain film is taken (Fig. 8.3). The major causes of urinary tract calcification include calculi, diffuse nephrocalcinosis, localized nephrocalcinosis (e.g. tuberculosis or tumours) and prostatic calcification.
Fig. 8.3 (a) A rounded calcification is seen overlying the left kidney in the anteroposterior plain film. (b) Post contrast film in the same patient. As the contrast medium and the calculus have the same radiographic density, the calculus is hidden by the contrast medium.
Look at the other structures on the film. Include a review of the bones and other soft tissues, just as you would on any plain abdominal film.
Films Taken after Injection of Contrast Medium
Kidneys
- Local indentations (Fig. 8.5). The renal parenchymal width should be uniform and symmetrical, between 2 and 2.5 cm. Minor indentations between normal calices are due to persistent fetal lobulations. All other local indentations are scars.
- Local bulges of the renal outline. A bulge of the renal outline may be due to a mass or a cyst, which often displaces and deforms the adjacent calices. An important normal variant causing a bulge of the outline is the so-called ‘splenic hump’ (Fig. 8.6).
Fig. 8.4 Normal IVU, full-length 15-minute film. Note that the bladder is well opacified. The whole of the right ureter and part of the left ureter are seen. Often, only a portion of the ureter is visualized owing to peristalsis emptying certain sections. The bladder outline is reasonably smooth. The roof of the bladder shows a shallow indentation from the uterus.
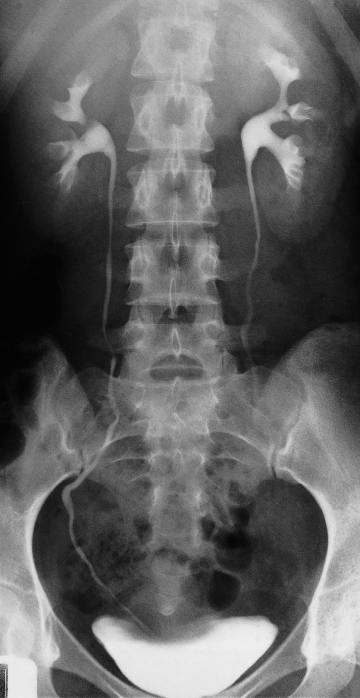
Fig. 8.5 (a) The distinction between fetal lobulation and renal infarction. With fetal lobulation, indentations in the renal outline are shallow and correspond to the lobules of the kidney, i.e. the indentations are between calices. With renal infarction, the maximal indentation is opposite a calix and there is usually extensive loss of renal parenchyma. (b) Scars in chronic pyelonephritis (drawing of Fig. 8.7b). The reductions in renal parenchymal width are opposite calices, and these calices are dilated. The overall kidney size is reduced, as is usual. Scars in tuberculosis have much the same appearance but are usually associated with other signs of tuberculosis.
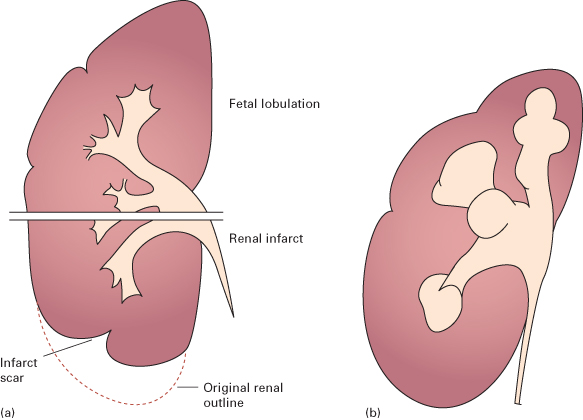
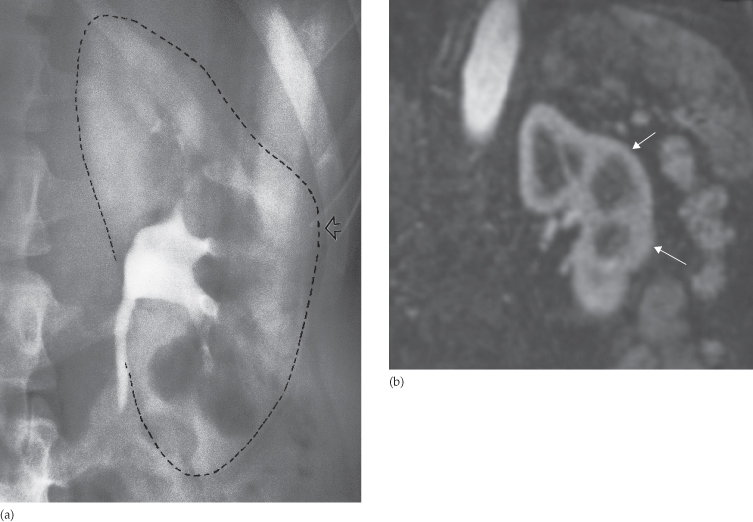
Fig. 8.6 The ‘splenic hump’. (a) A bulge is present on the lateral aspect of the left kidney (arrow) but there is no displacement of the calices. This splenic hump is a normal variant. (b) Coronal MRI (with gadolinium) of a left splenic hump (arrows), in which normal corticomedullary anatomy is demonstrated.
Calices
The calices should be evenly distributed and reasonably symmetrical. The shape of a normal calix is ‘cupped’ and when it is dilated it is described as ‘clubbed’ (Fig. 8.7). The normal ‘cup’ is due to the indentation of the papilla into the calix. Caliceal dilatation has two basic causes: destruction of the papilla or obstruction (Box 8.2).
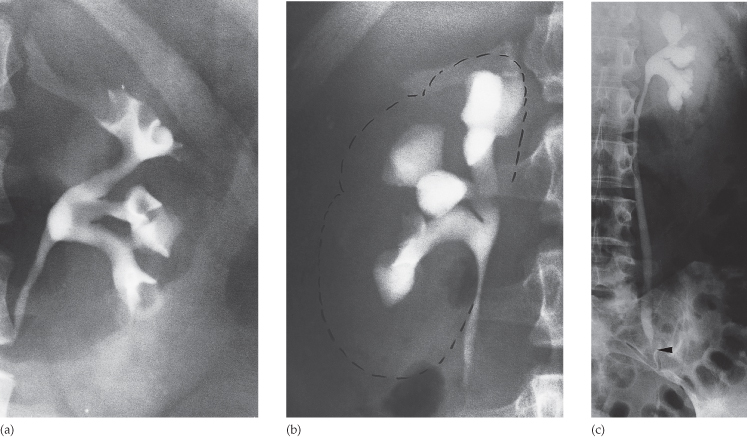
Fig. 8.7 Calices. (a) Normal calices. Each calix is cup-shaped. (b) Many of the calices are clubbed. There is scarring of the parenchyma of the upper half of the kidney indicating that the diagnosis is chronic pyelonephritis. (c) All the calices are dilated, the dilatation of the collecting system extending down to the point of obstruction (arrow), in this case owing to a malignant retroperitoneal lymph node.
- Calculus
- Blood clot
- Sloughed papilla
- Intrinsic pelviureteric junction obstruction
- Transitional cell tumour
- Infective stricture (e.g. tuberculosis or schistosomiasis)
- Retroperitoneal fibrosis
- Pelvic tumour, e.g. cervical, ovarian or rectal carcinoma
- Aberrant renal artery or retrocaval ureter
- Reflux nephropathy
- Papillary necrosis
- Tuberculosis
Renal Pelvis and Ureters
The normal renal pelvis and pelviureteric junction are funnel shaped. The ureters are usually seen in only part of their length on any one film of IVU because of obliteration of the lumen by peristalsis. Dilatation of the renal pelvis and ureter may be secondary to obstruction but there are other causes (e.g. congenital variant or secondary to vesicoureteric reflux). Filling defects within the pelvis and ureters should be identified. The three common causes are tumours, calculi or blood clots. Congenital variations of the renal collecting system are relatively common (see Fig. 8.49).
Bladder
The bladder is a centrally located structure that should have a smooth outline. It often shows normal smooth indentations from above owing to the uterus or the sigmoid colon, and from below by muscles of the pelvic floor (see Fig. 8.4). After micturition the bladder should be empty, apart from a little contrast trapped in the folded mucosa.
Computed Tomography Urography
The technique varies depending on the indication. In almost all cases, CT is initially performed without intravenous contrast medium (non-contrast CT or ‘CT KUB’) to identify calcification (Figs 8.8 and 8.9). Images are then obtained following the administration of a rapid bolus of intravenous contrast medium. The time at which images are obtained following contrast administration depends on the indication and include: (i) the early renal cortical enhancement phase; (ii) the homogeneous nephrogram phase; and (iii) the delayed urographic phase, obtained several minutes later to demonstrate contrast within the collecting systems. With the multidetector CT (MDCT) systems, images may be reformatted in the coronal or sagittal plane for surgical planning (Fig. 8.10).
Fig. 8.8 Normal CT of kidneys and bladder, with (a–c) showing the same level through the renal hilum. (a) Before the intravenous contrast has been given. Note the calcification in the wall of the aorta (arrow). A, aorta; I, inferior vena cava; K, kidney; Sp, spine. (b) Forty seconds after intravenous contrast infusion, demonstrating the corticomedullary phase, with marked enhancement of the renal cortex. (c) Ten minutes following the contrast infusion, demonstrating homogeneous opacification of the parenchyma and dense opacification of the pelvicaliceal system (arrows). (d) Section through the pelvis showing the ureters (arrows) ten minutes after contrast has been given.
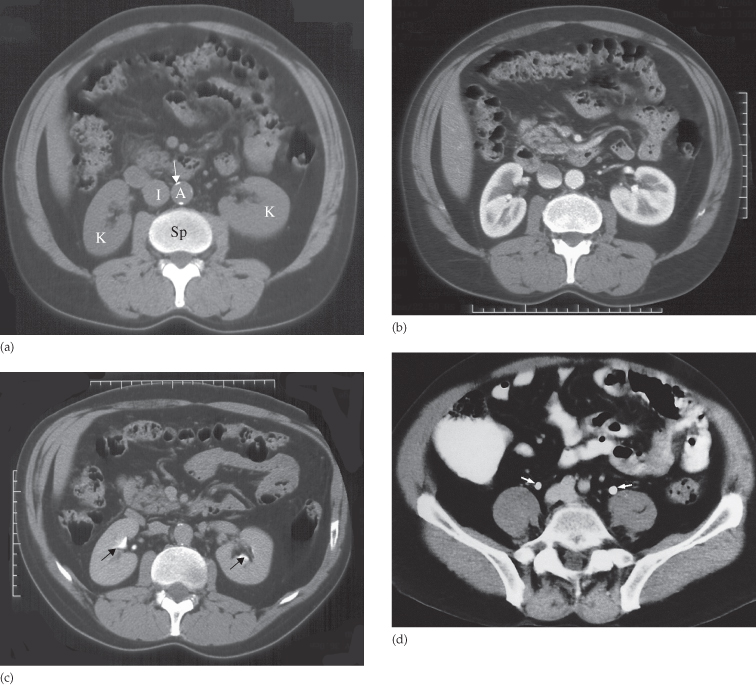
Fig. 8.9 (a) CT section through an opacified bladder in a male patient showing that the bladder wall is too thin to be seen. Note the layering of contrast medium. (b) Section through a bladder without contrast opacification. The bladder wall can be identified as a thin line.
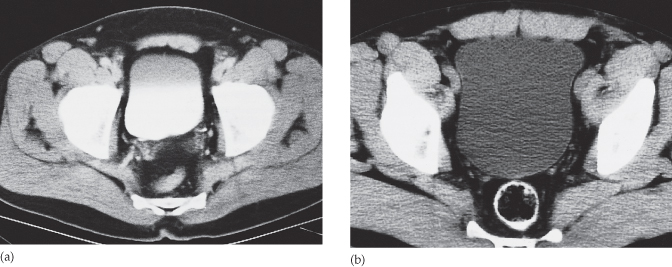
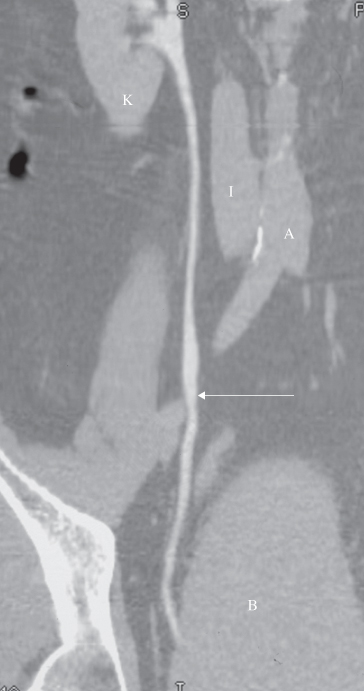
Fig. 8.10 CT reformat. This is the same patient as in Fig. 8.8a–c. The ureter (arrow) has been reformatted in the coronal plane. A, aorta; B, bladder; I, inferior vena cava; K, kidney.
A ‘split bolus’ technique may be used in order to reduce the radiation dose to the patient: following the non-contrast scan, a portion of the intravenous contrast dose is injected and the patient waits approximately 10 minutes, allowing the contrast to enter the ureters. Then, the patient is repositioned on the scanner and the remainder of the contrast medium is given as a rapid bolus with the scan obtained at the corticomedullary or nephrographic phase. This technique provides diagnostic images of both the kidneys and the ureters, whilst reducing the radiation to the patient.
Non-Contrast ‘CT KUB’
The position, size and Hounsfield unit of any renal calculi should be recorded. The line of the ureters is then followed down to the bladder in order to identify any ureteric stones. Viewing coronal and sagittal thin section reformatted images increases the ability to detect very small stones (see Fig. 8.22). Occasionally, it may be difficult to differentiate a small calcified phlebolith from a non-obstructing ureteric stone, particularly if the ureter is not distended above the stone. In this case, correlation with post contrast CT IVU may be necessary. The appearance of the other organs and the bones should be assessed. In cases of suspected acute renal colic, alternative causes of pain should be sought, such as appendicitis.
Computed Tomography after Injection of Contrast Medium
Corticomedullary phase. At approximately 35–40 seconds following the start of the contrast injection, the only parts of the renal tract that have enhanced are the renal arteries and renal cortex. Thus, there is a marked difference in the attenuation of the cortex and the medulla (see Fig. 8.8b). There is no contrast medium in the collecting system, which therefore has a low attenuation. This early stage of enhancement is particularly useful for evaluation of the renal arteries, which may be reformatted as a CT angiogram, as well as for the evaluation of highly vascular renal tumours.
Nephrographic phase. This occurs at approximately 90 seconds and demonstrates uniform opacification of the renal parenchyma. There is homogeneous opacification of the cortex and the medulla, the ‘homogeneous nephrogram’ phase, and some contrast medium is seen in the renal pelves. There is usually a clearly visible difference in the density of normal renal tissue and a tumour.
Urographic phase. Obtained at approximately 10–15 minutes after contrast injection, during this phase the pelvicaliceal system, ureters and bladder should contain contrast. The pelvicaliceal system should show cupped calices with a uniform width of renal parenchyma from calix to renal edge, and the renal sinus fat that surrounds the pelvicaliceal system should be clearly visualized. The ureters are seen in cross-section as dots lying on the psoas muscles (see Fig. 8.8d). They will not necessarily be seen at all levels because peristalsis obliterates the lumen intermittently. The bladder has a smooth outline and stands out against the pelvic fat; its wall is thin and of reasonably uniform diameter. Contrast medium opacification of the urine in the bladder is variable depending on how much contrast medium has reached the bladder. The contrast medium is heavier than urine and, therefore, the dependent portion is usually more densely opacified (see Fig. 8.9). Curved reformats of the ureters may be used to display the urographic phase (see Fig. 8.10).
Magnetic Resonance Imaging
Magnetic resonance imaging gives similar anatomical information to CT, with the advantage of being able to obtain scans directly in multiple planes. It is generally used in selected circumstances, e.g. to demonstrate renal artery stenosis or inferior vena caval extension of renal tumours, or to clarify problems not solved by ultrasound or CT. It is also used to assess the extent of bladder or prostate cancer prior to consideration for surgery. Calcification is not visible on MRI, which is one of the main disadvantages of the technique for renal tract imaging.
Normal Magnetic Resonance Imaging
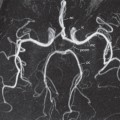
As with CT and ultrasound, the renal contours should be smooth. Corticomedullary differentiation is best seen on T1-weighted images and immediately following intravenous contrast enhancement with gadolinium (Fig. 8.11). The renal collecting systems, ureters and bladder are best seen on T2-weighted images, as the fluid returns a high signal intensity (Fig. 8.12). A heavily T2-weighted image may be used to acquire an magnetic resonance urogram. Some normal variants are well demonstrated on MRI: fetal lobulation is seen as an undulating renal contour but with uniform cortical thickness on coronal images (see Fig. 8.6b); a column of Bertin (which is normal renal parenchyma that may look mass-like) may be distinguished from a mass, as it has the same signal characteristics as the rest of the kidney on all sequences. The renal vasculature is best demonstrated following intravenous gadolinium and may be displayed in three dimensions (Fig. 8.13).
Fig. 8.11 MRI of the kidneys. (a) T1-weighted and (b) T2-weighted images in the axial plane at the level of the renal hila. Note the simple cyst (C) in the left kidney, which returns a low signal on T1- and a high signal on T2-weighted images. (c) Coronal image of the kidneys, in a different patient, following intravenous gadolinium infusion. (d) Normal bladder (B) on a T2-weighted image. The bladder wall is thin and smooth. A, aorta; Cx, cervix; I, inferior vena cava; K, kidney; L, liver; R, rectum; RV, renal vein; Spl, spleen.
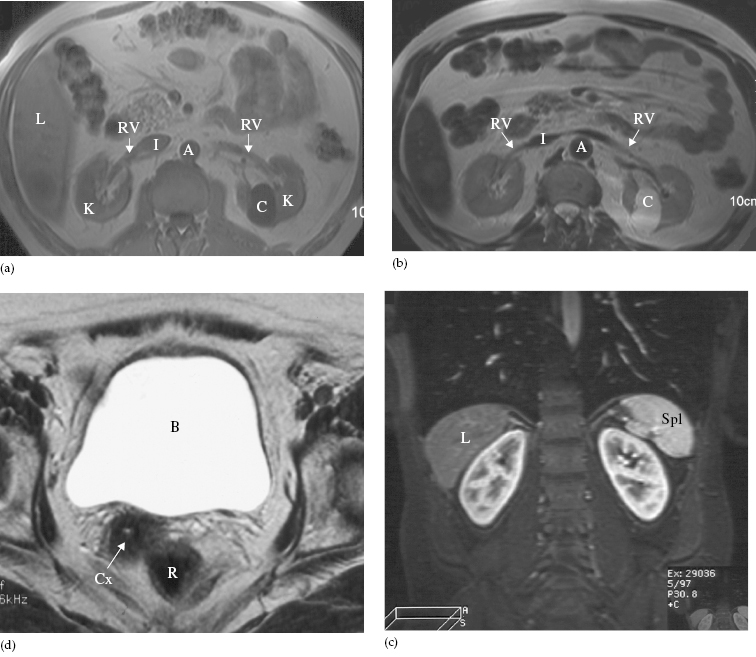
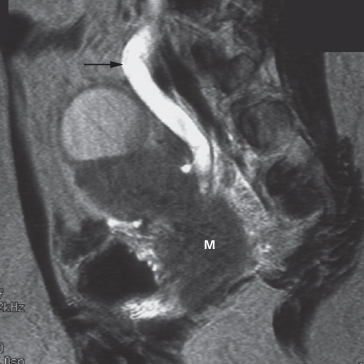
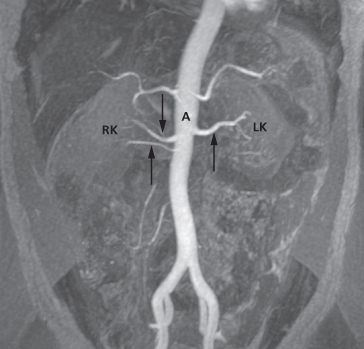
Fig. 8.13 Magnetic resonance angiogram of normal renal arteries, displayed coronally (arrows). There are two renal arteries supplying the right kidney (RK) and one supplying the left kidney (LK). A, aorta.
Radionuclide Examination
Radionuclide techniques for studying the kidneys include:
- The renogram, which measures renal function.
- Scans of renal morphology (dimercaptosuccinic acid (DMSA) scan), although the advent of CT and ultrasound has reduced the need for such scans. They are now used mainly for evaluating renal scarring (see Fig. 8.43).
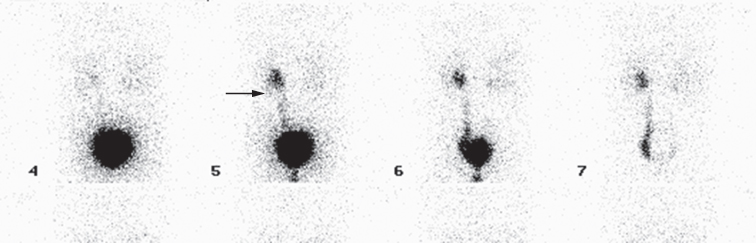
- The presence of reflux in children may be diagnosed using the technique of indirect voiding cystography. A radionuclide tracer is infused into the bladder via a catheter. The child then voids whilst being imaged by the gamma camera. The presence of reflux can be detected if tracer activity is seen to rise up into one or both of the ureters at the time of micturition (Fig. 8.14).
Fig. 8.14 Indirect voiding cystogram (posterior view) with tracer instilled into the bladder. Voiding is recorded on the gamma camera, starting at image 5. There is immediate reflux into the left ureter (arrow). The bladder is virtually empty on the final image, 7.
Renogram
If substances that pass into the urine are labelled with a radionuclide and injected intravenously, their passage through the kidney can be observed with a gamma camera (Fig. 8.15). The two agents of choice are technetium-99m (99mTc) diethylene triamine pentacetic acid (DTPA) and 99mTc mercaptoacetyl triglycine (MAG-3). DTPA is filtered by the glomeruli and is not absorbed or secreted by the tubules, whereas MAG-3 is both filtered by the glomeruli and secreted by the tubules.
Fig. 8.15 99mTc DTPA renogram, serial images. (a) Vascular phase. (b) Filtration phase. (c) Excretion phase. (d) The renogram curve.
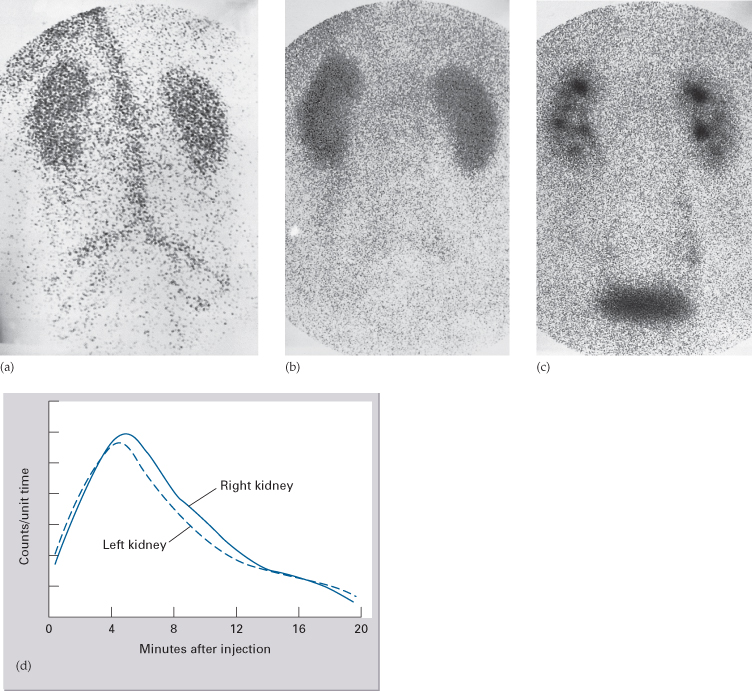
The gamma camera is positioned posteriorly over the kidneys and a rapid injection of the radiopharmaceutical is given. Early images show the major blood vessels and both kidneys. Activity is then seen in the renal parenchyma and by 5 minutes the collecting systems should be visible. Serial images over 20 minutes show progressive excretion and clearance of activity from the kidneys. Computerized quantitative assessment enables a renogram curve to be produced and the relative function of each kidney to be calculated.
The main indications for a renogram are:
- Measurement of relative renal function in each kidney – this may help the surgeon decide between nephrectomy and more conservative surgery.
- Investigation of urinary tract obstruction, particularly pelviureteric junction obstruction.
- Investigation of renal transplants.
Special Techniques
Retrograde and Antegrade Pyelography
The techniques of retrograde and antegrade pyelography (the term pyelography means demonstrating the pelvicaliceal system and ureters) involve direct injection of contrast material into the pelvicaliceal system or ureters through catheters placed via cystoscopy (retrograde pyelography) or percutaneously into the kidney via the loin (antegrade pyelography). The indications are limited to those situations where the information cannot be achieved by less invasive means, e.g. IVU, CT or MRI to confirm a possible transitional cell carcinoma in the renal pelvis or ureter.
Voiding Cystourethrogram (Micturating Cystogram) and Videourodynamics
In voiding cystourethrography, the bladder is filled with iodinated contrast medium through a catheter and films are taken during voiding. The entire process is observed fluoroscopically to identify vesicoureteric reflux. The bladder and urethra can be assessed during voiding to demonstrate strictures or urethral valves (see Fig. 8.62).
Videourodynamic examination combines voiding cystourethrography with bladder pressure measurements, which necessitate bladder and rectal pressure lines. It is useful in the investigation of incontinence to distinguish detrusor instability from sphincter weakness (stress incontinence). The test is also helpful in patients with obstructive symptoms, mainly elderly men, to differentiate true obstruction from bladder instability, and in patients with a neurogenic bladder.
Urethrography
The urethra is visualized during voiding cystourethrography. For full visualization of the male urethra, however, an ascending urethrogram with contrast medium injection via the external urethral meatus is necessary (see Fig. 8.61). The usual indications for the examination are the identification of urethral strictures and to demonstrate extravasation from the urethra or bladder neck following trauma.
Renal Arteriography
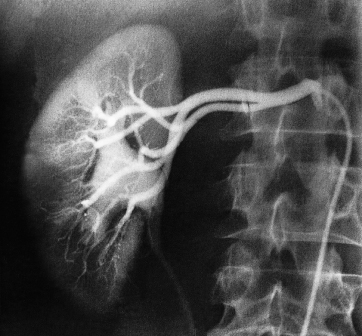
Renal arteriography is performed via a catheter introduced into the femoral artery by the Seldinger technique (see Chapter 17). Selective injections are made into one or both renal arteries (Fig. 8.16). It is mainly used to confirm the CT or MRI findings of vascular anatomy prior to renal surgery and to confirm renal artery stenosis prior to percutaneous balloon angioplasty.
Fig. 8.16 Normal selective right renal arteriogram. Note that not only are the arteries well shown but there is also an excellent nephrogram. The renal pelvis and ureter are opacified because of a previous injection of contrast.
Urinary Tract Disorders
Urinary Calculi
Urinary calculi may be asymptomatic. The imaging of calculi causing urinary obstruction is described below.
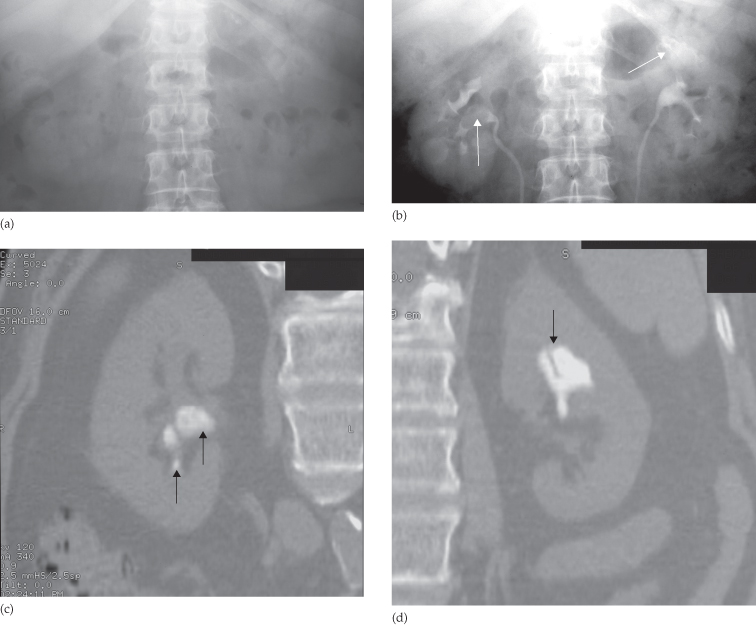
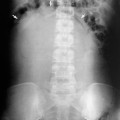
Most urinary calculi are calcified and show varying density on x-ray examinations. Many are uniformly calcified but some, particularly bladder stones, may be laminated. Only pure uric acid and xanthine stones are radiolucent on plain radiography, but they can be identified at CT or ultrasound (Fig. 8.17).
Fig. 8.17 (a) IVU control film. Renal stones are not visible on the right and are very poorly visualized on the left. (b) IVU following intravenous contrast. Filling defects are seen in the right lower calix and pelvis and in the left upper pole calices (arrows). (c, d) CT of the kidneys in the same patient with no contrast medium, reformatted in the coronal plane, demonstrating the renal stones in both the right (c) and left (d) kidneys (arrows).
Small renal calculi are often round or oval; the larger ones frequently assume the shape of the pelvicaliceal system and are known as staghorn calculi (Fig. 8.18).
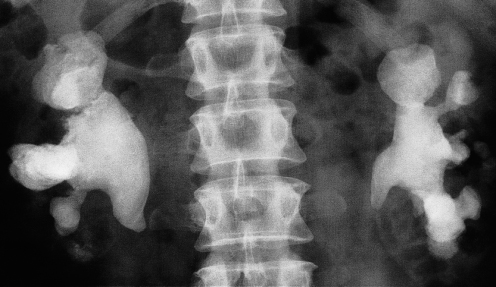
Plain film examination of the urinary tract is more sensitive than ultrasound for detecting opaque renal and ureteric calculi. It is essential to examine the preliminary film of an IVU carefully, because even large calculi can be completely hidden within the opacified collecting system once contrast medium has been given (see Fig. 8.3). Stones in the ureters may be partly obscured where they overlie the vertebral transverse processes or the sacrum.
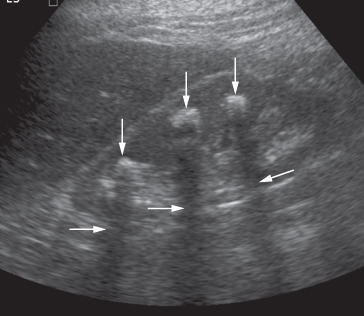
Most renal calculi of more than 5 mm in size are readily seen at ultrasound, but smaller calculi may be missed, particularly if they are located within the renal sinus, where they may be obscured by echoes from the surrounding fat. Stones, regardless of their composition, produce intense echoes and cast acoustic shadows (Fig. 8.19). Staghorn calculi, filling the caliceal system, cast very large acoustic shadows, which may even mask an associated hydronephrosis. Stones in the ureters cannot be excluded on ultrasound, although stones lodged at the vesicouteric junction may be demonstrated (Fig. 8.20). Stones in the bladder, or in bladder diverticula, are well demonstrated on ultrasound.
Fig. 8.19 Ultrasound of stones in the right kidney. The stones (vertical arrows) appear as bright echoes. Note the acoustic shadows behind the stones (horizontal arrows).
Related posts:
Stay updated, free articles. Join our Telegram channel

Full access? Get Clinical Tree


