, Leonid Tiutin2 and Thomas Schwarz3
(1)
Russian Research Center for Radiology and Surgery, St. Petersburg, Russia
(2)
Department of Radiology and Nuclear Medicine, Russian Research Center for Radiology, St. Petersburg, Russia
(3)
Department of Nuclear Medicine Division of Radiology, Medical University Graz, Graz, Austria
Abstract
PET is the most efficient method of noninvasive radiologic study of major biochemical processes and physiological functions of the central nervous system. PET provides valuable information on the state of glucose, amino acid and fatty acid metabolism, cerebral blood flow, penetrability of the hematoencephalic barrier, activity of different enzymes, neurotransmitter synthesis and metabolism, recep tor density and gene expression, etc. Changes in these systems may be due to age-specific characteristics, mental, neurodegenerative and cerebrovascular diseases as well as craniocerebral injury. Additionally, PET is rather widely used for studying the pharmacokinetics and pharmacodynamics of drugs applied in modern psychiatric and neurological clinical practice. PET data play an important role in solving many problems of fundamental neurobiology and neurophysiology as well as in further improving the pharmacological and surgical therapy of psychoneurological diseases.
PET is the most efficient method of noninvasive radiologic study of major biochemical processes and physiological functions of the central nervous system. PET provides valuable information on the state of glucose, amino acid and fatty acid metabolism, cerebral blood flow, penetrability of the hematoencephalic barrier, activity of different enzymes, neurotransmitter synthesis and metabolism, receptor density and gene expression, etc. Changes in these systems may be due to age-specific characteristics, mental, neurodegenerative and cerebrovascular diseases as well as craniocerebral injury. Additionally, PET is rather widely used for studying the pharmacokinetics and pharmacodynamics of drugs applied in modern psychiatric and neurological clinical practice. PET data play an important role in solving many problems of fundamental neurobiology and neurophysiology as well as in further improving the pharmacological and surgical therapy of psychoneurological diseases.
The brain is actively supplied with blood and has an intensive energy metabolism. Even though the brain makes up only 2% of the body weight, in the normal state of the organism it consumes about 20% of absorbed oxygen and 60% of glucose, which is completely oxidized to form CO2 and H2O in the citrate cycle and by way of glycolysis (Fig. 21.1). Virtually the only source of energy in brain cells is glucose, which therefore should permanently arrive. Suffice it to say that more than 95% of adenosine triphosphoric acid (ATP) in neurons is formed by the phosphorylation reaction from a glucose molecule. Only in the case of long starvation do cells begin to use an additional energy source, ketone bodies. Glycogen deposits in brain cells are small. Fatty acids, which are transported in blood plasma in the form of albumin-fatty acid complex, do not reach brain cells because of the blood–brain barrier. Nor can amino acids be a source of energy for the ATP synthesis since there is no gluconeogenesis in neurons. The most energy-intensive process in the cells of the central nervous system is the functioning of transport Na+/K+-ATPase (Na+/K+ pump) of cell membranes. The active transport of the Na+ and K+ ions compensates for the constant ion flow through ion channels. Also, ATP is used in many biosynthetic reactions.
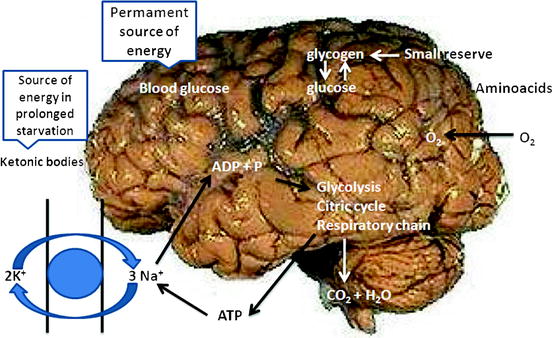
Fig. 21.1
Energy metabolism of the brain
In this context, 118F-FDG is the optimum radiopharmaceutical (RP) for assessing the functional state of the cortex, since it reflects the level of glucose consumption by brain cells (first of all by neurons).
21.1 Some Aspects of PET Image Analysis
Visual analysis is also used in a number of studies However, more often visual interpretation is supplemented with semiquantitative and quantitative data processing (Medvedev 2008). More accurate information, compared with visual assessment, sufficient for clinical and most scientific studies can be obtained by means of semiquantitative analysis. There are several kinds of data processing with use of semiquantitative image analysis. The simplest kind is determining regional radioactivity normalized to an internal zone of reference. The contralateral area or brain activity on the whole may serve as reference. For semiquantitative analysis, the SUV (standardized uptake value) can be also used. However, in some studies it has been shown that the method of calculating SUV is imperfect and in some cases it introduces up to 50% error in assessing brain metabolism (Cremerius 1997).
The so-called spatial normalization is an important aspect of PET image processing. Normalization aims at leveling all the particular anatomic characteristics of the patient’s brain by reducing its parameters (e.g., form, size, spatial situation during data collection) to a certain standard (Senda 2000; Gispert 2003). There are two different approaches to image standardization. First of all, the patient’s scanograms can be transformed by achieving a precise coincidence of the points of reference (internal markers which are brain contours or sulci) in the obtained PET tomograms or standard MRI data available in the data base (anatomic normalization). For that purpose a computer brain atlas is used; for example, HBA (Human Brain Atlas) developed by the Department of Neuroscience of Karolinska Institute, Sweden (Hikima et al. 2004).
Another variant is reducing to standard RP distribution in the patient’s brain; for example, when studying regional glucose metabolism or cerebral blood flow (functional normalization). Currently the SPM software (Statistical Parametric Mapping, Welcome Department of Cognitive Neurology, Institute of Neurology, London, UK) and NEUROSTAT based on 3D SSP (Department of Internal Medicine, University of Michigan, Ann Arbor, MI, USA) improved by Prof. S. Minoshima (University of Washington, Seattle, WA, USA) are used (Minoshima et al. 1995; Gispert 2003; Hikima et al. 2004; Hosaka 2005). It should be noted that this division of standardization methods concerns not only the main principles that underlie them. This does not mean that some elements of anatomical normalization cannot be used in the second group of methods. For example, in NEUROSTAT the method of marker coincidence is used, bicomissural lines serving as markers. Furthermore, in SPM, parameters of PET image deformation can be set by means of MRI scans obtained in the same patient.
In image standardization by means of internal markers such as brain contours or sulci (fissure of Sylvius, central and cingulate gyri, etc.) with use of a computer atlas (e.g., HBA), corresponding image pixels and their averaging are compared. This process is performed in most software packages under the control of an operator. Therefore, this method of image standardization may be useful in the presence of marked anatomic peculiarities of the patient’s brain (Hosaka 2005). In the case when RP uptake is used for standardization, the idea on the real situation of the brain structures is largely conventional. For example, the precentral sulcus of a patient may functionally correspond to the same area of another one, even in the absence of anatomic correspondence. In other words, functional brain normalization between subjects by means of the second method group is objective and reliable but precise anatomic coincidence of corresponding structures cannot be quite guaranteed. In spite of that, there are data confirming in most cases the accuracy of comparing anatomic and functional data after image standardization based on the normalization of RP distribution in the brain (Ishii 2001).
The statistical parametric mapping (SPM) was developed in 1988 and presently is the widest spread method of image standardization. Its creation was conditioned first of all by the rapid development of the methods of functional visualization, especially PET. The main method of finding differences between PET data of patients and those of a control group was then comparison of RP uptake in the regions of interest, which were outlined manually (Friston et al. 1991). For this reason, information on functional activity in pixels and voxels situated outside the chosen region of interest was in fact lost. Then these data were processed with the help of multifactor dispersion analysis. The region of interest was used as the level (degree of impact) of factor. This means that the impact on the region of interest of a given diagnosis or therapy was reflected in the region of interest itself and had a non-additive character. In other words, the effect of therapeutic measures was not allowed for in assessing metabolic and perfusion changes in the region of interest. Meanwhile, treatment is known to have a general impact on functional processes, which shows up in many regions of interest in the brain. This is why in the late 1980s a group of researchers decided to create a way of data processing that permitted the detection of changes on the basis of parametric maps in the absence of information on the precise localization of the pathologic process. This technique was called statistical parametric mapping (SPM) and that was for several reasons. First of all, it completely corresponds to the acronym designating mapping of statistically significant probabilities, the method of processing EEG results (where “SPM” stands for “significant probability mapping”). This technique permits the creation of pseudomaps of P-magnitudes for determining the spatial-temporal organization of the evoked electric response, which makes easier the visual assessment of obtained EEG data. Further, SPM makes it possible to identify and localize differences in EEG images between patient groups and healthy people (Senda 2000). The second reason for this name is related to the history of development of PET. In the 1970s to 1980s, tomograms were obtained out of raw data which reflected a large number of different physiologic processes (oxygen metabolism, oxygen extraction fraction, regional cerebral blood flow). These images were called parametric maps. In fact, these physiologic parameters were a non-linear function of initial data (Huang et al. 1983). A distinction of SPM from these maps consists of the fact that in SPM, distribution is determined on the basis of a null hypothesis (Senda 2000). This means that SPM is based on a statistical data model which permits determination of error and significance of the detected changes (Moustafa and Baron 2008). Thus, SPM converts changes in images into statistical indices. The choice of statistical methods of processing depends on the task set by the researcher. First of all, he should decide on whether to use a T-test, for comparing the averages, or an F-test, to confront the dispersions of the two general sets.
The methodology of SPM was presented in detail in several reports published in the early 1990s (Friston et al. 1990, 1991, 1993). In the first stage, images are reoriented by way of comparing corresponding scan voxels in order to level artifacts induced by movements of the head. The normal brain of adults is known to have roughly the same sizes and form. However, some individual characteristics are always observed in the form of the topographic situation of the gyri and sulci in the cortical sections or, for example, differences in the shape of the corpus callosum. Therefore, the second stage of preparing images is their spatial normalization. One of the advantages of SPM is the possibility to create by means of software algorithms standard patterns which can be obtained out of scans of the control group and then be used together with available patterns for spatial normalization (Senda 2000; Herholz 2003). Each 3D brain image is transformed so that all the superficial structures precisely coincide with analogous regions of the pattern included in the program. This process (the so-called affine transformation) includes turning, parallel transfer, scale change and non-linear image deformation. Then, scan smoothing is done with consequent voxel averaging relative to the neighboring elements of the 3D image, which permits to increase the ratio of signal/noise. For this purpose, a Gauss filter or (rarer) wavelet image is used (Silverman 1999; Frackowiak 2003).
SPM presupposes characteristics by voxels of data variability with the introduction of compounded factor (global activity) and residual dispersion determination (Frackowiak 2003). For this purpose the general linear model is used, which can be considered as an extension of linear multiple regression for the case of one dependent variable. So the important advantage of SPM is the possibility to take into account the global brain activity in covariational analysis in order to detect specific changes in the region of interest (Stern 1992).
The last SPM version (SPM 8) allows not only the statistic processing of positron emission tomograms but also the analysis of images obtained by means of other functional methods of examination (fMRI, EEG, EMG) as well as fusion of multimodal data.
In 1995, Minoshima and coworkers suggested a method of projecting functional activity of the cortex (regional glucose metabolism or blood flow) on the surface of the brain in the form of a 3D image (Minoshima et al. 1995). This method was based on the image standardization developed before at Michigan University and has been called SSP (stereotactic surface projection). This analysis was first used for the early diagnosis of Alzheimer’s disease. The advantage of this method consists of the possibility to level the discrepancy between RP uptake in the radial direction which remains after standardization in the 3D images. Due to a partial volume effect, the distribution of functional brain activity along the periphery of the cortex reflects the distribution of the gray matter to a greater degree than radioactivity per millimeter of gray matter (Minoshima et al. 1995, 1997; Cross 2000). Therefore, the use of surface projection permits the avoidance of a misestimation of gray matter distribution in the volume of the brain (Minoshima et al. 1995). This technique is based on the idea that the cortex is essentially a 2D plate of sheet structure, curved and convoluted in the 3D space. Therefore, information obtained in the radial profile is insignificant. However, this is right only as regards the cerebral gyri but not sulci. Consequently, the sulci should be unbent and smoothed with the help of software, which is possible only on the basis of MRI data because of insufficiently high spatial resolution of positron emission tomograms. It should be noted that SSP provokes a slightly bigger loss in spatial resolution than does SPM (Hosaka 2005).
Along with the above-described characteristics of 3D SSP, there are some differences in approach to image standardization in the main software packages. For example in NEUROSTAT, differences in size between the patient’s brain and the standard pattern designed in the database are leveled by way of linear scaling (zooming). Then, in order to adjust the shape of the brain to the stereotaxic Talairach and Tournoux atlases or to that of Monreal Neurological Institute, nonlinear image deformation along nerve fiber bundles is used. As was said above, the first stage of image standardization in SPM is determination of the optimum parameters of affine transformation (three parameters giving the turn, three giving the parallel transfer [these six parameters determine image movement], three parameters setting scaling and three setting the slope angle of coordinate axes to corresponding coordinate planes in transition from the initial rectangular coordinate system to the non-rectangular one).
Then nonlinear deformation of the shape of the patient’s brain is performed usually by way of linear combination of the basis function of the 3D discrete cosines transformation. The adjustment of images includes minimization of the square of difference between the image and the pattern (Frackowiak 2003).
Some studies have shown that in spite of differences in data standardization algorithms, the results of image processing by means of the these two main software packages prove to be comparable (Senda 2000; Frackowiak 2003). For example, the difference between them in determining the localization of a point of interest does not exceed 1.5 mm with PET solving capacity of 5–6 mm. However, 3D SSP is used more seldomly than SPM. At the same time, its popularity among researchers is gradually growing; for example, this software package, together with the base of volunteers’ images presented by Prof. S. Minoshima, are set in the workstations of some of modern PET/CT systems.
There are two kinds of statistical design for examining regional glucose metabolism with the use of intersubjective averaging by way of spatial data normalization. At the same time, it should be noted that for 18F-FDG usually the statistical significance of the influence of the factor affecting the object is studied. The first kind is used in order to determine specific changes in glucose metabolism in patients with different brain diseases. For that purpose the objects of examination are divided into groups (k(i)), images (Y) of every patient (i) are obtained and the presence or absence of significant differences in regional glucose metabolism between groups are determined:
 , where μ is the overall mean, δ is the difference of means, ε is the remainder term (the difference between the given function and the function that approximates it), H 0 is the null hypothesis.
The second kind is used for assessing the differences in glucose metabolism depending on the age. For this purpose, patients of different ages (x(i)) are examined, images (Y) of every patient (i) are obtained and it is determined whether there is significant correlation between the age and regional glucose metabolism:
 , where μ is the overall mean, δ is the difference of means, ε is the remainder term and H 0 is the null hypothesis (Senda 2000).
The quantitative analysis of images is based on biologically grounded mathematical models, which show the radioactivity uptake in the compartments. The latter may reflect both physiological interfaces (vascular space, hematoencephalic barrier and cytoplasm neuron membrane, and others) and biochemical processes (enzyme anabolism and catabolism, transport molecules, receptor proteins). These models should necessarily represent simplified but really existing biological systems or processes.
Initially the quantitative assessment of glucose utilization in the brain was done by the Kety-Schmidt method, developed in 1944, by way of consistent definition of the overall blood flow and difference in glucose content in the arteries and veins of the brain As is known, almost the whole of the glucose (>90%) in the CNS undergoes aerobic decomposition, therefore glucose and oxygen consumption is measured in parallel (Kety 1950, 1956; Kety and Schmidt 1948). The study of regional glucose utilization with 18F-FDG is based on the method described by Sokoloff (1977). Initially the method was developed for autoradiography with use of 14C-labeled 2-desoxyglucose. Later on, in 1979 Phelps and coworkers suggested measuring the level of glucose consumption in humans with the help of 18F-FDG (Phelps et al. 1979). In early works on regional glucose consumption, it was detected that the overall brain metabolism utilizes roughly 5.5 mg glucose/min/100 g. This rate may vary from 3.6 to 5.2 mg glucose/min/100 g in the white matter to 5.8–10.3 mg glucose/min/100 g in the gray matter. It is also accepted in the scientific literature to measure glucose consumption in mmmol/min/100 g. This allows stoichiometric comparison with concentration of other substances consumed by the brain (e.g., oxygen or ketone bodies). Grams may be converted to moles by means of division of glucose concentration rate in grams by the relative molecular mass of glucose. The absolute values of regional glucose metabolism rate in most of the brain structures remain stable for all age groups.
It should be noted that in spite of high accuracy of quantitative analysis in determining the functional activity of the brain structures, it has not received wide use in clinical practice because of the technical complexity of the procedure and difficult mathematical data processing. Initially the quantitative assessment of brain glucose consumption was performed by the Kety-Schmidt method suggested in 1944, by way of consistent definition of overall cerebral blood flow and difference in glucose content in cerebral arteries and veins (Kety and Schmidt 1948). As is known, almost all glucose in the CNS (>90%) undergoes aerobic decomposition, therefore oxygen consumption and glucose consumption change in parallel.
Cerebral blood flow is traditionally characterized by two indices: blood flow velocity per time unit (for example, mL/min) and tissue perfusion level, which is expressed as blood volume flowing through a certain amount of tissue per time unit (for example, mL/min/100 g). In the brain of a healthy person, blood flow is closely related to the metabolic activity of a given brain structure. This relation is realized by autoregulation mechanisms and is crucial for adequate blood supply of the brain.
The main quantitative parameters of assessing cerebral blood circulation are: cerebral blood flow (CBF), mL/min/100 g; blood volume circulating in cerebral vessels (cerebral blood volume, CBV) mL/100 g; fraction of oxygen extracted by the brain from arterial blood (oxygen excretion fraction, OEF), %; oxygen metabolism rate (OMR), mL/min/100 g and glucose metabolism rate (GMR), mL/min/100 g.
In the same vascular blood, flow rate and glucose consumption rate are virtually in linear relationship. Nevertheless, there can be some differences in ratio of perfusion and metabolism between different basins. For example, since most lateral sections of the neocortex are supplied with blood through the medial cerebral artery, the perfusion level in this area determined with help of H215O virtually corresponds to the level of regional brain metabolism measured in the convexital sections. On the other hand, the cerebellum, in spite of low glucose metabolism compared with the neocortex, is characterized by considerably higher perfusion rates.
H215O or 15O study of cerebral blood flow is widely used for assessing the activity of cerebral areas participating in neurophysiological processes. The short half-life period of the radionuclide 15O permits the analysis of changes in functional activity of brain structures in the same subject under different experimental conditions (Wieler et al. 1986). This makes it possible to study such states as rest/motion, wakefulness/different sleep phases, comfort/discomfort or pain, emotional calmness/induced grief as well as anxiety, sexual excitement, fear, irritation. This paradigm of studying brain function is used in a large number of studies aimed at specifying the role of brain structures in processes of thought and behavior, both normal and pathologic. Besides that, the influence of medicines on different sections of the cortex and basal nuclei is studied with the help of H215O.
21.2 Dopamine System
In order to study the dopaminergic system, an [18F] fluorinated analog of the dopamine precursor 3,4-dioxyphenylalanine – 18F-DOPA – is used.
DOPA transforms to dopamine with help of the enzyme aromatic amino acid decarboxylase (AAD). Analysis of 18F-DOPA distribution permits assessment of AAD-catalyzed dopamine synthesis in neurons. The level of 18F-DOPA uptake is determined by the following factors: penetration of the RP through the blood–brain barrier, decarboxylation to fluorodopamine and uptake in neuronal terminals. At the same time, this RP does not permit to differentiate whether the detected changes are due to a disturbance in dopamine production activity through terminals or to the general decrease in number of terminals (Volkow et al. 1996; Verhoeff 1999).
A number of models with different degrees of complexity have been suggested for the quantitative analysis of AAD activity by means of PET. Usually the three-compartment model is applied, which reflects the reversible competitive transfer of 18F-DOPA through the blood–brain barrier, its AAD-mediated decarboxylation and uptake, release of fluorodopamine from vesicles, its metabolism and excretion from tissues.
The formation of metabolites beyond the CNS (for example, 3-O-methyl-[18F] fluoro-l-DOPA) is also allowed for in mathematical models.
21.2.1 Study of the Activity of Presynaptic Transmitters
Transmitters ensure reverse uptake of dopamine by the terminals of neurons. Having penetrated into the endings of dopaminergic neurons, dopamine catabolyzes in the cell cytosol or accumulates in vesicles by way of active transport (with the help of the so-called vesicular transporter). The study of dopamine transporter permits the indirect assessment of the density of the terminals of dopamine neurons.
In order to study the activity of presynaptic transmitters by means of PET, 11C-labeled or 18F-labeled tropanes are used, such as a dopamine transporter ligand or the cocaine analog [11C] WIN-35, 428 (WIN) (Volkow et al. 1998). However both of them may influence the CNS and interfere with some medicines. Currently the following RPs have been synthesized to study dopamine transport by means of PET: 11C-β-CIT, 11C-β-CFT and 18F-β-CFT. However, it should be noted that the use of these RPs has not become widespread in clinical practice. This is due to the fact that 11C-β-CIT uptake is directly proportional to tissue perfusion. This circumstance makes it difficult to analyse the obtained images and does not permit to objectively assess the intensity of pathologic changes.
The use of 11C-β-CFT, 18F-β-CFT is limited because of the long duration of examination: it takes several hours for the amount of RP necessary for the optimum signal/noise ratio to get bound with the dopamine transporter. Under these conditions, the short half-life period of 11C and 18F does not permit images of good quality to be obtained. In order to study the vesicular monoamine transporter, (+)-α-[11C] dihydrotetrabenazine (DTBZ) is used (Soucy et al. 1997). However, the vesicular monoamine transporter is not a selective transporter for dopamine and is localized also in the terminals of noradrenergic and serotoninergic neurons.
21.2.2 Study of the Postsynaptic Level of the Dopaminergic System
In order to assess the density of D receptors, 11C-NNC-112 and 11C-raclopride are used. These pharmaceuticals, along with specifying the receptor number, also permit assessment of the dopamine concentration in the postsynaptic fissure. The method is based on the ability of medicines (for example, d-amphetamine) to cause dopamine release from the terminals, in consequence of which dopamine concentration in the synapse increases and it starts to compete with the RP for the receptor binding site. As a result, the number of receptors bound with RP decreases. This method is used for detecting changes in sensitivity of the terminals of dopamine neurons, both normal and in different pathologic states (Laruelle 2000).
Besides the indicated RPs, 11C-methylspiroperidol or 18F-methylspiroperidol are used for assessing the state of D2 receptors (MacGregor et al. 1987).
21.3 The Serotoninergic System
In studies on serotonin [11C]α-methyl-l-tryptophan is currently used. Under the effect of the enzyme tryptophanhydroxylase, it is transformed to α-methylhydroxytryptophan, then its decarboxylation (with participation of AAD) and transition to α-methylserotonin take place. Unlike serotonin, α-methylserotonin is not catabolyzed by monoaminoxidase and consequently its accumulation level reflects the activity of the serotonin synthesis. The initial studies carried out with the indicated RP have shown significant difference in intensity of serotonin synthesis among volunteers (for example, depending on the sex, presence of migraine in the anamnesis, etc.) (Chugani et al. 1998). In subsequent studies on animals, it has been demonstrated that [11C]α-methyl-l-tryptophan transport and uptake in the brain largely depend on the concentration of large neutral aminoacids in blood plasma and in cerebral matter (Chugani et al. 1999; Shoaf et al. 2000).
21.3.1 Study of the Activity of Presynaptic Transporters
In order to study the density of serotonin transporter, inhibitors of reverse serotonin uptake are used – that is antidepressants. 11C or 18F is used as label. However, excessive lipophilicity of these pharmaceuticals and, as a result, high level of nonspecific binding, as well as low clearance limit, their use for PET. These shortcomings are absent in trans-1,2,3,5,6,10-β-hexahydro-6[4-(methylthio)phenyl]pyrrolo-[2.1-a]-isoquinoline ([+]-[11C]McN5652). Researches with use of this RP have detected significant differences in its uptake in different structures of the brain (primarily in the thalamus, hypothalamus, basal nuclei and mesencephalon) (Staley et al. 1998).
21.4 The Cholinergic System
The study of the cholinergic system arouses much interest due to its participation in the pathogenesis of Alzheimer’s disease and, to a lesser extent, of schizophrenia and parkinsonism. 11C-Nicotine was one of the first RPs synthesized for studying the cholinergic system of the brain (Muzic et al. 1998). However, its uptake reflects perfusion and blood–brain barrier penetrability to a greater extent than specific binding with acetylcholine receptors. A more selective pharmaceutical is an analog of the nicotine receptor agonist epibatidin (exo-2-(2′-chloro-5′-pyridil) – azabicyclo [2.2.1] heptanes labeled with 18F.
An analog of 3-quinuclidinyl benzilate has been suggested for studying muscarinic receptors (Giindisch 2000).
21.5 Other Neurotransmitter Systems
11C-Flumazenil is an RP of much importance for studying the density of benzodiazepine receptors; it is widely used for diagnosing epilepsy (Koepp et al. 2000).
21.6 Use of PET in Diagnosing Different Brain Diseases
21.6.1 Cerebrovascular Diseases
PET has been used for more than 20 years in diagnosing cerebrovascular diseases (Ackerman et al. 1981; Baron et al. 1981). Most often in examining patients with vascular brain diseases, use is made of H215O and gaseous 15O (for assessing cerebral blood flow rate) and 18F-FDG (for studying the level of glucose metabolism).
Acute Ischemic Stroke (The First 24 h)
Early PET detection of an apparent decrease in oxygen utilization in the acute period of ischemic stroke permits assessment of the presumable minimum final volume of cerebral infarction. It has been shown that the volume of a focus of ischemia with sharply reduced oxygen metabolism rate detected by PET performed during the first 5–18 h after the stroke correlates with the final volume of cerebral infarction according to CT done 1 month after the stroke. However, the size of the area with low OMR values as revealed by PET was smaller than the size of cerebral infarction detected by CT which is due, according to the authors, to the development of irreversible changes in the ischemic penumbra (De Reuck et al. 1997; Heiss 2003).
Early development of hyperperfusion, indicating recanalization of the occluded artery and resumption of blood flow through it, is observed in one-third of patients examined with PET between 5 and 18 h after the stroke occurred. In most cases a considerable increase in OMR is observed, which seems to be caused by postischemic reaction of energy-dependent cell processes. At the same time, the oxygen extraction fraction is considerably reduced in these areas, which suggests the syndrome of excessive perfusion. It should be particularly noted that no morphologic changes are observed in such patients in the area of early hyperperfusion according to CT examination done after the end of the acute phase of the stroke. The area of ischemic penumbra is characterized by a sharp reduction in cerebral blood flow (below 20 mL/100 g/min), apparent OEF increase and moderate OMR decrease. Sharp decrease in OMR with intact cerebral blood flow as well as fast progressing reduction of the elevated OEF down to its minimum values suggest irreversible changes in the area of ischemic penumbra. As a rule, the outcome of the ischemic penumbra is decided during the first hours of ischemia; however, in some cases it may persist longer, at least up to 16 h (Sobesky et al. 2006).
An assessment of the interrelation of changes in hemodynamics and metabolism, as detected by PET, with clinical outcome of ischemic stroke has been done by Marchal et al. (1999). Three variants of changes have been found:
1.
A vast cortical-subcortical zone of necrosis
2.
An area of ischemic penumbra in the cortex of the big hemispheres with focus of necrosis absent or with a small deep cerebral infarction
3.
An area of hyperperfusion with OMR being within its normal values or lowered in a very small brain area
A correlation has been detected between PET data and stroke outcome. In all the patients of the first group, the outcome was utterly unfavorable: the patient’s death or gross residual neurological deficiency. In all the patients of the third group, a rapid recovery of lost functions was observed. The outcome in the patients of the second group was diverse and unpredictable: from death to complete regression of neurological symptoms. These observations indicate that the dimensions of the part of ischemic penumbra which undergoes irreversible changes and necrosis may be various. Moreover, the volume of ischemic penumbra that was not subject to necrosis has a large impact on subsequent recovery, thereby confirming that the survival of cells of ischemic penumbra is a crucial point of recovery after the stroke. The obtained data have demonstrated that the clinical heterogeneity of cerebral strokes (which manifests itself as unpredictability of stroke outcome in each particular case) is conditioned by that of pathophysiological changes in the brain (Marchal et al. 1999).
A sharp local increase in OEF in acute ischemic stroke indicates an autoregulation disorder in this region of the brain. It does not seem to be accidental that reactive arterial hypertension is often observed in such patients. Any additional lowering of systemic arterial pressure will lead to further lowering of central perfusion pressure and, correspondingly, to induce a decrease in cerebral blood flow in the area of ischemia, which can have very unfavorable consequences if this area already is an ischemic penumbra. It is probably for this reason that reduction in arterial pressure in some patients with acute stage of the disease leads to the progression of ischemic stroke. Medication-induced increase in systemic arterial pressure in case of poor perfusion syndrome in some patients with acute ischemic stroke may improve the rates of cerebral hemodynamics and metabolism and lead to regression of neurological symptoms (Moustafa and Baron 2008).
The results of PET examinations have permitted some conclusions to be drawn of much importance for the prognosis of outcome of ischemic stroke and determining indications for a particular kind of treatment; they are also of help in selecting patients for randomized clinical trials aimed at assessing the efficiency of different medicines.
Detecting hyperperfusion within up to 18 h after the stroke may suggest that a spontaneous artery recanalization occurred and almost always implies a favorable outcome. It is not advisable to include such patients into clinical trials of medicines, even though they may receive treatment with drugs of the antioxidant group which facilitates the reduction of brain lesion volume.
The detection of a vast area with very low hemodynamic and metabolism rates later than 6 h after the stroke occurred indicates an unfavorable prognosis with high risk of developing massive brain edema and early death of the patient. Such patients should also be excluded from clinical trials. Nevertheless, since vasogenic brain edema may itself promote a more severe lesion of brain matter in the area of ischemic penumbra, it is expedient to perform anti-edema therapy and/or surgical brain decompression in such patients in the early stages of ischemic stroke (Giffard 2004).
Presence of an area of sharp increase in OEF and decrease in CBF, together with relative stability of OMR, indicates the preservation of ischemic penumbra. Since the outcome of a stroke in such patients in its natural course may be various and is hardly predictable, and since the potential of their recovery depends on the prevalence rate and dimensions of ischemic penumbra, these patients are the best candidates for treatment with neuroprotectors in the frame of clinical trials. Moreover, the detection of signs of ischemic penumbra up to 18 h after the stroke suggests the necessity of revising the conception of a universal therapeutic window limited by narrow time frames (no more than 6 h) as well as the appropriateness of individually assessing the state of brain hemodynamics and metabolism in therapy planning (Ackerman et al. 1981; Marchal et al. 1999).
Subacute and Chronic Stages of Ischemic Stroke
In the subacute period of ischemic stroke, the excessive perfusion syndrome is most often observed in the area of necrosis; it may appear as soon as 2–3 days after the stroke and persist for several weeks. Cerebral blood flow gradually increases, usually achieving its normal or even slightly elevated values by the 12–14th days. OEF decreases down to the limit roughly by the 10th day. Increase in CBF is not accompanied by that in OMR, which, on the contrary, in most cases keeps decreasing, which indicates the low efficiency of blood flow recovery in the irreversibly affected brain matter and perhaps reflects the process of neovascularization with disturbed physiological interrelation of hemodinamics and metabolism. In the area surrounding the area of infarction, moderate changes of PET are often (more than 75% of cases) observed. During more or less 2 months, a progressing decrease in CBF and OMR occurs in the area of cerebral infarction (together with its organization and cavity formation); their values finally tend to zero. In the surrounding brain matter, normalization of CBF and OMR is usually observed (Ackerman et al. 1981; Yamauchi et al. 1999).
Long-term Hemodynamic and Metabolic Consequences of Ischemic Stroke
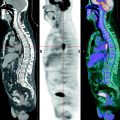
Decrease in CBF and OMR as well as that in glucose metabolism are often observed in brain areas distant from infarction in patients who had ischemic stroke. Detection of such areas permits to map the abnormalities in interneuron connections arising in consequence of focal ischemia. All these phenomena are traditionally united under the general name diaschisis, even though very different cell disturbances may be hidden behind this term – from reversible decrease in functional activity to degenerative process; nevertheless they have in common the same picture of metabolic changes. Since some of these disturbances may have a purely functional character, and so be potentially reversible and since they have an impact on the clinical picture and outcome of ischemic stroke, they have been provoking much interest in researchers and clinicians for the last 15 years. Crossed cerebellar diaschisis, consisting of reduction of OMR and glucose metabolism in the cerebellar hemisphere contralateral to the focus of the lesion, is observed in nearly half of patients with cortical or subcortical ischemic strokes (Grubb et al. 1998; Marchal et al. 1999). This phenomenon is most often observed and is more expressed in extensive infarctions in the frontal/parietal cortex as well as in subcortical infarctions with lesion of the internal capsule (Fig. 21.2).
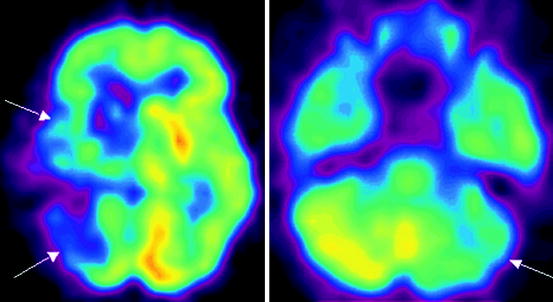
Fig. 21.2
18F-FDG PET data in a patient with consequences of acute cerebral blood flow disturbance in the basin of the right middle cerebral artery. Reduction in glucose metabolism is observed in the right cerebral hemisphere as well as in the left cerebellar hemisphere contralateral to the area of infarction (crossed cerebellar diaschisis) indicated with arrows
Such a topographic interconnection suggests crossed cerebellar diaschisis occurs in consequence of lesion of cortical-cerebellopontine tracts with transneuronal functional depression. In the acute stage of stroke, the presence of crossed cerebellar diaschisis in the basin of the right middle cerebral artery does not have a material effect on the outcome of stroke. However, its absence in the acute stroke stage may suggest a favorable prognosis since good recovery is observed in such patients. In the chronic stroke stage, crossed cerebellar diaschisis is observed in the basin of blood supply of the middle cerebral artery in cases when no significant clinical amelioration is registered. Reduction in metabolism in the cortical sections of the left hemisphere detected in patients with subcortical strokes and aphasia permitted the supposition that speech disorders may be due to the diaschisis phenomena. Normalization of metabolism rates accompanied the regression of subcortical aphasia.
The diaschisis phenomena in the form of diffuse reduction in metabolism in the cortex of the cerebral hemisphere ipsilateral to the focus are described for lesion in different sections of the thalamus and seem to be due to the lesion of activating thalamic and cortical tracts. Reduction in metabolism, although less marked, may be observed also in the cortex of the contralateral cerebral hemisphere. Since the intensity of metabolic disturbances correlates with the severity of cognitive disorders and no reduction in cortical metabolism is observed in patients with infarctions in the thalamus area in the absence of cognitive disorders, an interconnection between these phenomena can be supposed. Like in subcortical strokes without thalamus lesion, the level of glucose metabolism tends to normalize (concurrently with the recovery of cognitive functions) during several months following the unilateral thalamic stroke. PET examinations permitted to detect metabolic effects spreading backwards, from the cortex into the depth of the hemisphere; for example, marked reduction in metabolism in the striate body and thalamus on the side of the cortical and subcortical stroke (Marchal et al. 1999). PET examinations with use of functional speech loads enable the study of the characteristics of speech recovery and to assess the prospects of this recovery in patients with aphasias. A favorable outcome may be related to partial preservation of language zones in the area of cerebral infarction in the dominant hemisphere, as well as to reduction of diaschisis in morphologically intact areas of the contralateral hemisphere.
21.6.2 Dementias
Glucose Metabolism Study
The first studies on the possibility of using 18F-FDG PET in patients with Alzheimer’s disease (AD) were done as far back as in the early 1980s (Benson et al. 1981; Farkas et al. 1982). Recent research has shown that the sensitivity of 18F-FDG PET in diagnosing AD is 88–94% and its specificity is 63–73% (Galton et al. 2000; Fago 2001; Pietrini et al. 2000). PET can be used for predication of cognitive impairments. For example, glucose metabolism decrease in the associative cortex (primarily in prefrontal cortex) indicates with high accuracy the development of cognitive deficiency during the next several years. The posterior associative cortex is situated at the interface of the parietal, temporal and occipital regions. Neurons of the posterior associative cortex have polymodal properties, and they receive information of different modalities: visual, auditory, tactile, kinesthetic. In case of lesion of posterior associative sections, complex forms of space orientation are impaired and performing intellectual operations with participation of spatial analysis is made difficult.
As is known, the prefrontal cortex has a crucial role in ensuring the highest integrative functions. Assessment of the meaning of incoming information, decision making, planning and response are supposed to be realized in this area on the basis of the motivational-emotional and sensory canals.
In Table 21.1, some variants of metabolic changes typical of different nosological forms of dementia are presented (Vander Borght et al. 1997; Holmes et al. 1999; Imamura et al. 1997; Salmon 1994).
Table 21.1
Variants of changes in glucose metabolism in the different nosological forms of dementia
Nosological form of dementia | Typical changes in metabolism in different brain structures |
Moderate cognitive impairment | Hypometabolism in the hippocampal formations and posterior cingulate |
AD (with early and late onset) | The earliest signs are: hypometabolism in mesial temporal lobes, parietal associative cortex, posterior cingulate. Relative preservation of metabolism in the primary sensorimotor and visual cortices. Intact metabolism of thalami, striatum and cerebellum. In early stages, changes in metabolism may have an asymmetric character; however, with time they always become bilateral. |
Discirculatory encephalopathy | Hypometabolism in the frontal lobes, basal nuclei, thalami. |
Post-stroke dementia | Numerous foci of hypometabolism in the cerebral cortex, basal nuclei, cerebellum or solitary zones of lowered metabolism or ametabolism in the strategic regions of the brain (parietal-temporal-occipital interface, thalami, frontal lobes, limbic structures). |
Dementia with Levy’s bodies | Picture similar to that of AD, but hypometabolism in the occipital cortex (mainly in the primary and associative visual cortex), lenticular nuclei and sometimes in the cerebellum is observed. |
Fronto-temporal dementia (e.g., Pick’s disease) | The earliest signs are: hypometabolism in the frontal cortex (including the prefrontal cortex). Here metabolic changes are more marked as compared with lateral temporal and parietal cortices. Relative preservation of metabolism in the primary sensorimotor and visual cortices is characteristic. |
Parkinson’s disease, complicated with dementia | Picture similar to that of AD, however changes in the mediobasal regions of temporal lobes are less marked. Metabolism in the visual cortex is less preserved than in AD |
Typical changes detected in some nosological forms of dementias are presented in the Figs. 21.3–21.5.
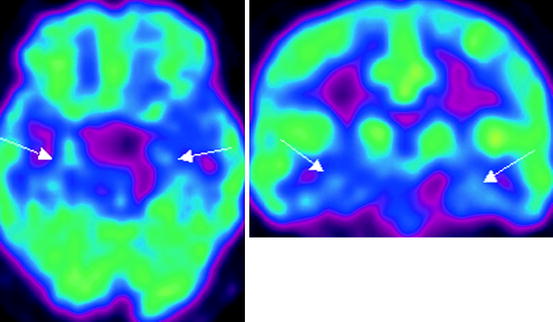
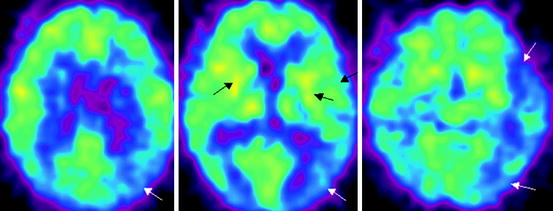
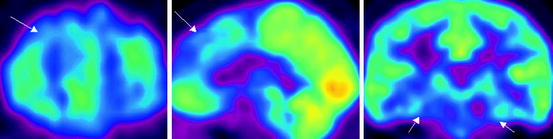
Fig. 21.3
18F-FDG PET data in a patient with Alzheimer’s disease with early onset. Hypometabolism in the mediobasal sections of temporal lobes is observed (indicated with arrows)
Fig. 21.4
18F-FDG PET data in a patient with dementia with Levy’s bodies. Hypometabolism in the parietal-temporal cortices, occipital lobes, lenticular nuclei is observed, more marked on the left (indicated with arrows)
Fig. 21.5
18F-FDG PET data in a patient with fronto-temporal dementia. Bilateral reduction in glucose metabolism in the frontal and temporal lobes, lenticular nuclei and thalami is observed (indicated with arrows)
Study of Different Neurotransmitter Systems in Dementias
Dementia with Levy’s bodies (DLB) is known to be almost always accompanied by the development of parkinsonism. For this reason, in the differential diagnosis of AD and DLB, 18F-DOPA and other RPs may be used for assessing the dopaminergic system of the brain. DLB is notable for lowered 18F-DOPA uptake in the striatum. The sensitivity and specificity of 18F-DOPA PET in differential diagnosis of AD and DLB constitute 86% and 100% respectively (Silverman 1999).
It has been proved that the disturbance of acetylcholinergic transmission has an important role in developing cognitive disorders in patients with AD (Wenk 2003; Shen 2004). Reduction in acetylcholine content in AD is considered to be due to the degeneration of neurons of the basal nucleus of Meynert; conductive tracts go from it towards many areas of the cerebral cortex (Salehi et al. 1996). Cholinergic neurons of this nucleus are capable of producing acetylcholinesterase, which destroys acetylcholine. Studies with an analog of ACE, 11C-methyl-piperidine-4-yl propionate (11C-PMP) detect uptake decrease of this RP in the neocortex, hippocampus and amygdaloid body in AD with early onset. In AD patients with late onset, reduction in 11C-PMP uptake is observed in the parietal-temporal region and in the amygdaloid body (Bohnen et al. 2005; Ryu and Chen 2008). A significant correlation has been detected between ACE activity in the cerebral cortex as measured with help of 11C-PMP and the intensity of cognitive changes assessed by means of MMSE. Besides, ACE inhibitors penetrating through the blood–brain barrier are known to have a favorable impact on the clinical state of AD patients. 11C-PNP can also be used in the differential diagnosis between AD and dementia in Parkinson’s disease (PD). For example, in PD complicated with dementia, a more marked and diffused decrease in ACE activity (and corresponding decrease in 11C-PMP uptake) is observed compared with Alzheimer’s disease (Silverman 1999; Silverman et al. 2001).
Study of b-Amyloid and t-Protein
Currently, specific RPs are being sought for accurate differential diagnosis between AD and other kinds of dementias. It is known that AD is characterized by the development of cerebral amyloidosis with the formation of amyloid plaques. A formed amyloid plaque includes the nucleus and degenerated neurons surrounding it and containing intracellular plexus. The basis of the nucleus of amyloid plaque is composed of pathologic hyperaggregated β-amyloid (42 amino acids) and of a number of additional components (apoliprotein E, residues of microglia, etc.). Intraneuronal plexuses are hyperphosphorylated τ-protein balls. In its normal state this protein is connected with the system of microtubules and supports the internal structure of neuron. It is supposed that the first initial histopathological changes (in particular, deposition of amyloid plaques) in AD may occur long (10–20 years) before the appearance of the first clinical symptoms. By now several RPs have been synthesized which are capable of binding with β-amyloid plaques. In clinical practice, N-methyl[11C]2-(4′-methylaminophenyl)-6-hydroxy-benzothiazol (11C-PIB) is used. Recent studies with use of this RP have shown that significant 11C-PIB uptake is observed in the cerebral cortex and striatum already in the early stages of AD (Koivunen et al. 2008). The intensity of 11C-PIB uptake is in strong inverse correlation with the glucose metabolism rate. However, no interrelation between 11C-PIB uptake and the degree of cognitive disorders has been observed. Research with another specific RP for detecting amyloid and τ-protein, 2-(1-{6-[(2-[18F]fluoroethyl)(methyl)amino]-2-naphthyl}ethylidene)malonitrile (18FDDNP), have shown that even in patients with moderate cognitive deficiency, which precedes AD, an increased uptake of this RP in the temporal, parietal and frontal cortex and in the posterior sections of the cingulated gyri is observed. Changes were detected also in patients in whom 18F-FDG PET and MRI had not found significant disturbances of glucose metabolism and of the cerebral structure (Silverman et al. 2001).
21.6.3 Parkinsonism
Study of the State of the Dopaminergic System
In order to assess the state of the presynaptic dopaminergic system (first of all, of the nigrostrial pathway), which is the first to suffer in PD, 18F-DOPA PET is used. This method makes possible the preclinical diagnosis of PD by way of detecting reduced RP uptake in the striatum, since it is known that by the moment when clinical symptoms of the disease appear, 60–70% of dopaminergic neurons die. This RP reflects the activity of the enzyme dopadecarboxylase in presynaptic dopaminergic terminals as well as the level of dopamine accumulation in neurons of the striatum. In the average a 50% decrease in 18F-DOPA uptake is observed in PD patients in the ventrolateral area of substantia nigra and up to 90% decrease in the putamen (Eidelberg et al. 1990; Ito et al. 2002; Morrish et al. 1996, 1998; Verhoeff 1999). Some authors’ data indicate that the use of 18F-DOPA enables not only to detect the decrease in neuronal density and the number of neurons in the striatonigral system in early stages of the disease but also to predict the development of PD. For example, examinations performed in patients without the clinical symptoms of parkinsonism who were observed for a family form of PD have detected a decrease in 18F-DOPA uptake in the putamen. These data are confirmed by other authors’ results of 7-year observation over monozygotic twins with lowered 18F-DOPA uptake in the projection of the lenticular nuclei (Lozano et al. 1998; Verhoeff 1999; Wenning et al. 1997).
Another field of use for 18F-DOPA PET is evaluating the efficiency of PD treatment by means of embryo or stem cell transplantation. For example, comparison of 18F-DOPA PET data and autopsy results has detected a high positive correlation between 18F-DOPA uptake in vivo and tyrosinecarboxylase level in cerebral tissue (Freed et al. 2001). 18F-DOPA uptake rate is in inverse correlation with the degree of motor disorders. At the same time, the correlation between cognitive disorders and dopamine neuron degeneration in these patients is now under discussion. It should be noted that taking levodopa or apomorphine (a strong dopamine mimetic) may induce changes in RP uptake in the striatum. In the early stages of the disease, a decrease in 18F-DOPA uptake by neurons of the striatum occurs in consequence of dopamine autoreceptor activation and reduced activity of the enzyme decarboxylase. Simultaneously increased 18F-DOPA uptake in the dorsolateral prefrontal cortex and anterior cingulated gyri may be detected, which is not observed in the late stages of the disease. This is due to compensatory increase in activity of decarboxylase in the mesocortical dopamine pathway caused by nigrostriatal degeneration. In the presence of pathologic progression, uptake in the striatum and in the indicated cortex may decrease due to progressing degeneration (Lozano et al. 1998; Morrish et al. 1996, 1998).
Use of 18F-DOPA PET has some limitations in patients with early stages of parkinsonism. For example, its use in such patients may provoke an underestimation of the degree of reduction in density of dopaminergic neurons, due to moderate decrease in the dopaminedecarboxylase level. For this reason, most authors suggest using RP selectively binding with dopamine transporter in the early stages of the disease, when its symptoms are poorly marked (Shih et al. 2006; Stoessl 2007; Troiano et al. 2009). In order to assess dopamine neurotransmission, it seems to be preferable to use β-CIT and β-CIT-FP SPECT, since it makes it possible to determine the amount of dopamine transporter in the synaptic fissure with up to 95% specificity. At the same time, in PD and in neurodegenerative diseases accompanied by parkinsonism a reduction in dopamine transporter content in the striatonigral system occurs as soon as in the early stages of the disease (Seibyl et al. 1998; Pirker et al. 2000).
Summarizing, we may state that 18F-DOPA has both advantages and shortcomings in diagnosing parkinsonism compared with other RPs (in particular, 18F-FDG). Its advantages are as follows:
It permits the detection of neuron losses in the striatonigral system in the early stages of D (preclinical diagnosis).
It enables prediction of the development of PD (in family forms of the disease).
18F-DOPA uptake depends on the degree of motor disorders.
It makes it possible to assess the efficiency of embryo and stem cell transplantation.
The shortcomings of this RP are:
In some patients with early PD stages and ill-defined symptoms, false-negative results may be obtained due to moderate dopaminedecarboxylase inhibition.
18F- DOPA uptake does not depend on the degree of cognitive disorders.
It is impossible to make differential diagnosis of neurodegenerative diseases completed by parkinsonism.Related posts:

Stay updated, free articles. Join our Telegram channel

Full access? Get Clinical Tree