Vascular
QUESTIONS
1 What is the normal range of the hepatic arterial resistive index (RI) in a liver transplant patient?
A. 0 to 0.25
B. 0.30 to 0.50
C. 0.55 to 0.80
D. 0.85 to 1.0
View Answer
1 Answer C. After transplantation, the normal range of resistive indices (RIs) is 0.55 to 0.80. However, approximately half of patients have elevated RIs in the immediate postoperative period; the RIs typically normalize within 72 hours. Alternatively, RIs can be transiently low in the immediate postoperative period because of anastomotic edema or hypotension in some patients; persistently low RIs suggest arterial stenosis.
References: Platt JF, et al. Use of Doppler sonography for revealing hepatic artery stenosis in liver transplant recipients. AJR Am J Roentgenol 1997;168(2):473-476.
Sanyal R, et al. Orthotopic liver transplantation: reversible Doppler US findings in the immediate post-operative period. RadioGraphics 2012;32:199-211.
2 A patient presents for follow-up evaluation 2 years after a cadaveric renal transplant. What is the most likely cause of the imaging finding shown in the figure?
|

A. Renal vein thrombosis
B. External compression
C. Transplant rejection
D. Acute tubular necrosis
View Answer
2 Answer C. Normal diastolic flow is antegrade (above the baseline). The figure shows reversed diastolic flow (below the baseline), indicating substantially increased vascular resistance in this dysfunctional renal transplant. Reversed diastolic flow is an important but nonspecific finding in renal transplant patients; differential considerations include external compression of the allograft (e.g., hematoma), renal vein thrombosis, rejection, glomerulosclerosis, and acute tubular necrosis. Although renal vein thrombosis (answer choice A), external compression (answer choice B), and acute tubular necrosis (answer choice D) can be seen in the acute and subacute settings, rejection is the most common long-term cause of reversed diastolic flow in renal transplant patients.
References: Baxter GM. Ultrasound of renal transplantation. Clin Radiol 2001;56:802-818.
Lockhart ME, et al. Reversed diastolic flow in the renal transplant: perioperative implications versus transplants older than 1 month. AJR Am J Roentgenol 2008;190:650-655.
3 What is the formula for resistive index? (abbreviations: PSV, peak systolic velocity; EDV, end-diastolic velocity)
A. (PSV – EDV)/EDV
B. (PSV – EDV)/PSV
C. (EDV – PSV)/PSV
D. (EDV – PSV)/EDV
View Answer
3 Answer B. PSV – EDV/PSV.
References: Polak J, Pellerito JF. Introduction to vascular ultrasonography: expert consult—online and print, 6th ed. London: Saunders, 2012. ISBN:143771417X.
Tublin ME, et al. The resistive index in renal Doppler sonography: where do we stand? AJR Am J Roentgenol 2003;180(4):885-892.
4 The most common location for a pseudoaneurysm in a cadaveric liver transplant patient is the:
A. Gastroduodenal artery
B. Left hepatic artery
C. Hepatic artery anastomosis
D. Celiac artery
View Answer
4 Answer C. Pseudoaneurysm formation is an uncommon complication of orthotopic liver transplantation but most commonly occurs at the site of arterial anastomosis. Pseudoaneurysms in this location can be due to surgical technique, mycotic etiologies, or as a consequence of angioplasty. Pseudoaneurysms of the more peripheral, intrahepatic branches of the hepatic arteries may develop as a consequence of focal infection or liver biopsy.
References: Bhargava P. Imaging of orthotopic liver transplantation. AJR Am J Roentgenol 2011;196:WS15-WS25.
Caiado A, et al. Complications of liver transplantation: multimodality imaging approach. RadioGraphics 2007;27:1401-1417.

A. Hepatic vein thrombosis
B. Portal vein thrombosis
C. Hepatic artery thrombosis
D. Inferior vena cava thrombosis
View Answer
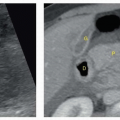
5 Answer C. The US image shows heterogeneous periportal fluid collections, whereas the CT image shows biliary necrosis manifested as periportal hypoattenuation.
In the liver transplant patient, the hepatic artery is the sole blood supply to the biliary epithelium. In the setting of hepatic artery thrombosis, the biliary epithelium becomes necrotic and results in sloughing of cells and debris into dilated bile ducts. Venous thrombosis (hepatic veins, portal veins, or IVC) may lead to areas of infarction and altered enhancement, but does not lead to biliary necrosis. Additionally, the portal veins and IVC are shown to be patent in the figure.
References: Bhargava P. Imaging of orthotopic liver transplantation. AJR Am J Roentgenol 2011;196:WS15-WS25.
Itri JN, et al. Hepatic transplantation: post-operative complications. Abdom Imaging 2013;38:1300-1333.
6 What is the most common vascular complication of orthotopic liver transplant?
A. Portal vein thrombosis
B. Hepatic artery thrombosis
C. Hepatic vein thrombosis
D. Pseudoaneurysm
View Answer
6 Answer B. Hepatic artery thrombosis is the most common vascular complication affecting orthotopic liver transplant and has been reported to occur in up to 12% of cases. The onset is variable and can occur from days to months following the transplant surgery.
References: Bhargava P. Imaging of orthotopic liver transplantation. AJR Am J Roentgenol 2011;196:WS15-WS25.
Singh A, et al. Post-operative imaging in liver transplantation: what radiologists should know. RadioGraphics 2010;30:339-351.
7 Following cadaveric liver transplantation 9 months ago, a patient undergoes surveillance ultrasound and is found to have new-onset ascites, pleural effusion, hepatomegaly, and distension of the hepatic veins. The most likely explanation for these findings is:
A. Hepatic artery stenosis
B. Portal vein stenosis
C. Vena caval stenosis
D. Biliary stenosis
View Answer
7 Answer C. Suboptimal hepatic venous outflow leads to distension of the hepatic veins and IVC, hepatomegaly, ascites, and pleural effusions. Vena caval or hepatic venous anastomotic stenosis can occasionally be shown at gray-scale imaging but is more commonly detected on color Doppler evaluation as a focus of aliasing. Spectral Doppler will also show aliasing because of the increased velocities at the site of stenosis and blunting of the upstream hepatic venous waveforms. Answer choices A, B, and D are also complications of liver transplantation, but would not present with the imaging findings listed in the question stem.
References: Bhargava P. Imaging of orthotopic liver transplantation. AJR Am J Roentgenol 2011;196:WS15-WS25.
Itri JN, et al. Hepatic transplantation: post-operative complications. Abdom Imaging 2013;38:1300-1333.
8 The following image was obtained immediately following percutaneous biopsy of the transplanted kidney. The most appropriate next step is:
|

A. Short-term follow-up ultrasound
B. CT angiography
C. Coil embolization
D. Surgical repair
View Answer
8 Answer A. Spectral Doppler evaluation demonstrates focal color aliasing at the renal transplant superior pole biopsy site. There is a high-velocity, low-impedance waveform with increased diastolic flow because of an arteriovenous fistula. The majority of arteriovenous fistulas are small, clinically insignificant, and resolve spontaneously. Therefore, short-term follow-up can be performed to assess for resolution. Coil embolization (answer choice C) and surgical repair (answer choice D) are required in only a minority of cases.
References: Elsayes KM, Menias CO, Willatt J, et al. Imaging of renal transplant: utility and spectrum of diagnostic findings. Curr Probl Diagn Radiol 2011;40(3):127-139.
Rajiah P, Lim YY, Taylor P. Renal transplant imaging and complications. Abdom Imaging 2006;31(6):735-746.
9 A patient underwent renal transplant 8 months ago and presents for follow-up imaging. What is the significance of the spectral waveform obtained during surveillance imaging?
|

A. Renal artery stenosis
B. Pseudoaneurysm
C. Arteriovenous fistula
D. Renal vein thrombosis
View Answer
9 Answer A. The intrarenal segmental arterial waveform shows a rounded appearance of the systolic peak, consistent with a tardus-parvus pattern. The tardus-parvus pattern gets its name because the systolic peak is delayed (acceleration time >0.08 s) and the peak velocity is reduced.
A pseudoaneurysm (answer choice B) is characterized by disorganized spectral flow in its neck during which high-velocity flow is shown above and below the baseline (“to-and-fro” appearance). The spectral waveform of an arteriovenous fistula (answer choice C) is characterized by a low-resistance pattern because of high systolic velocity and high diastolic velocity from the abnormal shunting between an artery and vein. The spectral waveform of the renal artery in the setting of renal vein thrombosis (answer choice D) is characterized by a high-resistance pattern because of reversal of diastolic flow.
References: Granata A, et al. Renal transplant vascular complications: the role of Doppler ultrasound. J Ultrasound 2014;18(2):101-107.
Rodgers SK. Ultrasonographic evaluation of the renal transplant. Radiol Clin North Am 2014;52(6):1307-1324.
10 The technologist could not identify flow in the portal vein of a liver transplant patient. What adjustments should be made to the wall filter and pulse repetition frequency (PRF)?
A. Decrease wall filter and decrease PRF
B. Decrease wall filter and increase PRF
C. Increase wall filter and decrease PRF
D. Increase wall filter and increase PRF
View Answer
10 Answer A. In order to detect slow flow, filter settings should be kept at the lowest possible setting (generally in the 50 to 100 Hz range). Reducing the wall filter setting results in filling-in of the spectral data toward the baseline. In patients with slow flow, a high-wall filter setting may obscure low-velocity blood and lead to an erroneous interpretation of vessel occlusion. The PRF indicates the rate (frequency) at which data are sampled. This variable is directly related to the velocity range (or scale) because higher-flow velocities require more rapid sampling and a larger scale. If the PRF is set too high, slower moving blood is difficult to appreciate and may be obscured. When the PRF is reduced, the range of depicted velocities is reduced and slower flow can be appreciated qualitatively and quantitatively.
References: Boote EJ. Doppler US techniques: concepts of blood flow detection and flow dynamics. RadioGraphics 2003;23:1315-1327.
Kruskal JB, et al. Optimizing Doppler and color flow US: application to hepatic sonography. RadioGraphics 2004;24:656-675.
11 Spectral Doppler aliasing can be reduced by:
A. Decreasing the scale
B. Using a lower-frequency transducer
C. Sampling at a greater depth
D. Choosing a Doppler angle closer to 0 degrees
View Answer
11 Answer B. Selecting a lower-frequency transducer decreases the Doppler shift and will lead to a reduction in aliasing.
Decreasing the scale (answer choice A) would lead to increased aliasing, whereas increasing the scale would reduce aliasing. Choosing a sample volume at a greater depth (answer choice C) would increase aliasing, whereas sampling at a less depth would lead to an increase of pulse repetition frequency and serve to decrease aliasing. Answer choice D is incorrect as this would lead to higher-frequency Doppler signal detected and would increase aliasing; however, increasing the Doppler angle would lead to decreases in Doppler shift and would serve to reduce aliasing.
References: Boote EJ. Doppler US techniques: concepts of blood flow detection and flow dynamics. RadioGraphics 2003;23:1315-1327.
Kruskal JB, et al. Optimizing Doppler and color flow US: application to hepatic sonography. RadioGraphics 2004;24:656-675.
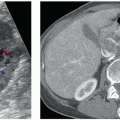
12 Ultrasound images focused on the portal venous system are shown in a patient with known cirrhosis and hepatocellular carcinoma. What is the most specific sign of the abnormality shown?
|

A. Cavernous transformation
B. Echogenic clot
C. Luminal expansion
D. Arterial flow within the clot
View Answer
12 Answer D. Images show echogenic material in the left portal venous system with internal vascularity on color Doppler interrogation, concerning for malignant portal venous thrombosis.
Tumoral neovascularity results in the disorganized formation of arteries and veins within the mass. The ability of spectral Doppler interrogation to show an arterial waveform within an occluded portal vein is the most specific sign of malignant portal venous thrombosis.
Echogenic clot (answer choice B) within the portal vein can be seen in both benign and malignant etiologies and the degree of echogenicity is not a distinguishing feature. Additionally, the echogenicity of a clot will vary depending on its age. Because tumor thrombus can be seen in the setting of a normal-sized portal vein, vessel diameter is not considered to be a distinguishing feature, thereby making answer choice C incorrect. Cavernous transformation (answer choice A) refers to the development of collateral vessels in or around the occluded portal vein. Although cavernous transformation tends to be more associated with bland thrombus, it has also been documented in cases of malignant portal vein thrombosis.
Reference: McNaughton DA, et al. Doppler US of the liver made simple. RadioGraphics 2011;31:161-188.
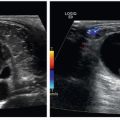
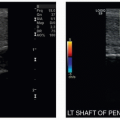
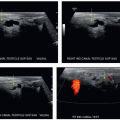
13 A 28-year-old male with right scrotal pain is referred for an ultrasound examination to evaluate for testicular torsion. No color flow is detected within either testis. In order to ensure that the finding is not artifactual, how should color priority threshold be adjusted?
A. Color priority threshold should be increased.
B. Color priority threshold should be decreased.
C. Color priority threshold does not affect Doppler sensitivity.
View Answer
13 Answer A. The color priority threshold setting can be adjusted to eliminate unwanted color Doppler signal from a color flow image. Assuming that color flow should only be seen in an anechoic blood vessel, the color priority can be decreased to the point where color signal is only displayed within anechoic structures. Any pixel with a gray-scale value above that of the color priority threshold level will display the gray-scale information only, even if there is corresponding color Doppler information. This can be useful to eliminate unwanted signal outside of a known vessel. However, when attempting to detect flow within small vessels, a too low color priority threshold can lead to suppression of desired signal.
Shown are two images from a scrotal ultrasound. The first image shows no color signal within the testes. After increasing the color priority threshold (yellow arrow), vascular flow is demonstrated.
|

Reference: Hertzberg BS, Middleton WD. Ultrasound: the requisites, 3rd ed. Philadelphia, PA: Elsevier, 2016:19.
14 Which of the following will increase the Doppler sensitivity?
A. Increase wall filter.
B. Increase ensemble length.
C. Increase pulse repetition frequency.
D. Increase Doppler beam steering.
View Answer
14 Answer B. Ensemble length (also known as dwell time) is the number of sound pulses used to generate each individual line on a color Doppler image. Increasing the number of pulses per line increases the sensitivity for the detection of a Doppler shift at any given location.
Increasing the wall filter (answer choice A) will increase the threshold below which frequency shifts are not displayed, filtering out signal from slower flow. Increasing the PRF (answer choice C) will decrease the sensitivity for the detection of slow flow. Increasing steering of the ultrasound beam (answer choice D) using a linear array probe will decrease Doppler sensitivity for several reasons. First, beams that are steered lose more of their energy to side lobes than beams that are not steered. Second, echoes returning to the probe from the patient reach the surface of the transducer at an angle, also resulting in a weaker signal.
Reference: Hertzberg BS, Middleton WD. Ultrasound: the requisites, 3rd ed. Philadelphia, PA: Elsevier, 2016:18-19.
15 In the following hepatic venous waveform, during which phase of the cardiac cycle does the annotated portion of the hepatic venous waveform occur?
|

A. Early diastole
B. Late diastole
C. Early systole
D. Late systole
View Answer
15 Answer B. The yellow arrow shows the a wave, which occurs in late diastole during atrial contraction; the normal a wave corresponds to retrograde hepatic venous flow and is shown above the baseline. The S wave (annotated by blue arrow below) occurs in midsystole and represents antegrade hepatic venous flow because of movement of the atrioventricular septum toward the cardiac apex. The D wave (annotated by red arrow below) occurs in early diastole because of rapid filling of the right ventricle. Normally, the S wave extends further below the baseline than the D wave. The transitional v wave occurs between systole and diastole and may extend above or below the baseline. An initial upward-sloping component represents continued but slowing right atrial filling against a closed tricuspid valve. The peak of the v wave signals opening of the tricuspid valve. Blood then moves from the right atrium into the right ventricle, resulting in the downward-sloping component of the v wave.
|

References: McNaughton DA, et al. Doppler US of the liver made simple. RadioGraphics 2011;31:161-188.
Scheinfeld MH, et al. Understanding the spectral Doppler waveform of the hepatic veins in health and disease. RadioGraphics 2009;29:2081-2098.
16 What is the most likely etiology of the high-velocity spikes in the following Doppler spectral tracing of the portal vein?
|

A. Stenosis
B. Clot
C. Gas
D. Septic emboli
View Answer
16 Answer C. The sharp, bidirectional spikes superimposed on the normal monophasic portal vein waveform are due to intraluminal gas bubbles. During gray-scale evaluation, the gas bubbles appear as highly echogenic particles flowing within the portal vein. Portal venous gas may be due to life-threatening (i.e., bowel ischemia) and benign etiologies. Intraluminal clot (answer choice B) is stationary and may appear as hypoechoic or echogenic, depending on the age and composition of the blood products. Septic emboli (answer choice D) are not typically detected by US unless sufficiently large. Stenosis (answer choice A) can result in turbulent, disorganized flow and result in elevated peak velocities. However, clot, septic emboli, and stenosis do not produce the narrow, high-velocity spikes on the waveform that are shown in this case.
Reference: Abboud B, et al. Hepatic portal venous gas: physiopathology, etiology, prognosis and treatment. World J Gastroenterol 2009;15(29):3585-3590.
17 What is the most likely etiology for the following spectral waveform obtained from this patient’s left hepatic vein?
|

A. Mitral regurgitation
B. Right-sided heart failure
C. Tricuspid regurgitation
D. Hepatic vein compression
View Answer
17 Answer C. In tricuspid regurgitation (TR), atrial contraction forces blood antegrade into the right ventricle and also retrograde toward the liver producing a taller than normal retrograde (above the baseline) a wave. During systole, the ventricle contracts and the tricuspid annulus moves toward the cardiac apex. Because of the incompetent tricuspid valve, blood regurgitates through the tricuspid valve into the right atrium, IVC, and hepatic veins; this results in an abnormally blunted or retrograde (above the baseline) S wave. As the ventricle begins to relax, the tricuspid annulus returns to a normal position, and blood is forced out of the atrium and into the IVC and liver; this produces an abnormally tall, retrograde v wave. Although the atrium and ventricle are relaxed and the tricuspid valve open during diastole, blood passively flows out of the liver and IVC into the heart; this produces the D wave, which is the only antegrade wave (below the baseline).
In summary, the salient Doppler spectral findings are a pulsatile waveform, exaggerated (i.e., tall) a and v waves, and a decreased or reversed S wave. With moderate TR, the S wave is not as deep as the D wave; with severe TR, the S wave reverses (i.e., appears above the baseline) and merges with the a and v waves to form a retrograde, complex a-S-v wave as in this case.
In right-sided heart failure (answer choice B), the a and v waves are exaggerated, but the S and D waves maintain a normal relationship (i.e., the S wave extends further below baseline than the D wave). Mitral regurgitation (answer choice A) affects the left side of the heart and typically does not alter the hepatic venous waveform. Compression of the hepatic vein (answer choice D) results in blunting of the waveform (i.e., loss of phasicity) evidenced by reversal of the a wave and eventual inability to distinguish the individual components of the normally phasic hepatic venous waveform.
References: Abu-Yousef MM. Duplex Doppler sonography of the hepatic vein in tricuspid regurgitation. AJR Am J Roentgenol 1991;156(1):79-83.
McNaughton DA, et al. Doppler US of the liver made simple. RadioGraphics 2011;31:161-188.
18 Doppler interrogation of the distal right internal carotid artery (ICA) was performed. Which of the following most likely resulted in this waveform?
|

A. Ipsilateral ICA stenosis
B. Contralateral ICA stenosis
C. Ipsilateral ECA stenosis
D. Contralateral ECA stenosis
View Answer
18 Answer A. “Tardus” refers to a slow systolic upstroke, resulting in a longer acceleration time. “Parvus” refers to dampening of the systolic peak, leading to a decrease in amplitude and rounding of the systolic peak. Tardus-parvus waveforms commonly occur downstream to a significant arterial stenosis. In this example, the slanted configuration of the initial systolic upstroke waveform component is indicative of a slow systolic upstroke (tardus). The top of the waveform is dampened and rounded rather than sharply defined and peaked (parvus).
The cause of the parvus et tardus waveform in this case was proximal ICA stenosis. This is seen in the image.
|

The peak systolic velocity within the proximal internal carotid artery was markedly elevated. According to a consensus paper written in 2003, following a conference of the Society of Radiologists in Ultrasound, a velocity measurement of >230 cm/s is consistent with a stenosis >70%. The measured velocity in this case met these criteria. Gray-scale information also shows luminal narrowing by atherosclerotic plaque.
Reference: Grant EG, et al. Carotid artery stenosis: gray-scale and Doppler US diagnosis—Society of Radiologists in Ultrasound Consensus Conference. Radiology 2003;229:340.
19 Which of the following is true of compound imaging?
A. Increases temporal resolution
B. Increases signal-to-noise ratio
C. Increases the field of view
D. Improves visualization of deep structures
View Answer
19 Answer B. Spatial compounding is a technique in which images acquired from multiple scan angles are summed to produce the final image. Signal from strong reflectors is reinforced, whereas random speckle noise is not, thereby significantly improving the signal-to-noise ratio. Additionally, artifacts related to nonperpendicular reflectors are reduced, improving edge detail.
This increased SNR ratio comes at the expense of temporal resolution (answer choice A), because of the increased time required for signal acquisition from multiple projections. The field of view is unchanged in compound imaging (answer choice C). Imaging deep structures in obese patients is compromised due to beam attenuation. Compound imaging is not very effective in improving the signal to noise in these cases because all of the transmitted beams are severely attenuated. In this circumstance, speckle and nonperpendicular reflectors play a relatively minor role in image degradation.
Reference: Hertzberg BS, Middleton WD. Ultrasound: the requisites, 3rd ed. Philadelphia, PA: Elsevier, 2016:9.
20a What is the best description of the abdominal aorta? Sagittal (top) and transverse (bottom) images are shown.
|

A. Saccular aneurysm
B. Fusiform aneurysm
C. Pseudoaneurysm
D. Ruptured aneurysm
View Answer
20a Answer B. Images show concentric dilatation of the abdominal aorta up to 6.6 cm, representing a fusiform aneurysm. Eccentric echogenic thrombus is shown along with turbulent Doppler flow.
In contrast to fusiform aneurysms, saccular aneurysms exhibit eccentric dilatation and outpouching along only a portion of the vessel wall circumference. On ultrasound, findings of a ruptured aneurysm may include heterogeneously hypoechoic complex fluid around the aorta in a symptomatic patient. Findings of aneurysm rupture are usually more easily seen on CT.
Pseudoaneurysms of the abdominal aorta are rare, and traumatic and autoimmune etiologies have been described.
References: Borioni R, Garofalo M, Seddio F, et al. Posttraumatic infrarenal abdominal aortic pseudoaneurysm. Tex Heart Inst J 1999;26(4):312-314.
Kaufman JA, Lee MJ. Vascular and interventional radiology: the requisites. St. Louis, MO: Mosby, 2004.
Okita Y, Ando M, Minatoya K, et al. Multiple pseudoaneurysms of the aortic arch, right subclavian artery, and abdominal aorta in a patient with Behçet’s disease. J Vasc Surg 1998;28(4):723-726.
20b What is the annual risk of rupture for an abdominal aortic aneurysm >5 cm?
A. 0%
B. 2%
C. 5%
D. 10%
E. 20%
View Answer
20b Answer D. The risk of rupture of an abdominal aortic aneurysm (AAA) varies with diameter. The abdominal aorta is considered aneurysmal when its diameter reaches 3 cm. For aneurysms <4 cm, annual risk of spontaneous rupture is near 0%. It increases to 1% to 3% for aneurysms measuring 4 to 5 cm. Small aneurysms <5 cm should undergo imaging surveillance every 6 to 12 months. Annual rupture risk is 6% to 11% at 5 to 7 cm, and 20% for aneurysms equal to or larger than 7 cm. Open or endovascular repair is usually performed when the aneurysm reaches 5 cm.
References: Brown PM, Zelt DT, Sobolev B. The risk of rupture in untreated aneurysms: the impact of size, gender, and expansion rate. J Vasc Surg 2003;37(2):280-284.
Kaufman JA, Lee MJ. Vascular and interventional radiology: the requisites. St. Louis, MO: Mosby, 2004.
Schwartz SA, Taljanovic MS, Smyth S, et al. CT findings of rupture, impending rupture, and contained rupture of abdominal aortic aneurysms. AJR Am J Roentgenol 2007;188(1):W57-W62.
20c When present, which of the following is associated with a 40% coincidence of abdominal aortic aneurysm?
A. Thoracic aortic aneurysm
B. Renal artery aneurysm
C. Splenic artery aneurysm
D. Popliteal artery aneurysm
View Answer
20c Answer D. Popliteal artery aneurysm (PAA) is the second most common atherosclerotic aneurysm. Thirty to fifty percent of patients with a PAA will also have an AAA. However, only 10% to 14% of patients with an AAA will have a PAA. As opposed to AAAs, PAAs are found almost exclusively in men. The other aneurysms listed occur less frequently and have a lower association with AAA.
References: Diwan A, Sarkar R, Stanley JC, et al. Incidence of femoral and popliteal artery aneurysms in patients with abdominal aortic aneurysms. J Vasc Surg 2000;31(5):863-869.
Wright LB, Matchett WJ, Cruz CP, et al. Popliteal artery disease: diagnosis and treatment 1. RadioGraphics 2004;24(2):467-479.
21a A right upper quadrant ultrasound is performed to evaluate this patient for abdominal distension. Based on these color flow Doppler images of the liver, select the best diagnosis.
|

A. Hepatic artery thrombosis
B. Intrahepatic portosystemic shunt
C. Cavernous transformation of the portal vein
D. Arteriovenous malformation
View Answer
21a Answer C. Multiple tortuous vessels are shown within the expected location of the portal vein, representing dilated periportal and peribiliary veins. Cavernous transformation occurs as a result of persistent occlusion or incomplete recanalization of the portal vein following portal vein thrombosis. This network of collateral veins reconstitutes flow to distal nonobstructed portal veins. In spite of this collateral pathway, most patients with cavernous transformation will still have portal hypertension. Causes of portal vein thrombosis include cirrhosis, infection, hypercoagulable states, trauma, and malignancy.
Periportal collaterals are not an expected finding in the setting of hepatic artery thrombosis (choice A). Absence of arterial signal along the portal triads would suggest hepatic artery thrombosis, usually occurring as a complication following liver transplantation.
Intrahepatic portosystemic shunting (choice B) can occur in the cirrhotic liver. However, it typically occurs more peripherally, where similar-sized portal and hepatic veins can form an aberrant connection. Here, the tortuous vessels are in the porta hepatis, distant from the hepatic veins.
An arteriovenous malformation (AVM) (choice D) is unlikely given that the tortuous vessels extend from the porta hepatis along the course of the right portal vein. A dilated feeding artery and draining vein are often seen leading toward and away from an AVM.
21b What would be the ultrasound appearance of the main portal vein (MPV) in this patient?
A. MPV will not be seen.
B. MPV will be narrowed in caliber.
C. MPV will be of normal caliber.
D. MPV will be abnormally dilated.
View Answer
21b Answer A. In cavernous transformation of the portal vein, the native main portal vein (MPV) is typically scarred down and difficult to see by ultrasound or cross-sectional imaging. The collateral veins that have developed to replace it in the porta hepatis are small caliber.
In acute portal vein thrombosis, the MPV is typically normal caliber or expanded. In portal hypertension, the MPV may be dilated due to increased pressure. In intrahepatic portosystemic shunts, portal veins can be dilated due to increased flow. AVM would show disorganized tangles of smaller caliber vessels as well as feeding artery and draining vein.
References: De Gaetano AM, Lafortune M, Patriquin H, et al. Cavernous transformation of the portal vein: patterns of intrahepatic and splanchnic collateral circulation detected with Doppler sonography. AJR Am J Roentgenol 1995;165(5):1151-1155.
Ginat DT. Thorium dioxide (thorotrast). In Ginat DT, Small J, Schaefer PW (eds). Neuroimaging pharmacopoeia. Dordrecht, Netherlands: Springer International Publishing, 2015:119-122.
Kauzlaric D, Petrovic M, Barmeir E. Sonography of cavernous transformation of the portal vein. AJR Am J Roentgenol 1984;142(2):383-384.
Raby N, Meire HB. Duplex Doppler ultrasound in the diagnosis of cavernous transformation of the portal vein. Br J Radiol 1988;61(727):586-588.
22 The axial resolution of gray-scale imaging is generally better than that of pulsed Doppler. Why?
A. Shorter pulse lengths are used in pulsed Doppler.
B. Longer pulse lengths are used in pulsed Doppler.
C. Axial resolution is independent of pulse length.
D. Axial resolution is equal to pulse length × 2.
View Answer
22 Answer B. Axial resolution is the ability of the ultrasound beam to resolve two objects located along the axis of the ultrasound beam. Axial resolution is half of the pulse length (pulse length ÷ 2). Longer pulse lengths are used in pulsed Doppler to decrease variability in measurement of Doppler shift. The tradeoff is decreased axial resolution.
Reference: Hertzberg BS, Middleton WD. Ultrasound: the requisites, 3rd ed. Philadelphia, PA: Elsevier, 2016:4.
23 Color and duplex Doppler sonography of a transjugular intrahepatic portosystemic shunt (TIPS) was performed for routine follow-up. What is the most likely diagnosis?
|

A. Normal TIPS
B. Hepatic vein stenosis
C. TIPS stenosis, portal end
D. TIPS stenosis, hepatic end
E. TIPS occlusion
View Answer
23 Answer D. The transjugular intrahepatic portosystemic shunt is the most commonly performed invasive procedure for alleviating the symptoms of portal hypertension (varices and refractory ascites). Complications that can occur following the TIPS placement include stent occlusion, stent stenosis, and hepatic vein stenosis. Signs of stent malfunction include the absence of in-stent flow, peak shunt velocities below 90 cm/s or above 190 cm/s, change in peak shunt velocity of 50 cm/s between two studies, decreased peak velocities within the main portal vein <30 cm/s, hepatopetal intrahepatic portal flow, and reversal of flow in the hepatic vein (suggesting hepatic vein stenosis). Indirect signs of TIPS malfunction include increasing ascites and reappearance of varices (including paraumbilical veins).
The images demonstrate borderline elevated peak velocities within the TIPS with aliasing at the hepatic venous side. Additionally, hepatopetal flow is shown within the right portal vein. These findings are concerning for a TIPS malfunction with stenosis at the hepatic venous end.
Reference: Darcy M. Review. Evaluation and Management of Transjugular Intrahepatic Portosystemic Shunts. AJR Am J Roentgenol 2012;199:730-736.
24 High-resolution ultrasound images from right forearm of a 55-year-old woman with erythema and edema in the right forearm are shown. What is the most likely diagnosis?
|

A. Superficial thrombophlebitis
B. Cellulitis
C. Acute deep venous thrombosis (DVT)
D. Anterior interosseous nerve syndrome (Kiloh-Nevin syndrome)
View Answer
24 Answer A. Superficial thrombophlebitis or superficial venous thrombosis (SVT), is characterized by thrombosis of a superficial vein and is associated with inflammatory reaction of adjacent tissue, though the term has also been used to describe superficial vein thrombosis without associated surrounding inflammatory changes. The ultrasound image in this patient demonstrates a long-segment occlusive thrombus with hyperemia of the circumferentially thickened wall. Patients often complain of pain and physical examination reveals a palpable, tender, “cord”-like subcutaneous structure. Overlying skin is often erythematous and warm.
The hyperemia is limited to the tubular vein. Surrounding subcutaneous fat does not demonstrate edema or hyperemia to suggest cellulitis (choice B).
The thrombosed vein is subcutaneous in location and does not represent deep venous thrombosis (choice C).
The tubular structure depicted in the ultrasound image is subcutaneous in location, whereas median nerve entrapment in anterior interosseous nerve syndrome along the volar aspect of forearm is deeper in location. Also, the peripheral hyperemia is not a typical feature of anterior interosseous nerve syndrome (choice D).
Reference: Rumack CM, Wilson SR, Charboneau WJ. Diagnostic ultrasound, 4th ed. Philadelphia, PA: Elsevier Health Sciences, 2011:1031-1033.
25 Right upper quadrant ultrasound showing transverse and long-axis images of inferior vena cava in a 56-year-old woman with abdominal pain are provided. What is the most likely diagnosis?
|

A. Severe tricuspid regurgitation (because of dilated IVC and hepatic veins)
B. Cranial extension of bland pelvic or lower limb deep venous thrombosis
C. Migration of an infrarenal IVC filter into retrohepatic portion of inferior vena cava
D. Leiomyosarcoma of inferior vena cava
View Answer
25 Answer D. The expansile heterogeneous mass with central calcification within the retrohepatic inferior vena cava is highly suggestive of a neoplasm rather than bland thrombus. Though primary tumors of inferior vena cava are rare, leiomyosarcoma is the most common tumor of the venous system and its most common location is the inferior vena cava. Tumor thrombus in the inferior vena cava is more often a result of direct extension of renal cell carcinoma, hepatocellular carcinoma and primary adrenal carcinoma. Expansion of the inferior vena cava lumen and the presence of internal vascularity are two features that distinguish tumor thrombus from a bland thrombus.
A. Tricuspid regurgitation can result in dilatation of inferior vena cava and hepatic veins but is not associated with luminal thrombosis.
B. A bland thrombus in inferior vena cava, unlike tumor thrombus, should not cause such marked expansion of the lumen.
C. Although the central shadowing calcification within the mass could be confused for an IVC filter, the surrounding heterogeneous expansile mass strongly suggests a neoplastic entity.
References: Hertzberg BS, Middleton WD. Ultrasound: the requisites, 3rd ed. Philadelphia, PA: Elsevier, 2016:220-221.
Rumack, CM, Wilson, SR, et al. Diagnostic ultrasound, 4th ed. Philadelphia, PA: Elsevier Mosby, 2011:478-482.
26 Shown here are duplex Doppler ultrasound images of a 40-year-old woman undergoing preoperative evaluation for a pancreatic head neuroendocrine tumor. The images show spectral waveforms of celiac axis during expiration and inspiration. What is the next best step in management of this patient?
|

A. The increased peak systolic velocity of celiac axis in expiration suggests collateral flow through celiac axis to compensate for severe stenosis or occlusion of superior mesenteric artery. Patient needs stenting of SMA.
B. The increased peak systolic velocity in the celiac axis confirms malignant infiltration of celiac axis by the pancreatic tumor contraindicating Whipple procedure. Patient is only eligible for medical management.
C. The increased diastolic flow in the celiac axis on expiration is suggestive of proximal aortic stenosis. Patient needs to undergo placement of an aortic endovascular stent graft.
D. The findings are characteristic of median arcuate ligament compression of celiac axis. This patient can benefit from surgical release of median arcuate ligament.
View Answer
26 Answer D. The increased peak systolic velocity in the celiac axis that improves with inspiration is characteristic of median arcuate ligament compression of celiac axis. The velocity also improves with erect positioning of the patient. Surgical release of the median arcuate ligament relieves compression of celiac axis and improves blood flow.
A. The increased peak systolic velocity of celiac axis in expiration suggests luminal narrowing of celiac and not of superior mesenteric artery. With median arcuate ligament compression of the celiac axis, superior mesenteric artery provides collateral flow through pancreaticoduodenal arcade and gastroduodenal artery.
B. Although increased peak systolic velocity in the celiac axis can be seen with any etiology including atherosclerotic narrowing and malignant infiltration, respiratory variation with improvement of flow velocity in inspiration is seen only with median arcuate ligament compression and not with the other entities.
C. Increase in both peak systolic and end-diastolic velocities is seen with celiac axis narrowing of any etiology. Normalization of velocities during suspended inspiration or with erect positioning indicates median arcuate ligament compression.
References: AbuRahma AF, Stone PA, Srivastava M, et al. Mesenteric/celiac duplex ultrasound interpretation criteria revisited. J Vasc Surg 2012;55:428-436, e6; discussion: 435-436.
White RD, et al. The celiac axis revisited: anatomic variants, pathologic features, and implications for modern endovascular management. RadioGraphics 2015;35(3):879-898.
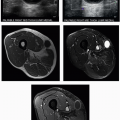
27 A 30-year-old female presents with gradually worsening left lower extremity pain and burning. Her symptoms first began in 2011, and she decided to seek medical attention in 2014 when she started having great difficulty walking. The patient underwent ultrasound, which prompted subsequent MRI. Images from both studies are shown. What is the most likely etiology of her symptoms?
|

A. Giant cell arteritis
B. Takayasu arteritis
C. Polyarteritis nodosa (PAN)
D. Granulomatosis with polyangiitis (GPA)
View Answer
27 Answer B. The ultrasound and MR images show diffuse homogeneous circumferential wall thickening with moderate narrowing of the distal aorta and severe narrowing of the left iliac artery. These findings indicate large vessel vasculitis, and in a young female patient, the most likely etiology is Takayasu arteritis.
Takayasu arteritis is an idiopathic large-vessel arteritis that involves the aorta and its major branches, pulmonary arteries, and coronary arteries. The disease often manifests before the age of 40 years with a distinct female preponderance. Patients typically present with nonspecific constitutional symptoms during initial phase of the disease. Severe stenosis and occlusion of the proximal carotid and subclavian arteries commonly lead to absence of pulses. Other characteristic clinical presentations of Takayasu arteritis include claudication, vascular bruits, renal hypertension, and limb blood pressure discrepancies.
Chronic granulomatous and lymphocytic inflammation affects the intima and media leading to arterial wall thickening, focal stenosis, occlusion, or aneurysm formation. Sonographic findings include vessel wall thickening, luminal narrowing or stenosis, vessel occlusion, and reduced pulsatility. Management of Takayasu arteritis involves controlling the disease activity through medical therapy and decreasing the effects of vascular compromise through surgical or endovascular interventions. Corticosteroid therapy is the mainstay of medical therapy. Other immune-modulating drugs (e.g., methotrexate, azathioprine) are used in patients who do not respond to steroid therapy.
Giant cell arteritis (GCA) (choice A) is a granulomatous vasculitis affecting largeto medium-sized arteries. It is also known as temporal arteritis and tends to involve the extracranial carotid artery branches such as the temporal artery. GCA typically affects older females, usually older than 50 years of age, with a peak age of 70 to 80 years.
Polyarteritis nodosa (PAN) (choice C) is a systemic inflammatory necrotizing vasculitis that involves small- to medium-sized arteries eventually resulting in necrosis and vessel wall destruction. It has slight male predominance and typically presents around the 6th decade. Twenty to thirty percent of patients are hepatitis B antigen positive.
Granulomatosis with polyangiitis (GPA) (choice D), previously known as Wegener granulomatosis, is a multisystem systemic necrotizing noncaseating granulomatous vasculitis affecting small- to medium-sized arteries, capillaries, and veins, with a predilection for the respiratory system and kidneys. There is involvement of the upper respiratory tract leading to necrosis of nasal septum, tracheal necrosis, lung nodules, and necrotizing glomerulonephritis.
Reference: Khosla A, Andring B, Atchie B, et al. Systemic vasculopathies. Radiol Clin North Am 2016;54(3):613-628.
28 A lower extremity venous Doppler study was performed. The left common femoral vein spectral Doppler waveform is noted to be monophasic, whereas the right common femoral vein spectral Doppler waveform is phasic. What is the significance of this finding?
A. Deep vein thrombosis is suspected upstream to the left common femoral vein.
B. Deep vein thrombosis is suspected within in the left common or external iliac vein.
C. Deep vein thrombosis is suspected within in the right common or external iliac vein.
D. This is an expected normal finding on lower extremity ultrasound examinations.
View Answer
28 Answer B. Decreased phasicity of a lower extremity deep vein spectral Doppler waveform raises suspicion for downstream thrombus or narrowing. In the case of monophasic flow within the common femoral vein, an attempt should be made to scan the external and common iliac veins to identify a thrombus or compressing mass. If an abnormality is not identified or if the area is obscured, consider imaging with another modality such as CT or MR.
Reference: Needleman L. Update on the lower extremity venous ultrasonography examination. Radiol Clin 2014;52(6):1359-1374.
29 Ultrasound imaging of the left calf showed an expanded, noncompressible left gastrocnemius vein. How should this finding be reported?
A. Positive for deep vein thrombosis.
B. Negative for deep vein thrombosis.
C. Positive for superficial thrombophlebitis.
D. Negative for superficial thrombophlebitis.
E. Indeterminate for deep vein thrombosis. Further imaging with MRV is advised.
View Answer
29 Answer A. The gastrocnemius veins are located in the calf and are considered part of the deep venous system. Thrombus can be hypoechoic in the acute setting. Noncompressibility of a vein is considered the most sensitive predictor of acute thrombosis. Findings are considered diagnostic for acute deep vein thrombosis and MRV is not necessary.
Reference: Caggiati A, et al. Nomenclature of the veins of the lower limb: extensions, refinements, and clinical application. J Vasc Surg 2005;41(4):719-724.
30 A 50-year-old patient with a carotid bruit was referred for a neck ultrasound after an abnormality was detected on the carotid artery Doppler. Images from a neck ultrasound, a T1-weighted gadolinium-enhanced axial MRI at the level of the lesion, and a digital subtraction angiogram after injection into the common carotid artery are provided. What is the most likely cause of the bruit?
Related posts:
Stay updated, free articles. Join our Telegram channel

Full access? Get Clinical Tree


