y The relatively low incidence of spinal infarctions must certainly relate to the anatomy of ▶ the blood supply to the spinal cord. Briefly, the spinal cord is supplied by three superficial arteries that run longitudinally from the craniocervical junction to the conus medullaris: the anterior spinal artery, which runs on the anterior side of the cord, and the smaller posterior spinal arteries, which are placed posterolaterally. These vessels are interconnected by multiple longitudinal and transverse anastomoses, which form a stepladder-like arterial plexus around the spinal cord, giving the cord some measure of protection against ischemic disease. The unpaired anterior spinal artery is formed at the level of the foramen magnum by the union of two branches from the intradural segments of the vertebral arteries, while each of the paired posterior spinal arteries arises directly from the ipsilateral vertebral artery. As the anterior spinal artery descends, it is joined at multiple levels (usually seven or eight) by a succession of radiculomedullary arteries, which arise from the spinal branches of the corresponding segmental arteries. The 31 pairs of segmental arteries are responsible for the arterial supply to the spine, with one segmental artery basically supplying all associated tissues of the ipsilateral half-metamere. Each of these segmental arteries gives off a spinal branch which supplies one-half of the corresponding vertebral body as well as the corresponding nerve root and dura mater via a radiculomeningeal branch. During the embryonic period, each of these spinal branches also gives rise to radiculomedullary arteries that supply the corresponding spinal cord segment ( ▶ Fig. 15.1). However, most of these segmental branches to the spinal cord regress during embryonic development, and only a few are still present in the newborn (average of 6 anterior and 11–16 posterior). In adults, the anterior spinal artery receives flow from the vertebral arteries and thyrocervical trunks as well as from intercostal, lumbar, and sacral arteries. A particularly large vessel called the anterior radicular artery (artery of Adamkiewicz, arteria radicularis magna) anastomoses with the anterior spinal artery in the region of the lumbar intumescence. It usually arises from the corresponding segmental artery between the T9 and T12 levels. The terminal vascular bed of the large segmental branches to the anterior spinal artery in the upper thoracic cord (approximately T4) was formerly called the “watershed area” because the arteries supplying the spinal cord were the least dense at that level. Consequently, that region was thought to be particularly vulnerable to (hemodynamic) ischemia, and the watershed theory was believed to explain the principal cause of spinal infarctions. This theory is untenable, however, when we note that spinal ischemia most commonly affects the thoracolumbar junction or cervical cord, where the largest tributary vessels to the anterior spinal artery are located. The superficial arteries give off intrinsic arteries to the spinal cord itself. The penetrating (sulcal) arteries that arise from the anterior spinal artery course in the anterior median fissure and supply the anterior two-thirds of the spinal cord cross-section, including most of the gray matter, in a centrifugal pattern. The posterior and lateral portions of the spinal cord, including the dorsal horns and dorsal columns, receive a centripetal supply from small branches of the posterior spinal arteries, which form the vasocorona of the spinal cord (see Fig. 11.21). Due to the pronounced anastomoses and potential collaterals between the superficial arteries and in the vasocorona region, the vascular territories in the spinal cord, and thus the patterns of spinal infarction, are far more variable than the cerebral vascular territories and infarctions.

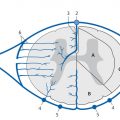
Fig. 15.1 Arterial blood supply to the spine, spinal cord, and meninges. Diagrammatic representation. (a) Cross-section through a vertebral body. (b) Cross-section through the spinal cord.
1 = Aorta
2 = Segmental artery (intercostal artery)
3 = Anterior branch of segmental artery
4 = Posterior branch of segmental artery
5 = Spinal branch of segmental artery
6 = Posterior radiculomeningeal branch
7 = Anterior radiculomeningeal branch
8 = Anterior radiculomedullary branch
9 = Posterior radiculomedullary branch
10 = Anterior spinal artery
11 = Posterior spinal artery
12 = Dura mater
13 = Spinal nerve
14 = Ventral nerve root
15 = Dorsal nerve root
16 = Spinal ganglion
17 = Spinal cord
18 = Vertebral body
19 = Spinous process
20 = Transverse processes
21 = Dorsal horn
22 = Ventral horn
23 = Sulcal artery
24 = Transverse and longitudinal anastomoses
25 = Vasocorona
Pathology and etiology
Aortic pathology On the whole, diseases of the aorta are the most common detectable causes of spinal ischemia. One of the principal etiologic factors is aortic surgery including endovascular therapeutic procedures. The risk of spinal ischemia in these cases ranges from 0.4% to 25% depending on the underlying disease and type of procedure used. The treatment of dissecting aortic aneurysms in particular is associated with a relatively high risk of spinal ischemia. Of course, dissections of the aorta (or less commonly the vertebral artery) may be a primary case of spinal ischemia. While the vessels supplying the spinal cord are themselves rarely affected by atherosclerotic disease, atherosclerotic changes in the aorta may lead to spinal cord infarction. The orifices of the segmental arteries are rarely obstructed by atherosclerotic plaque owing to the good collateral supply; aorto-arterial embolism is a more frequent cause.
Fibrocartilaginous embolism The significance of fibrocartilaginous embolism as a cause of spinal ischemia is probably underestimated, especially in younger women. It occurs when intervertebral disk tissue gains access to the spinal arteries by a mechanism that is not yet fully understood. The most likely theory is that disk tissue herniates into the vertebral body and its venous sinusoids and is then driven secondarily by a pressure gradient into the epidural venous plexus. The small arteriovenous shunts normally present in the epidural space provide an access point whereby the disk tissue can enter the radicular branch of the corresponding segmental artery in response to raised venous pressure. If a spinal supply vessel is present at that level, the tissue can also gain access to the radiculomedullary artery. Patients often give a history of minor trauma or an unaccustomed physical stress (e.g., lifting a heavy object) followed by sudden back pain and progressive neurologic deficits.
Other causes Systemic hypotension, sepsis, decompression sickness, systemic vasculitis, and infectious vasculitis are rare potential causes of spinal ischemia. Syphilis was the most common etiology in the era before penicillin. In many cases, however (up to 50%), a definitive cause of spinal ischemia cannot be identified.
Clinical manifestations The acute clinical presentation of frank spinal ischemia is relatively typical. Some patients give a history of prodromal signs relating to a “transient ischemic attack” in the spinal cord. Patients often describe girdling back pain as an initial complaint, followed by a sensorimotor transverse cord syndrome of sudden onset, depending on the affected level. If a complete cord lesion is not already present initially, the neurologic deficits will often become rapidly more severe over a period of hours or days. The subacute development of sensory and motor deficits is less common. Cervical ischemia may also present with headache and/or chest pain. Ischemia of the conus medullaris leads to bladder and bowel dysfunction.
Note
Because spinal cord infarctions most commonly involve the anterior spinal artery, most patients present clinically with an anterior spinal artery syndrome characterized by flaccid paralysis, loss of intrinsic muscle reflexes, and dissociated dysesthesia, i.e., loss of pain and temperature sensation with intact epicritic and protopathic sensation.
MRI findings
Acute spinal ischemia MRI is the imaging modality of choice for the diagnosis of spinal ischemia, as it is the only modality that can demonstrate ischemia. Analogous to an ischemic brain infarction, the initial hallmark of spinal ischemia is edema. This leads to slight enlargement of the affected cord segment in approximately 50% of cases, which appears hyperintense in T2w sequences ( ▶ Fig. 15.2) and isointense to slightly hypointense in T1w sequences. The extent of the infarction varies greatly in different individuals due to the variable vascular territories described above. But the lesions usually show a central and predominantly anterior location relative to the cross-section of the spinal cord (i.e., when viewed in axial section). The anterior two-thirds of the gray matter is chiefly affected because the infarction usually involves the anterior spinal artery (see ▶ Fig. 15.2). The craniocaudal extent may span multiple segments, but generally no more than three. With a rare infarction of the posterior spinal artery, usually no more than two levels are affected owing to the numerous anastomoses. T2w images in some patients have shown linear hypointensities around the hyperintense edema, which are interpreted as perifocal hyperemia due to an edema-related slowing of blood flow and consequent loss of signal intensity. Contrast enhancement is not detectable in the acute stage. Thus, T2w sequences should suggest the correct diagnosis in patients with suspected spinal ischemia. The MRI changes in these sequences are, however, delayed several hours after the onset of clinical symptoms, again analogous to a cerebral stroke. As a result, T2w and T1w images in spinal ischemia typically appear normal for the first few hours after symptom onset ( ▶ Fig. 15.3). After that time, most patients will show typical hyperintensities on T2w images acquired within the first 24 hours. The infarction becomes increasingly demarcated with passage of time, and follow-up images a few days later will typically show the definitive extent of the infarcted area (see ▶ Fig. 15.3). Thus, in cases where there is urgent clinical suspicion of spinal ischemia, negative MRI during the first few hours after acute symptom onset may be taken as supportive evidence. The infarction should then be confirmed, however, by follow-up imaging more than 24 hours later, which should demonstrate its full extent.

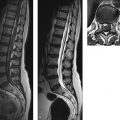
Fig. 15.2 Spinal ischemia in a 50-year-old man with rapidly progressive quadriparesis of acute onset. T2w images acquired 24 hours after symptom onset (a,b) show the typical appearance of acute spinal ischemia in the territory of the anterior spinal artery: hyperintensity of the spinal cord that spans multiple segments (a, arrows) and has a central anterior location relative to the cord cross-section (b arrows). Lesion extent in the axial image (c) conforms to the distribution of the anterior spinal artery. Follow-up images at 8 weeks (b,d) show the typical features of spinal ischemia in the chronic stage with a sharply circumscribed area of spinal cord atrophy (b arrows) and an “owl’s-eye” pattern in the axial image (d arrows).
(a) Sagittal T2w image 24 hours after symptom onset. (b) Sagittal T2w image 8 weeks after symptom onset. (c) Axial T2w image 24 hours after symptom onset. (d) Axial T2w image 8 weeks after symptom onset.

Fig. 15.3 Progression of spinal ischemia in a 32-year-old woman with conus medullaris syndrome. The initial MR images 6 hours after symptom onset (a,e) show no definite signal abnormalities in the conus. On follow-up imaging (b,c,d,f,g) 9 days after symptom onset, the now-subacute spinal ischemia is clearly demarcated and sharply circumscribed in the T2w images (b,f arrows). It is poorly visualized in the unenhanced T1w image (c) but shows marked enhancement (arrows) after contrast administration, which is mostly limited to the gray matter in the axial images (g).
(a) Sagittal T2w image 6 hours after symptom onset. (b) Sagittal T2w image 9 days after symptom onset. (c) Sagittal unenhanced T1w image 9 days after symptom onset. (d) Sagittal contrast-enhanced T1w image 9 days after symptom onset. (e) Axial T2w image 6 hours after symptom onset. (f) Axial T2w image 9 days after symptom onset. (g) Axial contrast-enhanced T1w image 9 days after symptom onset.
Note
Negative spinal MRI including diffusion-weighted imaging (DWI) in the initial hours after onset of acute transverse cord symptoms does not exclude acute spinal ischemia.
As with ischemic brain infarction, diffusion-weighted MRI can be used in principle for the early detection of spinal ischemia ( ▶ Fig. 15.4), and this technique is already being practiced at some centers. However, in contrast to its widespread use in the diagnosis of cerebral disease, this technique has not yet become well established for routine clinical use in the spine. Two problems with spinal DWI are its low spatial resolution relative to the small cross-section of the spinal cord and the sensitivity of diffusion-weighted (DW) sequences to artifacts, especially cerebrospinal fluid (CSF) pulsations and susceptibility artifacts from surrounding vertebral bodies. But with ongoing technical refinements in this sequence, it is certain that DWI will one day be used routinely for the detection of acute spinal ischemia.
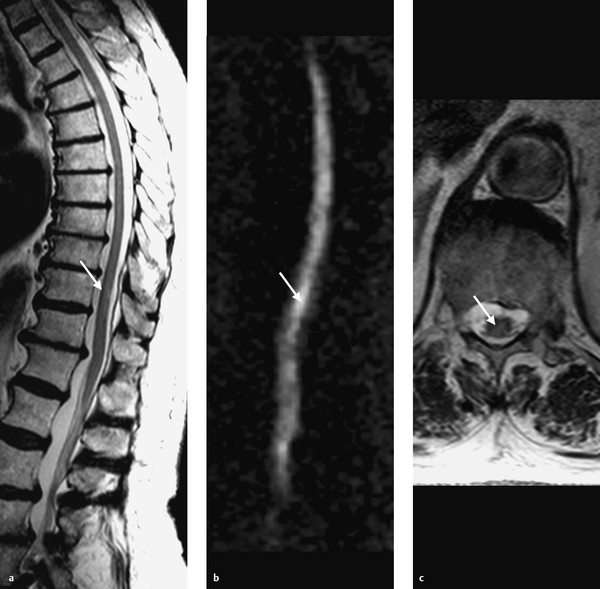
Fig. 15.4 Acute infarction of the posterior spinal artery. (a) Sagittal T2w image 10 hours after onset of spinal symptoms shows a questionable hyperintensity (arrows) in the lower thoracic spinal cord. (b) Sagittal DW image clearly demonstrates abnormal hyperintensity from the posterior infarction (arrow). (c) Axial T2w image 24 hours later displays the infarction as a hyperintense intramedullary lesion (arrow).
When spinal ischemia is suspected, it is important to evaluate the surrounding structures in addition to the spinal cord itself, as there are typical associated findings that may provide important clues to the underlying etiology and may further support the suspicion of spinal ischemia in questionable cases. Another concomitant finding that may suggest the correct diagnosis, especially in the early phase of spinal ischemia or in equivocal cases, is an associated partial vertebral body infarction at the affected level. Spinal ischemia and partial vertebral body infarction result from the proximal occlusion of a spinal vessel that distributes branches to the affected half of the vertebral body as well as a segmental branch to the spinal cord (i.e., a radiculomedullary artery or even the anterior radicular artery (see Anatomy ▶ above). The vertebral body infarction is best demonstrated in a fat-suppressed T2w sequence (STIR), which should therefore be included in the protocol for suspected spinal ischemia.
Tips and Tricks
A vertebral body infarction in the setting of acute spinal ischemia is a useful corroborative sign that can support a presumptive diagnosis of ischemia. Thus it can aid in differentiating spinal ischemia from other diseases that produce long segmental changes in the spinal cord.
Another potentially useful sign is intraosseous disk herniation, which may point to fibrocartilaginous embolism as the cause of ischemia. Because aortic pathologies are the most frequent etiology of spinal ischemia, sagittal image interpretation should include an evaluation of the aorta whenever possible to ensure that a long segmental aortic dissection is not missed. A correspondingly large field of view should be used, at least in one survey sequence. A more precise technique for the detection of underlying aortic disease is CT angiography (CTA). Conventional catheter-based angiography may also be appropriate in selected cases.
Subacute spinal ischemia The infarcted area becomes more sharply demarcated over time, and swelling subsides to a degree. The sharp demarcation creates an “owl’s eye” or “sideways 8” pattern in the axial T2w image (see ▶ Fig. 15.2 and ▶ Fig. 15.3). A less common occurrence is hemorrhagic imbibition or intralesional hemorrhage, producing a relatively hyperintense signal in the unenhanced T1w sequence and a hypointense signal in the T2*w sequence ( ▶ Fig. 15.5). Analogous to cerebral ischemic infarctions, spinal ischemia in the subacute stage (i.e., at approximately 1 week) shows disruption of the blood–brain barrier, which appears as an enhancing rim around the infarcted area (see ▶ Fig. 15.3). This pattern persists for several weeks and then fades. In many cases the enhancement at the infarction site is accompanied by enhancement of the anterior cauda equina following ischemia at the thoracolumbar junction. The pathogenic mechanism of this blood–brain barrier disruption is not fully understood. The most likely hypothesis is the occurrence of barrier disruption between the nerve root and blood with associated Wallerian degeneration and reactive hyperemia. Enhancement of the cauda equina then develops later than the barrier disruption at the actual infarction site and persists for longer.

Fig. 15.5 Spinal ischemia with secondary hemorrhage in a 49-year-old woman with chest pain of sudden onset followed by rapidly progressive quadriparesis. A T2w image acquired 24 hours after symptom onset (a) shows the typical appearance of acute spinal ischemia: an elongated, central, predominantly anterior hyperintensity of the spinal cord. Five days later the patient experienced secondary deterioration with quadriplegia. Follow-up MRI (b–d) shows secondary bloody imbibition of the infarction with increasing swelling.
(a) Sagittal T2w image 24 hours after symptom onset. (b) Sagittal T2w image 6 days after symptom onset. The hemorrhagic areas in the spinal cord (arrows) are faintly hypointense. (c) Sagittal T1w image 6 days after symptom onset. The hemorrhagic areas (arrows) appear hyperintense. (d) Sagittal T2*w image 6 days after symptom onset. The hemorrhagic areas (arrows) appear markedly hypointense.
Chronic spinal ischemia With passage of time, spinal ischemia results in some atrophy of the affected spinal cord segment and presents as a sharply circumscribed defect, often with an owl’s-eye appearance. This area is markedly hyperintense in T2w sequences, hypointense in T1w sequences, and does not show contrast enhancement (see ▶ Fig. 15.2).
Treatment and prognosis Treatment at present consists of supportive measures such as blood pressure surveillance and rehabilitation. Currently, no real therapeutic option is available following the onset of spinal ischemia. The prognosis depends largely on the initial clinical deficit. When outcomes were assessed in one large case series, approximately 70% of the patients were able to walk independently or with assistance, 20% required a wheelchair, and 9% died.
Differential diagnosis The clinical differential diagnosis of spinal ischemia consists mainly of acute transverse myelitis and intramedullary hemorrhage. The following differential diagnoses should be considered at imaging:
Transverse myelitis (infectious, parainfectious, autoimmune-related, or “idiopathic”): This is a very difficult radiologic differential diagnosis because the MRI appearance of transverse myelitis closely resembles that of spinal ischemia. Transverse myelitis also involves the central portion of the spinal cord but, unlike spinal ischemia, usually affects more than two-thirds of its cross-section. Also, the craniocaudal extent of transverse myelitis tends to be somewhat longer, usually spanning three to four segments. Diffuse contrast enhancement is typically observed. Transverse myelitis usually has a subacute symptom onset and progresses somewhat more slowly than spinal ischemia. Pleocytosis is found on examination of the cerebrospinal fluid (CSF).
Venous congestion due to a ▶ spinal dural arteriovenous fistula: Alternate terms are “venous infarction” and “congestive myelopathy.” The spinal cord lesions caused by venous congestion usually involve a longer portion of the cord than arterial ischemia (more than three segments). In most cases the congested perimedullary veins appear as multiple small “black dots” on T2w images, which represent vascular flow voids. In some cases, however, the imaging of a dural arteriovenous fistula will not show prominent veins, and the cord lesion will be the only demonstrable sign of venous congestion. Differentiation from arterial ischemia in these cases may be very difficult based purely on MRI findings. Again, the clinical presentation is usually helpful owing to the relatively slow progression of venous congestion.
Intramedullary tumors: Intramedullary tumors (especially “pencil gliomas”) may also exhibit features similar to ischemia. But most cases of this kind are distinguished by marked expansion of the spinal cord, predominantly focal and intense enhancement, as well as tumor cysts and/or a tumor-associated syrinx with adjacent edema.
Demyelinating diseases: Examples are ▶ multiple sclerosis, acute disseminated encephalomyelitis ( ▶ ADEM), and ▶ neuromyelitis optica. These diseases predominantly affect younger patients. Multiple sclerosis plaques are not typically located at the center of the spinal cord but along the lateral side of its convexity and generally span no more than two segments. Neuromyelitis optica, on the other hand, has a greater craniocaudal extent (usually affecting more than three levels). Differentiation in questionable cases is aided by the clinical presentation, CSF findings, and the detection of possible associated cerebral lesions on cranial MRI.
Pitfall
It is difficult or impossible to distinguish between acute spinal ischemia and transverse myelitis based on MRI findings alone. Differentiation is aided by the clinical presentation and CSF findings.
15.2 Spinal Hemorrhage
Analogous to intracranial hemorrhages, we can classify spinal hemorrhages as epidural, subdural (actually epiarachnoid), subarachnoid, or intramedullary based on the affected intraspinal compartment. The anatomy of the ▶ spinal meninges and the compartments defined by them is reviewed in ▶ Fig. 15.6.

Fig. 15.6 Spinal meninges and the compartments bounded by them. Diagrammatic representation. The subarachnoid space (5) contains the spinal cord, nerve roots, and the connective-tissue attachments that pass through the subarachnoid space from the spinal cord to the dura (10, dark gray) and suspend the cord within the spinal column. The thicker lateral fibrous strips are the denticulate ligaments, and the slightly prominent posterior septa are the posterior subarachnoid septa (dark gray, unnumbered).
1 = Arachnoid (light blue)
2 = Dura mater (dark gray)
3 = Epidural space, filled with epidural fat (light blue)
4 = Potential subdural space between the dura mater and arachnoid, which are directly apposed to each other
5 = Subarachnoid space
6 = Ventral horn
7 = Dorsal horn
8 = Dorsal root
9 = Ventral root
10 = Spinous process
11 = Vertebral body
MRI findings Generally speaking, the various types of spinal hemorrhage are not fundamentally different in their MRI signal characteristics. The morphology of the hemorrhage is the main imaging criterion used for this differentiation.
Note
Different types of spinal hemorrhage do not differ significantly in their sequence- or time-dependent MRI signal characteristics, but they do differ in their imaging morphology.
Regardless of the affected segment, spinal hemorrhages show the following sequence- and time-dependent signal characteristics, which result from the changing content of blood breakdown products over time (see also Table 2.1):
Hyperacute intraspinal hemorrhage (<12 hours old): This hemorrhage is iso- to hypointense on T1w images and hyperintense on T2w images (based on intracellular oxyhemoglobin).
Acute intraspinal hemorrhage (1–3 days old): This hemorrhage is isointense to slightly hypointense in T1w sequences and shows incipient hypointensity in T2w sequences (due to conversion to deoxyhemoglobin and continued clot formation).
Intraspinal hemorrhage in the early subacute stage (3–5 days old): Hemorrhage at this stage is very hyperintense on T1w images and hypointense on T2w images (due to intracellular methemaglobin).
Intraspinal hemorrhage in the lateral subacute stage (1–2 weeks old): Hemorrhage at this stage shows high signal intensity in T1w and T2w sequences (due to now-extracellular methemaglobin after the destruction of red cells).
Chronic intraspinal hemorrhage (>2 weeks old): A chronic hemorrhage is hypointense on T1w images and particularly on T2w images (due to hemosiderin and ferritin in macrophages).
Spinal hemorrhages are at least partially hypointense on T2*w images at an early stage, depending on their deoxyhemoglobin content. As oxyhemoglobin increases, so does the hypointense component. Thus, these sequences can help distinguish a hemorrhage from other lesions and should be included in the MRI protocol whenever a spinal hemorrhage is suspected.
Other imaging modalities MRI is the imaging modality of choice for a suspected spinal hemorrhage, but other modalities may be appropriate in selected cases or if there is an absolute contraindication to MRI. Unenhanced CT generally displays larger spinal hemorrhages as hyperdense masses localized to the affected compartment. Myelography with postmyelographic CT can help define the relationship of the hemorrhage to the affected compartment (epidural versus subdural) in questionable cases. It is also useful in patients with postoperative foreign material (screws, etc.) that would cause serious artifacts on MRI. Conventional selective digital subtraction angiography (DSA) of the spinal vessels would be indicated in cases where a spinal vascular malformation is the suspected source of the hemorrhage.
15.2.1 Epidural Spinal Hemorrhage
Definition Spinal epidural hematomas form when extravasated blood collects in the epidural space between the dura mater and the periosteum of the spinal canal. This space is normally occupied by fatty tissue and the epidural venous plexus.
Epidemiology Spinal epidural hematomas are the most common type of intraspinal hemorrhage. They occur with an estimated incidence of approximately 0.1:100,000 population per year, with an approximately 4:1 preponderance of males over females. Although spinal epidural hematomas may occur at any age, they show a bimodal distribution with one peak in childhood and a second peak in the fifth and sixth decades.
Pathology and etiology Unlike most intracranial epidural hematomas, which result from arterial bleeding, spinal epidural hematomas are typically caused by bleeding from the venous plexuses located in the epidural space. Most have an iatrogenic (e.g., surgery or lumbar puncture) or traumatic etiology; even relatively minor trauma may cause a spinal epidural hematoma. “Spontaneous” epidural hematomas may occur in the setting of coagulopathy or anticoagulant therapy. Epidural hematomas can also result from events that raise the intra-abdominal venous pressure (e.g., Valsalva maneuver, vigorous coughing, pregnancy). Tears in epidural veins caused by intervertebral disk herniations are another potential cause of spinal epidural hematoma. Vascular malformations, on the other hand, are an extremely rare cause of spinal epidural hematoma. In approximately 40 to 50% of cases, a specific cause cannot be identified.
Clinical manifestations Spinal epidural hematomas lead to variable compression of the dural sac, spinal cord, and/or cauda equina depending on their location and extent. As a result they present clinically with acute, excruciating back pain (“coup de poignard”), which may radiate in a radicular pattern, and with progressive transverse cord symptoms below the affected level consisting of sensory and/or motor deficits, bladder and bowel dysfunction, and even para- or quadriplegia.
MRI findings In addition to the sequence- and time-dependent signal changes that are typical of ▶ spinal hemorrhage, spinal epidural hematoma presents the following specific MRI characteristics:
Most spinal epidural hematomas occur at a posterior, posterolateral or lateral site in the spinal canal ( ▶ Fig. 15.7). Occurrence at an anterior site or about the circumference of the spinal canal is less common ( ▶ Fig. 15.8, ▶ Fig. 15.9) because the dura is bound anteriorly by irregular connective-tissue attachments (Trolard membrane) to the posterior longitudinal ligament (see ▶ Fig. 15.6).
Spinal epidural hematomas generally extend over more than one vertebral body level (rarely more than three levels) and occur predominantly in the thoracic, thoracolumbar, or lumbar region in adults. Cervicothoracic extension is more commonly found in children. Sagittal images are particularly useful in these cases for defining the full craniocaudal extent of the hematoma.
Spinal epidural hematomas typically have a (bi)convex shape. They are broadly apposed to the posterior surface of the vertebral body and form a convex bulge that impresses on the dural sac (see ▶ Fig. 15.7, ▶ Fig. 15.8, ▶ Fig. 15.9).
Axial images are particularly helpful in differentiating between epidural hematoma and subdural spinal hematoma (see ▶ Fig. 15.7, ▶ Fig. 15.8, ▶ Fig. 15.9). The dura generally appears as a well-defined hypointense line on T2w images. Its spatial relationship to the hematoma—i.e., its displacement away from the vertebral arch or vertebral body toward the central spinal canal—aids in localizing the hematoma to a specific compartment.
Besides the dura, T2w sequences may also demonstrate linear hypointense structures within a spinal epidural hematoma. They represent epidural connective-tissue septa.
The spatial relationship of the hematoma to the epidural fat is another important aid for localizing the hematoma. A spinal epidural hematoma occupies the same compartment as the fat plane and may even bleed into that tissue. Unlike a subdural hematoma, then, typically an epidural fat plane is no longer visible between the hematoma and the posterior vertebral margin or dura in the affected area (see ▶ Fig. 15.8, ▶ Fig. 15.9).
A hyperacute spinal epidural hematoma in particular may be difficult or impossible to recognize in T2w sequences because its hyperintense signal is roughly isointense to fat and CSF. Detection may be aided by T1w sequences, in which the low signal intensity of spinal epidural hematoma contrasts better with hyperintense fat, and in T2*w sequences, in which the hematoma shows hypointense components earlier than in T2w sequences.
Spinal epidural hematoma in the subacute stage is very hyperintense in T1w sequences. This makes it difficult to distinguish from epidural fat, which is also hyperintense. Differentiation is aided by fat-saturated T1w imaging, which suppresses the fat signal and brings out the hematoma. Epidural fat at adjacent levels abuts the spinal epidural hematoma superiorly and inferiorly, and this “capping” effect is clearly displayed in sagittal sections.
If the spinal epidural hematoma causes significant cord compression, associated cord edema may develop. It is best demonstrated as a hyperintense area in T2w sequences.
Contrast-enhanced T1w sequences will usually show enhancement of the adjacent dura as evidence of reactive hyperemia (see ▶ Fig. 15.9).
In patients with hyperacute (still active) bleeding, postcontrast images may show focal, punctate, or nodular enhancement within an acute spinal epidural hematoma. This finding signifies active contrast extravasation and is comparable to the “spot sign” of acute intracranial bleeding seen on CTA. Because spinal hemorrhages are relatively rare, however, no systematic studies have yet been done on the significance of this finding within the overall context.
Sites of linear enhancement is or around a spinal epidural hematoma may represent epidural septa or blood vessels in the epidural space.
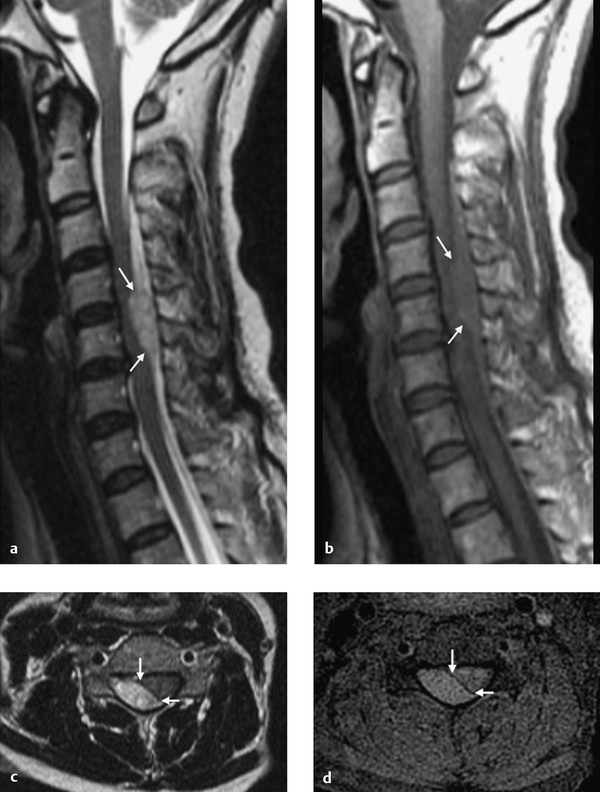
Fig. 15.7 Acute spinal epidural hematoma in the acute stage. This 52-year-old woman presented with excruciating back pain of sudden onset accompanied by hemiparesis on the right side. MRI performed 15 hours after symptom onset shows an acute spinal epidural hematoma located in the posterior spinal epidural space and bulging anteriorly to impinge on the cord (a–d, arrows). The hematoma is still predominantly hyperintense in the T2w images (a,c) with incipient hypointense areas. It appears isointense in the T1w images (b,d). The axial images clearly depict the dura as a hypointense line (c,d arrows), aiding localization of the hematoma to the epidural space.
(a) Sagittal T2w image. (b) Sagittal T1w image. (c) Axial T2w image. (d) Axial fat-suppressed T1w image.

Fig. 15.8 Acute spinal epidural hematoma in the anterior part of the spinal canal. The 70-year-old woman had suffered previous pathologic compression fractures of the L1 and L3 vertebral bodies due to an unknown primary tumor. She presented now with an incomplete sensorimotor transverse cord syndrome. MRI shows an acute spinal epidural hematoma extending from the T9 to L1 levels in the anterior part of the spinal canal. The hematoma most likely developed as a result of thrombocytopathy. The dura appears as a hypointense line in the sagittal and axial images (a–c, solid arrows). The sagittal T1w image (b) shows absence of epidural fat between the posterior vertebral margin and hematoma in the affected area. The hyperintense epidural fat is visible at lower levels (b,c, dotted arrows).
(a) Sagittal T2w image. (b) Sagittal T1w image. (c) Axial T1w image.

Fig. 15.9 Spinal epidural hematoma in the early subacute stage. This 54-year-old woman experienced acute onset of severe lower back pain 5 days earlier. MRI shows a spinal epidural hematoma in the early subacute stage. It is relatively hypointense in the T2w image (a, arrows) and hyperintense in the T2w image (b, arrows). Images after contrast administration show marked enhancement of the adjacent dura (c,d, arrows), most likely due to reactive hyperemia.
(a) Sagittal T2w image. (b) Sagittal T1w image before contrast administration. (c) Sagittal T1w image after contrast administration. (d) Axial T1w image after contrast administration.
Treatment and prognosis Marked neurologic deficits or acute or progressive transverse cord symptoms are an indication for surgical decompression by laminectomy and hematoma evacuation. Neurologic symptoms may be fully or only partially reversible with this procedure, depending on the initial severity of symptoms and the time interval to treatment. The timing of decompression is especially critical in patients with a complete cord lesion and should be no later than 36 hours after symptom onset. Conservative management with pain therapy, steroids, and possible pharmacologic treatment for a causal coagulation disorder is an option for patients who present initially with mild neurologic symptoms and/or show rapid, spontaneous clinical improvement. These patients generally have a good prognosis. The reported overall mortality rate of spinal epidural hematomas is approximately 6%.
Differential diagnosis With regard to MRI morphology, the following lesions in particular should be included in the differential diagnosis:
Subdural (epiarachnoid) spinal hematoma: Epidural and subdural ▶ spinal hematomas can be distinguished in principle by their typical respective morphologies. In practice, however, they may be difficult or impossible to distinguish even on close analysis of the MR images, especially in cases with extensive hemorrhage. Probability may be the only guide in cases of this kind: Epidural hematomas are considerably more common than the rare, purely subdural hematomas. Subdural and epidural hematomas may coexist, however, and this should be considered during image interpretation.
Epidural abscess: Epidural abscess can be difficult to distinguish from (hyper)acute spinal epidural hematoma based on MRI alone, because at this stage both lesions are largely isointense in T1w sequences and hyperintense in T2w sequences. But the clinical presentation of an abscess is usually less peracute than that of spinal epidural hematoma. Moreover, epidural abscess is frequently associated with systemic inflammatory signs and fever. Unlike spinal epidural hematomas, most epidural abscesses are located in the anterior part of the spinal canal. They show intense peripheral rim enhancement, which may be accompanied by diffuse central enhancement. Often there is evidence of associated spondylodiskitis.
Herniated, protruding, or sequestered disk: Intervertebral disk material in the epidural space that is isointense in T1w sequences and iso- to hypointense in T2w sequences can mimic a small, acute spinal epidural hematoma. The clinical presentation may also be very similar. Moreover, disk herniations may cause tearing of epidural veins, leading to a secondary spinal epidural hematoma. This may greater hamper differentiation in some cases, especially if there is a relatively hyperintense sequestered disk. In most cases, however, the disk material can be positively identified by its isointensity to the parent disk and by concurrent degenerative changes in the adjacent disk space.
Epidural tumor growth (e.g., lymphoma or metastasis): Epidural tumors typically show more intense enhancement and often involve the adjacent vertebral body or paravertebral soft tissues.
Epidural lipomatosis: Epidural fat is fairly prominent in most individuals, especially at the thoracic level. “Excessive” epidural fat, which may exert a local mass effect on the dural sac, is termed “epidural lipomatosis.” It can mimic a subacute stage of spinal epidural hematoma. Differentiation is aided by an absence of acute clinical manifestations and by fat-saturated MRI sequences.
Pitfall
It may be difficult or impossible to distinguish between epidural and subdural spinal hemorrhage in any given case, especially with extensive hematomas that do not display the morphologic features characteristic of both types.
15.2.2 Subdural (Epiarachnoid) Spinal Hemorrhage
Definition Subdural spinal hematoma results from bleeding into the subdural space (or more accurately, the epiarachnoid space), i.e., the space between the dura mater and arachnoid.
Epidemiology Subdural spinal hematomas are considerably rarer than epidural spinal hematomas. In a meta-analysis of over 600 patients with intraspinal hemorrhage, only 4.1% had a subdural spinal hematoma. Precise incidence data are not available, however. No sex predilection for subdural spinal hematoma has been found. Like to epidural hematoma, subdural spinal hematoma may occur at any age, but most published cases have been in the 45 to 60 year age range.
Pathology and etiology Subdural spinal hematomas usually have similar etiologies to epidural hemorrhages: trauma, coagulopathies, anticoagulant therapy, and iatrogenic causes (e.g., spinal surgery, lumbar puncture, or spinal anesthesia, especially in patients with a preexisting bleeding diathesis). Rare causes are tumors or spinal vascular malformations. But as with epidural hematomas, the precise etiology of subdural hematomas is not discovered in a significant percentage of cases. As for the pathogenic mechanism underlying subdural spinal hematoma, traumatic cases most likely result from tears of the inner dural layer or tears of the valveless radiculomedullary veins that run through the subdural and subarachnoid space.
Clinical manifestations Like epidural hematomas, subdural spinal hematomas may cause compression of the dural sac, spinal cord, and/or cauda equina depending on their location and extent. Thus, the clinical presentation is very similar to that of spinal epidural hematomas: acute back pain and nuchal pain, which may show a radicular pattern; transverse cord symptoms with sensory and/or motor deficits (paraparesis or quadriparesis); and bladder and bowel dysfunction. Headache and meningism may also occur, resulting in a clinical presentation that may resemble an acute subarachnoid hemorrhage.
MRI findings In addition to the sequence- and time-dependent signal characteristics of ▶ spinal hemorrhage described earlier, spinal subdural hematoma presents the following specific MRI characteristics:
Spinal subdural hematoma may be located in the anterior, posterolateral, or lateral portion of the spinal canal, or it may be distributed about the circumference of the canal.
It typically extends over multiple vertebral body levels and is most commonly located in the thoracolumbar, lumbar, or lumbosacral region; cervical occurrence is less common. The full craniocaudal extent of the hematoma is best demonstrated in sagittal images ( ▶ Fig. 15.10).
Axial images are essential for differentiating between subdural and epidural spinal hematoma. T2w images in particular will clearly depict the dura as a hypointense line. This is an excellent view for establishing the sub- or intradural location of a spinal subdural hematoma. Axial images will sometimes show a three-pointed “Mercedes star” sign caused by partial compartmentalization of the spinal subdural hematoma by the lateral denticulate ligaments or posterior subarachnoid septum ( ▶ Fig. 15.11; see also ▶ Fig. 15.6 and ▶ Fig. 15.10). These structures represent connective-tissue bands or septa that pass through the subarachnoid space from the spinal cord and attach to the dura. They often appear as signal voids in a spinal subdural hematoma; this produces the characteristic three-pointed-star shape in axial section.
The above connective-tissue structures, adhesions, and rebleeding may give spinal subdural hematomas a very inhomogeneous and multilobulated appearance (see ▶ Fig. 15.11).
As with epidural hematomas, the spatial relationship of the subdural spinal hematoma to the epidural fat is another useful localizing sign: In T1w images of spinal subdural hematoma, the epidural fat between the hematoma and adjacent bony structures is generally well demarcated from the hematoma, in contrast to epidural spinal hematoma (see ▶ Fig. 15.10, ▶ Fig. 15.11).
Hyperacute spinal subdural hematomas in particular may be difficult or impossible to discern in T2w and T1w sequences because they are isointense to CSF. Differentiation in these cases is aided by T2*w images, in which the hematoma shows hypointense components earlier than in T2w sequences. In questionable cases, it may be helpful to obtain unenhanced CT scans (to detect a hyperdense intraspinal mass) and/or a CISS sequence, which usually shows the hematoma as somewhat more inhomogeneous and hypointense than CSF and may give better visualization of septa and adhesions.
In the subacute stage of spinal subdural hematoma, on the other hand, fat-saturated T1w images are best for differentiating the T1-hyperintense hematoma from epidural fat.
Postcontrast images may show variable enhancement of the hematoma and adjacent dura, which are then difficult to distinguish from an abscess.
Spinal subdural hematoma impinging on the spinal cord may cause associated cord edema, which is best demonstrated as increased signal intensity in T2w sequences.

Fig. 15.10 Spinal subdural hematoma in the late subacute stage. A 70-year-old woman on anticoagulant medication presented with a 10-day-old spinal subdural hematoma, which appears hyperintense in the T2w and T1w images. The spatial relationship of the hematoma to the epidural fat, visible as very hyperintense tissue posterior to the hematoma on the sagittal T1w image (b, dotted arrows) and axial T2w image (c, dotted arrow), localizes the hematoma to the subdural space. Axial T2w images are also very good for demonstrating intradural location, as they clearly depict the dura as a very hyperintense linear structure (c, arrows). Spread of the hematoma is limited medially by the posterior subarachnoid septum (c, d, arrowheads).
(a) Sagittal T2w image. (b) Sagittal T1w image. (c) Axial T2w image. (d) Axial fat-saturated T1w image.
Related posts:

Stay updated, free articles. Join our Telegram channel


Full access? Get Clinical Tree


