Vascular Response to Hypoxia and Hypercapnia
Daniel P. Bulte
Molly G. Bright
Franklyn A. Howe
Douglas R. Corfield
The Gases of Life
Oxygen, for aerobic respiration, is a fundamental requirement of most organisms. For humans and other lung breathers, this requires regular, frequent breaths of fresh air. Inhalation of oxygen is coupled with the exhalation of carbon dioxide, the waste product of the aerobic metabolic process. The rate at which we need to exchange oxygen and carbon dioxide differs from the next most essential necessity, water, by over three orders of magnitude. It is for this reason that all complex animal life forms have developed highly sophisticated and sensitive physiologic mechanisms for maintaining the balance of oxygen and carbon dioxide in their organs, tissues, and fluids. Any deviation from the narrow window of acceptable levels of either oxygen or carbon dioxide will cause a cascade of reactions, chemical, biological, physiologic, and even psychological, to restore the balance as quickly as possible. The failure of any of these processes is an indication of serious disease or injury.
The level of sensitivity our biologic systems have to these gases is therefore a window into their function. The presence of pathology can be deduced from alterations in the oxygen or carbon dioxide levels. Alternately, by deliberately altering the levels in a controlled manner, the effectiveness of a wide range of physiology can be tested or information can be obtained about the normal function of myriad organs and systems.
Often hypoxia and hypercapnia will occur simultaneously as a result of insufficient ventilation; a deliberate breath-hold and sleep apnea are examples when this might occur. Exposure to reduced partial pressure of oxygen (PO2), such as will occur at high altitudes, will result in an increase in ventilation in an attempt to inspire sufficient oxygen, and this hyperventilation will induce hypocapnia.
Effect of Hypoxia on Blood Flow and Volume
The normal, healthy oxygenation levels vary greatly around the body, ranging from 150 mm Hg in the upper airway to as low as 5 mm Hg in the retina. Thus the precise level of oxygen tension considered to be hypoxic differs among organs, however, most tissues trigger a hypoxia response below a venous PO2 of 40 mm Hg.1 A number of disease states such as sleep-disordered breathing, obstructive sleep apnea (OSA), and heart failure, along with other cardiorespiratory conditions, are associated with reduced levels of arterial oxygen (hypoxia). Hypoxia can also be caused by environmental conditions such as high altitude. It is important to distinguish between acute, intermittent, and chronic hypoxia, as the biologic responses evolve over time, such as hematocrit changes and pulmonary hypertension.2
Arterial chemoreceptors in the carotid and aortic bodies are the most important sensory organs for hypoxia, and they respond to decreases in PO2, rather than oxygen (O2) content or saturation.2 Hence, the arterial chemoreceptors can respond to such brief periods of intermittent hypoxia as can occur during OSA. The reflex response of arterial chemoreceptor stimulation includes ventilatory and cardiovascular responses, so intermittent hypoxia can contribute to hypertension in OSA.2 Intermittent hypoxia exposure in the absence of any other comorbidity causes hypertension, endothelial dysfunction, and augmented constrictor sensitivity, all owing at least in part to increased vascular oxidative stress.3
One of the vascular changes reported in studies of OSA is diminished endothelial function, including decreased endothelium-dependent vasodilation in skeletal and cerebral resistance arteries and in cremaster arterioles in intermittent hypoxia–exposed rats.3 Measures of vascular reactivity in human studies consistently show OSA-related abnormalities including hypoxia-induced impaired dilation, exacerbation of atherosclerosis, and impaired cerebral autoregulation. Epidemiologic studies show significant independent associations between OSA and hypertension, coronary artery disease, arrhythmias, heart failure, and stroke.3
It is well known that the cerebral circulation is sensitive to changes in arterial blood gas tensions; hypercapnia and hypoxia both, independently, increase cerebral blood flow (CBF). There is therefore a close link between the regulation of breathing and the regulation of CBF. Hypoxia is of clinical significance because the brain is particularly vulnerable to the effects of low oxygen.4 CBF increases in response to moderate and severe hypoxia; the response to mild hypoxia is more equivocal.5 Relatively little is known about the regional responses of the cerebral circulation to these stimuli. Nevertheless, any differences in such responses can be significant because they could determine the relative degree of
protection afforded to different brain areas in response to such insults.
protection afforded to different brain areas in response to such insults.
Regional Cerebral Perfusion
Considerable information on cerebral perfusion has been obtained using blood oxygenation level–dependent (BOLD) functional magnetic resonance imaging (fMRI). The change in the BOLD signal can be used as a marker of the change in regional brain perfusion that accompanies changes in brain activity.6 Nevertheless, the relation between the BOLD T2* signal and brain perfusion is not straightforward; local changes in the signal will reflect changes in both local hemoglobin saturation and local blood volume.7 The relation to local blood flow will further depend on the rate of oxygen extraction in the local tissues.
Other MRI approaches offer more direct measurements of local cerebral perfusion. In particular, arterial spin labeling (ASL) methods allow repeated and noninvasive determination of the CBF or perfusion changes (see Chapter 15). ASL determines brain perfusion by monitoring the delivery of magnetically labeled blood to a region of interest.
Regional Cerebrovascular Response to Hypoxia
A limited number of studies have used perfusion-sensitive MRI to investigate the CBF response to hypoxia. Some studies suggest that the response to hypoxia can be uniform across the brain, and others indicate some inhomogeneity. It is not clear whether these studies have fully accounted for the confounding effects of changes in arterial partial pressure of carbon dioxide (PCO2) on CBF, which, if uncontrolled, will accompany the hypoxic stimulus.8
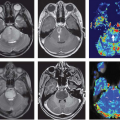
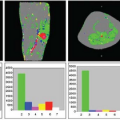
Nöth et al.9 determined quantitative CBF maps of cortical gray matter with pulsed ASL. From these gray matter CBF maps, cerebrovascular reactivity maps to isocapnic hypoxia were calculated showing the regional distribution of the cerebrovascular reactivity (Fig. 77.1). Cerebrovascular reactivity maps of isocapnic hypoxia showed very high intrasubject variation, some gray matter regions exhibiting positive, others negative, cerebrovascular reactivity. Seventy percent of subjects showed overall positive cerebrovascular reactivity and the remaining 30% showed overall negative cerebrovascular reactivity (Fig. 77.2) with a 10% decrease in arterial oxygen saturation; cerebrovascular reactivity to isocapnic hypoxia resulted in a 10.7% ± 2.5% increase in CBF in positive and 9.0% ± 2.6% decrease in negative responders.
The high variability in hypoxic cerebrovascular reactivity among subjects could be a result of conflicting physiologic effects caused by hypoxia, such as vasodilatation and vasoconstriction. With low-level hypoxia, both effects compete, resulting in either an increase or a decrease in CBF in single subjects depending on the overall dominant physiologic effect in the person studied. Also within individual subjects, there is a high variability in hypoxic cerebrovascular reactivity in gray matter; in some areas, it is positive, possibly indicating predominantly vasodilatation, and in other regions it is negative, indicating a vasoconstriction. At greater levels of hypoxia, the vasodilator effect appears to dominate, resulting in an increase in CBF. A vasoconstrictor effect of hypoxia that appears to be state dependent has been observed; this effect is prominent during slow wave sleep10 and in the morning on awakening.11
 FIGURE 77.1. (A) Quantitative gray matter cerebral blood flow maps from a single subject under isocapnia (ic) and isocapnic hypoxia (hx). Values are percentages of change in cerebral blood flow per millimeters of mercury increase in partial end-tidal carbon dioxide. (B) Quantitative map of cerebrovascular reactivity (CVR) to hypoxia for the same subject as in (A). Values are percentage of change in cerebral blood flow per 10% decrease in arterial hemoglobin oxygen saturation (SaO2). Note both positive and negative values for cerebrovascular reactivity are present across the region. (Modified from Nöth et al.9) |
 FIGURE 77.2. Gray matter cerebral blood flow values (CVR) for individual subjects under isocapnia (ic) and hypoxia (hx). Positive and negative responders are shown with black and blue lines, respectively. The group mean plus or minus cerebral blood flow (GM-CBF) values for all subjects (including both positive and negative responders) are also indicated. SaO2, arterial hemoglobin oxygen saturation. (Modified from Nöth et al.9) |
Binks et al.12 determined regional differences in the cerebrovascular response to moderate isocapnic hypoxia in cortical and subcortical gray matter using positron emission tomography (PET). They reported that generally regions of interest with higher baseline perfusion exhibited increased responses to hypoxia. Interestingly, cortical gray matter showed below average increases in response to hypoxia, and phylogenetically older regions of the brain (including the putamen, brainstem, thalamus, caudate nucleus, nucleus accumbens, and pallidum) tended to show larger vascular responses.
These studies strongly indicate that there are marked differences in the cerebrovascular responses to hypoxia, within and between brain regions and across subjects. The underlying reasons for these differences remain unclear but could well determine the pathophysiologic responses to hypoxia and the degree of detriment to brain tissue. Hypoxia has also been directly used as an endogenous, intravascular contrast agent for measuring cerebral blood volume (CBV).13 Shen et al.14 investigated the effects of hypoxia on the changes in CBV during functional activation.
Correlation and interactions between global vascular changes as a result of hypoxia and local neurally related vascular changes are a challenge in functional imaging studies. Nevertheless, with appropriate study design, such respiratory-related confounds can be successfully accounted for.
Hypoxia is a state where tissues are unable to undergo normal oxidative processes because of a failure in the supply or use of oxygen. Hypoxia can be grouped into four types86:
Hypoxic hypoxia: Hypoxic hypoxia is defined as an inadequate PO2 in arterial blood.
Anemic hypoxia: In the presence of severe anemia, the oxygen content will fall in proportion to the reduction in hemoglobin concentration, even though the PO2 is normal.
Circulatory or stagnant hypoxia: If circulatory failure occurs, even though the oxygen content of arterial blood may be adequate, delivery to the tissues is not.
Histotoxic hypoxia: The situation where cellular metabolic processes are impaired to prevent oxygen use by the cells, even though oxygen delivery to the tissues is normal.
Effect of Hypercapnia on Blood Flow and Volume
Carbon dioxide is the universal “waste product” of aerobic cellular respiration, produced by all aerobic life forms.15 The vasculature functions to remove waste carbon dioxide (CO2) while simultaneously supplying tissue with additional oxygen to ensure metabolism continues smoothly. But cells are not the only source of CO2 in our bodies; the air we breathe and the manner by which we breathe it can drastically alter the level of CO2 in the bloodstream. Complex chemical and molecular processes react to these fluctuations in arterial CO2 levels, affecting vascular tone and perfusion. Through understanding of these processes and imaging the effect on the blood supply, we will be better able to diagnose, prognose, and treat conditions related to vascular regulation.
Effects of Carbon Dioxide on the Vasculature
Once produced in the cells, CO2 diffuses along the local concentration gradient, exits the cells, enters the extracellular fluid, and finally moves into the blood plasma and the red blood cells. The CO2 molecules are not easily stored and transported in their original form; instead, they react with water to form bicarbonate ions that are easily dissolved in the blood plasma for removal:
The rate of H2CO3 (carbonic acid) creation is normally quite slow in plasma, but the red blood cells contain an enzyme—carbonic anhydrase—that dramatically
accelerates this process. The red blood cells can be thought of as traveling factories that enhance the transformation of diffusing CO2 into bicarbonate and hydrogen ions, helping this waste product get flushed into the bloodstream.
accelerates this process. The red blood cells can be thought of as traveling factories that enhance the transformation of diffusing CO2 into bicarbonate and hydrogen ions, helping this waste product get flushed into the bloodstream.
Nevertheless, these processes are not without consequences. The end products, bicarbonate and hydrogen ions, alter the local pH, and the altered pH initiates multiple signaling pathways related to vasodilation or vasoconstriction of the local blood vessels.16 This was shown clearly by Kontos et al.,17 who observed that arterioles in anesthetized cats responded to changes in extracellular pH. This phenomenon occurred regardless of the local concentration of CO2, showing that pH is the vasoactive factor in hyper- or hypocapnia. Also, although CO2 can diffuse passively through the cell membrane, bicarbonate ions cannot. This suggests that the extracellular pH might be more important that intracellular pH, although the two are closely related.
Although hypercapnia vasodilates and hypocapnia vasoconstricts vessels throughout the body, the specific underlying molecular processes are likely to vary greatly. For example, large cerebral arteries do not show the direct pH effect on delayed rectifier potassium channels or calcium potassium channels observed elsewhere, possibly reflecting regional differences in the distribution of these channels. This observation suggests that imagers should be careful to consider this anatomical or physiologic heterogeneity when mapping the vascular response to hypercapnia or hypocapnia.
What Causes Hypercapnia?
Because the gases in the alveoli in the lungs and the gases in the blood are coupled, deviations from “normal” breathing will have an effect on systemic arterial CO2 content. There are numerous conditions and pathologies that affect respiration. Chronic obstructive pulmonary disease, emphysema, bronchitis, asthma, and other diseases that cause shortness of breath or dyspnea can result in hypercapnia because of the reduced exchange of gases in the lungs. Hypercapnia can also be caused by the rebreathing of expired air or by pauses in ventilation during sleep apnea. Hypocapnia can be caused by hyperventilation, which can occur during mechanical ventilation in the clinic or as an early symptom of cardiac and pulmonary disorders. Air pollutants, obesity, smoking, and muscular disorders can also have consequences on respiration, and countless pharmaceutical agents can also modulate breathing.
Altering arterial CO2 tensions affects the blood flow being supplied to organs, which can lead to secondary consequences of hyper- or hypocapnia. For example, hyperventilation causes hypocapnia, which reduces blood flow via vasoconstriction, and this could lead to symptoms such as dizziness, feeling faint, and even syncope. Conversely, although hypercapnia causes increased perfusion owing to vasodilation, the underlying hypoventilation can also cause hypoxia, which could threaten the oxygen supply of all organs despite elevated blood flow. Hyper- and hypocapnia can also alter basal neural metabolism, causing general neural depression or excitation.18
Despite these challenging consequences of altered CO2 levels, it is sometimes clinically useful to prescribe hyper- or hypocapnia in certain patient groups. In patients suffering from hemorrhagic stroke, hypocapnia and global vasoconstriction can limit bleeding, but in patients experiencing ischemia, a hypercapnia challenge can improve blood flow to threatened tissues. CO2 can be used to augment cerebral perfusion during carotid endarterectomy or hasten the emergence from a coma following general anaesthesia.15 As described later, it can also be beneficial to apply hyper- and hypocapnia challenges to assess vascular responsiveness and to better understand disease pathology.
How to Administer a Hypercapnia Challenge
In order to administer a hypercapnia challenge, it is essential to have a method for measuring the effect of the challenge on the arterial blood gas tensions of the patient. The most precise and accurate measurement would be through direct arterial blood gas sampling, which involves inserting a catheter directly into an artery (whereas blood samples are usually taken from a vein). The differences in the pressure and vessel wall thickness between veins and arteries means that this method is quite invasive and painful; it also comes with some significant contraindications and risks and can only be performed by an appropriately trained medical professional. Therefore, it is not desirable for most experimental or even clinical settings. Instead, end-tidal partial pressures (PET) are used as surrogates for the arterial partial pressures. The end-tidal values represent the averaging of alveolar gas levels, and researchers have shown good agreement between the end-tidal and arterial gas levels.19
There are two primary methods for changing a patient’s blood gas levels that have distinct advantages and disadvantages. One option is to fit a patient with a facemask or nasal cannula connected to an altered gas supply. The patient is not required to perform any additional tasks, and depending on the specifics of the inspired gas, he or she may not even be aware that the challenge is occurring. This method offers good control and repeatability of the CO2 challenge across subjects and is therefore very appealing for studies interested in quantitative measurements. For even greater fine control, in instances when subjects exhibit irregular or inconsistent breathing patterns, sophisticated feedback mechanisms can tailor the gas content on a breath-by-breath basis to maintain stable target PETCO2.20
Inspired gas challenges have numerous undesirable characteristics. The face mask and associated tubing can be difficult to comfortably arrange in the MRI scanner environment, and there is added resistance to breathing inherent in the mask and filter system, which can increase the feeling of claustrophobia or anxiety. Although gas-delivery methods can easily achieve high levels of hypercapnia, this is often associated with subject discomfort. Inhalation of 7% CO2 is reported to create sensations of “air hunger” and resistance to breathing in healthy subjects.21 In the authors’ experience, subjects switch from feeling comfortable to feeling uncomfortable at an individual threshold point, typically between 4% and 5% inspired CO2 levels.
It is nearly impossible to cause hypocapnia using gas inhalation methods; normal air typically contains less than 0.05% CO2, and reducing this to 0% has little effect on the blood gas tensions of the subject. Instead, hypocapnia can be achieved via hyperventilation.22 However, this requires long periods of subject compliance and endurance to sustain stable levels of decreased partial pressure of arterial carbon dioxide (PaCO2). Breathing rate and depth must both be kept stable, which usually requires additional practice such as periodic cueing for every breath.
Prolonged hyperventilation falls into the second category of hyper- or hypocapnia challenges: self-directed respiratory challenges, such as breath-holds and deep breathing. These techniques can be preferable in patients or environments where prolonged challenges are difficult to perform. Breath-holds have been successfully used to measure CO2 reactivity in children, the elderly, and patients with cerebrovascular disease, and the results have shown good agreement with results obtained via CO2 inhalation.23
Altering the local blood volume and blood flow via these breathing challenges directly changes the local concentration of deoxygenated hemoglobin, which can be measured using BOLD fMRI. The specifics of breath-hold execution (which leads to hypercapnia) determine the magnitude and dynamics of the BOLD signal response. By beginning the breath-hold after inspiration, which can make the challenge easier to perform, the BOLD signal response is biphasic: an initial decrease in signal (caused by preparatory mild hyperventilation) precedes the expected signal increase related to the hypercapnia-induced CBF increase.24 The amplitude of the peak signal is also greatly dependent on the depth of the preparatory inhalation.24 Similarly, the hypocapnia BOLD response to deep breaths is also observed to be biphasic.25
For optimized repeatability of a hypercapnic breath-hold, it is best to begin the breath-hold following expiration: following normal exhalation, the lungs return to the state of “functional reserve capacity,” which may be a more repeatable starting point than inhaling to a variable degree.26 The baseline breathing rate and depth are also key determinants of the breath-hold-induced BOLD signal change amplitude: self-pacing techniques have been compared with externally paced cueing methods,27 and the latter leads to greater BOLD signal change amplitudes with less intertrial variability.26 The most important element in the breath-hold challenge is how the subject resumes normal breathing: it is crucial that the subject exhales, however slightly, before taking recovery breaths. This provides the most accurate measure of the change in PETCO2 caused by the challenge, which can vary greatly among subjects and across repeated trials and is critical for robust reactivity characterization.28 Vascular reactivity is typically quantified as the percentage change in either CBF or BOLD signal per millimeter of mercury change in PETCO2.
Mapping Cerebrovascular Reactivity to Carbon Dioxide
The use of advanced imaging techniques has revealed that the vascular response to hypo- and hypercapnia is not uniform throughout the brain, even in young, healthy individuals. This healthy variability needs to be understood and characterized to identify truly abnormal or pathologic reactivity.
Using BOLD fMRI, Kastrup et al.29 revealed greatest cerebrovascular reactivity (CVR) in the visual cortex and cerebellum, indicating the greatest responsiveness in the occipital and temporal cortices. In a study of normal CO2 fluctuations, the occipital, temporal, and posterior parietal cortices have also been indicated as areas with greater CVR relative to other cortical or subcortical regions.30 All of these studies observed larger responses in gray matter than in white matter.
Challenge-dependent dynamics of the BOLD fMRI reactivity response to PaCO2 have also been observed.31 The flow response to the onset of hypocapnia is rapid, while the return to baseline following cessation of hypocapnia is very prolonged (described by the time constants 6.8 seconds and 14.3 seconds, respectively). This is in contrast to the flow response to hypercapnia challenges, which is more gradual following the onset of the challenge and rapid in the return to baseline values (time constants of 45.3 seconds and 6.1 seconds, respectively).
Because the blood-flow response to mild hypercapnia challenges does not plateau until 10s of minutes or even hours after the start of a challenge,32 many researchers have moved toward using shorter challenges with the understanding that steady-state values are not being achieved. Studies have explored the dynamics of these transient responses to breath-hold hypercapnia challenges and cued deep breathing hypocapnia challenges.25 These studies indicate that there is regional heterogeneity in the timing of the BOLD response to CO2 challenges that is consistent across healthy subjects, reflecting vascular territories as well as more local variations.
Clinical Applications of Carbon Dioxide Reactivity
Measurements of vascular reactivity to carbon dioxide in patients can provide clinicians with relevant diagnostic and prognostic information in various diseases conditions throughout the body. Changes in the vascular supply to diseased livers have been characterized using CO2 challenges in rodents,33 and normal CO2 vascular reactivity in the liver and kidneys of humans has been successfully measured using quantitative changes in MRI relaxation times during hypercapnia.34
The majority of research has focused on the measurement of cerebrovascular reactivity (CVR) in patients with cerebrovascular diseases. The blood-flow velocity response to a range of graded hypo- and hypercapnia is significantly diminished in carotid artery stenosis, and there is an association between reduced reactivity and low-flow–induced infarctions or transient ischemic attacks.35 CVR measurements can even determine the appropriateness of surgical interventions to open occluded vessels and initiate reperfusion. These procedures carry a risk of future ischemic events owing to microemboli released into the downstream vasculature, and impaired CVR has been shown to correlate with the level of risk that a patient with severe stenosis will go on to experience an ischemic event.36
Ischemia, stenosis, and stroke, which are associated with CVR impairment, are most common in older populations who might have several comorbid disorders that could affect the measurements. In studies of normal aging, the hyper- and hypocapnia blood-flow responses are observed to be attenuated, possibly as a result of arteriole rarefaction or mild hypertension, atherosclerosis, and the resulting impairment in vessel compliance that is frequently observed in older populations. A study of children (aged 7 to 12 years) and young adults (aged 18 to 29 years) observed larger BOLD reactivity to hypercapnia in the child population,37 although another study comparing young adults (aged 22 to 31 years) and elderly adults (aged 54 to 82 years) measured larger BOLD reactivity in the young adults.38 This suggests that the effect of age on CO2 CVR can be present throughout the lifespan of many. There is also evidence that suggests that CVR can be impaired in some individuals with diabetes, which can be a confounding factor when using hypercapnia for fMRI.39
Is BOLD fMRI the best way to look at local reactivity in these subjects? Recent works suggest that it might be the current frontrunner: BOLD CVR measurements are in good agreement with transcranial Doppler ultrasound measurements in patients with severe carotid artery stenosis,40 while offering more spatially specific diagnostic information. In a comparison of BOLD CVR during hypercapnia and single-photon emission computed tomography CVR during acetazolamide administration, Shiino et al.41 showed consistent identification of areas with vascular impairment using the two techniques, even suggesting that the BOLD data were more directly interpretable by radiologists. It has been shown that CVR as measured using BOLD fMRI is well correlated to CVR as measured using ASL,42 although the units of signal change are different for the two measures. Because ASL is a more pure measure of blood flow changes, it could be that, if available, ASL would be a better method in comparison with BOLD. Nevertheless, because BOLD sequences are more common and more easily analyzed than ASL data, in addition to BOLD achieving a higher signal-to-noise ratio, BOLD MRI might still be the preferred means of measuring CVR. Hopefully, with further developments in calibrated BOLD methods (described in the next section), more quantitative and robust measurements can be achieved across the broad spectrum of patient groups where reactivity is of interest.
Implications for Functional Brain Imaging Studies
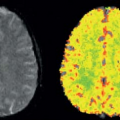
Neuronal activation studies using functional brain imaging are problematic when the task or stimulus is associated with any changes in the arterial blood gases: any change in arterial blood gases will change global brain blood flow so that the local neurally related changes in CBF are correlated with the global changes (Fig. 77.3). In
such circumstances, it is therefore not possible to uniquely assign the change in local perfusion to being of neural origin.
such circumstances, it is therefore not possible to uniquely assign the change in local perfusion to being of neural origin.
Related posts:
 Dose Considerations in CT Perfusion
 Confounding Effects in Arterial Spin Labeling
 Arterial Spin Labeling Acquisition Protocols
 Pediatric Stroke and Congenital Disease
 Clinical Applications of Dynamic Contrast-Enhanced Magnetic Resonance Imaging in Musculoskeletal Tumors
 Perfusion and Dynamic Contrast-Enhanced Imaging in White Matter Disease
Stay updated, free articles. Join our Telegram channel

Full access? Get Clinical Tree


