Vascular-Space-Occupancy Magnetic Resonance Imaging
Jun Hua
Ying Cheng
Peter C.M. van Zijl
Vascular-space-occupancy (VASO) magnetic resonance imaging (MRI) is a noninvasive technique that allows measurement of relative changes in cerebral blood volume (CBV, defined as the combination of arterioles, capillaries, and venules) in the brain. VASO MRI employs a spatially nonselective inversion recovery MRI pulse sequence preparation to eliminate the blood signal, resulting in an image that reflects the volume of extravascular tissue, which is then used to infer CBV changes. This preparation can be combined with commonly used MRI detection pulse sequences, such as gradient-echo (GE) echo-planar imaging (EPI), fast spin echo (FSE), gradient spin echo (GraSE), and more recently fast gradient-echo sequence. When properly implemented, the VASO contrast is predominantly sensitized to CBV changes, but it may also be affected by several other factors, such as cerebral blood flow (CBF), blood oxygen–level dependent (BOLD) effects, cerebrospinal fluid (CSF), and inflow effects. Using paramagnetic contrast agents, the VASO approach allows quantification of absolute CBV values in physiologic units (milliliter of blood per 100 mL of tissue) by comparing VASO signals before and after contrast agent injection. This approach exploits the fact that paramagnetic contrast agents significantly shorten the blood T1 relaxation time. More recently, an inflow-based VASO (iVASO) method was introduced, which is capable of measuring arterial CBV (CBVa, including arteries and arterioles) changes and absolute CBVa values in the brain without needing a contrast agent. With a proper design, iVASO can detect predominantly arteriolar CBV. VASO MRI has been used in a number of studies assessing CBV changes in normal brains during physiologic and functional stimulations, such as visual, motor, and short-term breathhold tasks. When performed in conjunction with BOLD and arterial spin labeling (ASL) MRI, quantitative information for changes in oxygen extraction fraction (OEF) and cerebral metabolic rate of oxygen (CMRO2) can be obtained. This multimodal approach has been employed to investigate the mechanism of BOLD effects, such as the physiologic origins of the BOLD poststimulus undershoot. VASO MRI has also been used in several functional MRI studies in neuroscience, such as retinotopic mapping and cognitive task experiments. In recent years, VASO MRI has been adopted to study vascular abnormalities in various diseases, such as brain tumors, carotid artery disease, and Alzheimer’s disease.
In 2003, VASO MRI was introduced by Lu and van Zijl as a technique that enables measurement of relative changes in CBV in human brains without exogenous contrast agents.1 Since then, it has become a useful functional MRI (fMRI) approach complementary to the BOLD fMRI and CBF-based ASL fMRI. Compared with the widely used BOLD fMRI, the CBV-weighted VASO fMRI signal changes have been shown to be more localized in middle cortical layers where microvessel density and stimulus-evoked neural activity are the greatest.2 Recently, the VASO method has been cross-validated with positron emission tomography (PET) CBV measurements3 in humans. VASO fMRI has been used in neuroscience studies, such as retinotopic mapping4 and cognitive task experiments.5 It has also been applied in conjunction with BOLD and ASL fMRI to quantify oxygen metabolic changes in the brain and to elucidate the physiologic origins of fMRI signals and the underlying neurovascular coupling mechanisms.6,7,8 The original VASO approach has been expanded by Lu et al.9 for absolute quantification of CBV, by Hua et al.10,11 to detect arterial/arteriolar CBV changes, and by Hua et al.12,13 and Donahue et al.14,15 (independently) for measurement of absolute arterial/arteriolar CBV. The ability to quantify these parameters in physiologic units significantly increases the value of VASO MRI, especially for longitudinal and cross-sectional clinical studies. Apart from the fMRI applications in normal brains, VASO MRI has been adopted to study vascular abnormalities in various diseases, including brain tumors,16,17 carotid artery disease,15,18 leukoaraiosis,19 and Alzheimer’s disease.20 As a young technique, its applications have been mainly useful in research settings thus far, but, as discussed later, VASO MRI, which provides quantitative information on one of the vital physiologic parameters in the brain, is on the brink of being applied clinically.
This chapter discusses the basic principles of VASO MRI, the commonly used MRI pulse sequences, the theory for CBV quantification, its pitfalls and solutions, and its applications in neuroscience and brain diseases. Recent reviews by Lu et al.21,22 are of particular interest for more detailed discussions on the complex theoretical and technical aspects of VASO MRI.
Like many scientific discoveries, the invention of VASO MRI was a serendipitous occurrence. The original experiments were designed to investigate extravascular BOLD effect by zeroing out the blood signal (blood nulling) with inversion recovery MRI. However, instead of an expected increase of BOLD signal, Lu and van Zijl21 detected a slightly decreased fMRI signal during neural activity. They then realized that the blood-nulling approach allowed visualization of the effect from CBV change during neural activity, which counteracts with the BOLD effect. In their subsequent experiments, they used very short echo time (TE) to suppress the BOLD effect, which eventually led to the invention of VASO MRI for CBV measurement.
VASO MRI: Measurement of Relative CBV Change
Basic Principles
VASO MRI employs a spatially nonselective inversion recovery sequence and an optimal waiting time (inversion time, TI) to eliminate the blood signal, resulting in an MR image that reflects the volume of extravascular tissue. Figure 79.1 shows the basic MRI pulse sequence for VASO MRI. A radiofrequency (RF) pulse is applied to invert the longitudinal magnetization of water spins, after which the inverted magnetization returns exponentially to equilibrium with the longitudinal relaxation time constant T1. Because T1 relaxation differs between blood and tissue, the times at which their magnetizations cross zero differ. The MR signal, S, in this sequence is proportional to the remaining longitudinal magnetization, Mz, at TI given by:
where TR is the MRI scan repetition time that can be adjusted experimentally. Thus, with known blood T1-relaxation time values, an optimal TI can be calculated for each chosen TR using Eq. 1 to null the blood signal while keeping sufficient tissue magnetization for MRI detection. At the blood-nulling TI, the only measurable MR signal is from extravascular tissue, which is proportional to 1-CBV. It is important to notice that when CBV increases during functional stimulation, a larger fraction of the voxel is nulled and, therefore, a signal decrease is observed. Note also that when the inversion pulse is spatially nonselective using a large coil (e.g., body coil on a typical clinical scanner), the signal is insensitive to any inflow-related fresh blood effects. In addition, the echo time (TE) should be kept as short as possible to minimize the oxygenation-based (T2/T2* weighted) BOLD effect during functional stimulation. These technical details are discussed in Geek Box 1.
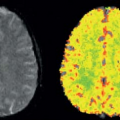
VASO fMRI is commonly employed for the detection of regional CBV-related changes in the brain. Figure 79.2 shows a typical VASO image with the activated voxels highlighted and its corresponding hemodynamic response time course during a visual stimulation paradigm. To quantify ΔCBV from ΔS/S (see Eq. 4), a priori knowledge of baseline CBV (CBVbase) and water densities of blood and parenchyma is needed. More recently, several approaches have been proposed to use VASO MRI for absolute quantification of CBV. These methods are discussed later.
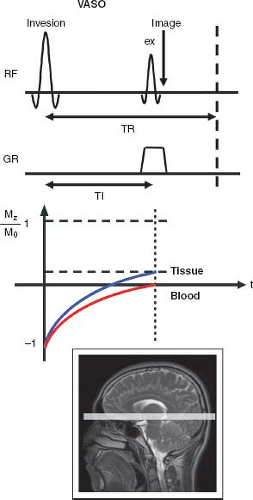 FIGURE 79.1. Schematic illustration of the Vascular-Space-Occupancy pulse sequence. The blue and red curves illustrate the relaxation of tissue and blood signals (normalized magnetization Mz /M0), respectively, as a function of time (t). The black rectangle outside the field of view of the image at the bottom represents a spatially nonselective inversion, while the shaded light-gray rectangle inside the image indicates the imaging slice. ex, excitation pulse (start of image acquisition); RF, radiofrequency pulse; GR, gradient pulse played along the slice-select direction. |
Blood Nulling and Blood T1 Values
One critical requirement for VASO MRI is to properly null the blood signal. For an inversion recovery sequence, this relies on an accurate measurement of blood T1. Lu et al.1,23 has conducted ex vivo experiments on blood samples under controlled physiologic conditions (oxygenation, temperature, pH, hematocrit) with a home-built blood circulation system to determine blood T1-relaxation times at 1.5T and 3T. Bovine blood was used, which is known to have hemoglobin content, erythrocyte shape and size, and water permeability similar to human blood.24 Table 79.1 summarizes blood T1-relaxation time values at multiple magnetic field strengths. Importantly,
blood T1-relaxation time values shown in Table 79.1 are relatively insensitive to oxygenation level, which allows arterial and venous blood to be nulled simultaneously. The average of arterial and venous blood T1-relaxation time values is normally used to calculate the blood-nulling TI for VASO MRI. For a typical parenchymal gray matter (GM) voxel with about 95% tissue and 5% blood, the residual blood signals in arterioles, capillaries, and venules are typically less than 0.1% of the total signal.1
blood T1-relaxation time values shown in Table 79.1 are relatively insensitive to oxygenation level, which allows arterial and venous blood to be nulled simultaneously. The average of arterial and venous blood T1-relaxation time values is normally used to calculate the blood-nulling TI for VASO MRI. For a typical parenchymal gray matter (GM) voxel with about 95% tissue and 5% blood, the residual blood signals in arterioles, capillaries, and venules are typically less than 0.1% of the total signal.1
Geek Box 1: VASO Signal Equation
The VASO signal in one voxel can be written as the sum of contributions from microvessels and pure tissue:
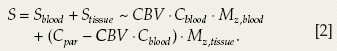
in which Cblood and Cpar are the water densities of blood and parenchyma (including blood and tissue) in milliliters of water per milliliters of blood or parenchyma, respectively. Here, Mz is defined in Eq. 1 and CBV is in the units of milliliters of blood per milliliters of parenchyma. When blood is properly nulled (i.e., Mz,blood(TI) = 0), Eq. 2 can be rewritten as:
During functional stimulation, when CBV is altered, the VASO signal change can be expressed as:
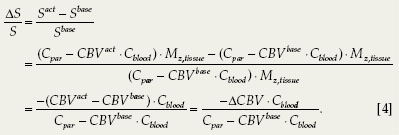
Normally, neural activities lead to microvascular vasodilation (i.e., CBVact > CBVbase). Therefore, in contrast to BOLD fMRI, a negative ΔS/S is expected for VASO fMRI. For example, a typical VASO ΔS/S during a flashing checkerboard stimulation is about −2%, representing approximately a 30% CBV increase.1
Imaging Sequences for VASO MRI
The VASO approach adds a simple inversion preparation that can in principle be combined with any MRI acquisition approach. Early single-slice VASO experiments were mostly performed with the GE EPI sequences.1,25 Poser and Norris26 proposed using the FSE, or turbo spin echo (TSE) sequence in order to reduce geometrical distortion and water–fat shift artifacts typically seen in EPI images, and to suppress the relatively large GE BOLD effects that counteract the negative VASO signal change (spin-echo BOLD effect is approximately one-third that of the extravascular GE BOLD effect; its extravascular component from macrovessels is negligible).27
Early approaches were generally limited to single slices as there is only one blood-nulling point after each inversion. They are useful for human studies that focus on a particular region in the brain, in a way similar to many optical imaging methods in animals. To be truly clinically useful, however, a multislice or three-dimensional (3D) imaging sequence with whole brain coverage is desirable. Lu et al.28 introduced a multislice technique for VASO MRI, dubbed multiple acquisitions with global
inversion cycling (MAGIC). After the first blood-nulling point following the VASO inversion pulse, a series of nonselective inversion pulses are applied periodically to invert the blood magnetization and maintain it around zero. Thus, additional blood nulling points are created so that multiple slices can be acquired within one TR. The MAGIC technique significantly increases the acquisition efficiency for VASO MRI. A typical protocol on 1.5T can achieve nine slices with TR of 6 seconds and 3.75-mm in-plane resolution.28
inversion cycling (MAGIC). After the first blood-nulling point following the VASO inversion pulse, a series of nonselective inversion pulses are applied periodically to invert the blood magnetization and maintain it around zero. Thus, additional blood nulling points are created so that multiple slices can be acquired within one TR. The MAGIC technique significantly increases the acquisition efficiency for VASO MRI. A typical protocol on 1.5T can achieve nine slices with TR of 6 seconds and 3.75-mm in-plane resolution.28
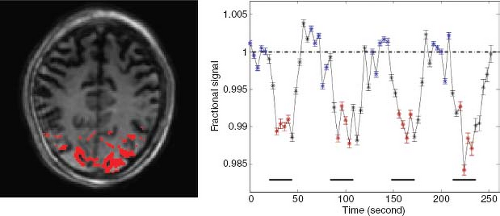 FIGURE 79.2. Typical vascular-space-occupancy (VASO) functional magnetic resonance imaging (MRI) results at 3T (visual stimulation: blue-yellow flashing checkerboard, voxel = 3 mm isotropic, TR = 2.5 seconds). The voxels that met functional activation criteria were highlighted on the VASO MRI. Average time course over all activated voxels was plotted as a function of time. The blue and red asterisks represent the time points used to calculate the signals at rest and during activation. The horizontal bars at the bottom indicate the durations of visual stimulation. The error bars show intervoxel standard deviations. |
TABLE 79.1 BLOOD T1 VALUES IN THE LITERATUREa | ||||||||||||||||||||||||
|---|---|---|---|---|---|---|---|---|---|---|---|---|---|---|---|---|---|---|---|---|---|---|---|---|
| ||||||||||||||||||||||||
The first 3D whole-brain VASO technique was introduced by Poser and Norris29 in 2008. A single-shot 3D GraSE sequence was employed to achieve 16 slices with TR of 2.5 seconds and 3.5-mm in-plane resolution at 3T. A main advantage of 3D sequences compared to multislice methods for VASO MRI is that TI is the same for all slices in 3D (assuming minimal off-resonance effects), while it is different for each slice in a multislice acquisition. Besides, in 3D sequences, lower gradient strength is required for 3D slab selection and crosstalk between adjacent slices because of imperfect slice selection is reduced. As discussed earlier, spin-echo–based sequences, such as GraSE, generally have less image distortion and smaller BOLD effect compared with GE EPI sequence. The 3D GraSE sequence has therefore become the method of choice for many studies using VASO MRI. Figure 79.3 shows typical images from the protocols that the authors have been using in the F.M. Kirby Research Center. Figure 79.3A displays representative images from 3D GraSE VASO (top) and GE EPI VASO (bottom). Notice that the signal void artifact seen in the frontal area in slice 4, caused by different magnetic susceptibility between tissue and air, is suppressed in the GraSE sequence. Figure 79.3B illustrates the typical activation maps with overlapping z-scores from single-shot 3D GraSE VASO fMRI (25 slices, TR = 6 seconds, 3-mm in-plane resolution, 3T) during a functional paradigm of simultaneous flashing checkerboard visual stimulation and bilateral finger tapping. Robust activations were found in both visual and motor cortex. Figure 79.3C demonstrates that average time courses from 3D GraSE VASO and single slice GE EPI VASO (identical location) matched well.
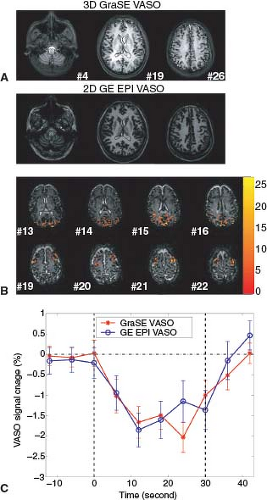 FIGURE 79.3. Three-dimensional (3D) gradient spin-echo (GraSE) vascular-space-occupancy (VASO) magnetic resonance imaging (MRI) at 3T. A: Comparison of 3D GraSE VASO and 2D multislice gradient-echo (GE) echo-planar imaging (EPI) VASO images. Three slices with matching locations were shown. Slice numbers are indicated at the right bottom corner of each 3D GraSE image. Imaging parameters: voxel = 2 × 2 × 4 mm3, 35 slices, TR = 6 seconds. B: Representative results of 3D GraSE VASO functional MRI (visual stimulation with concomitant bilateral finger tapping, voxel = 3 × 3 × 5 mm3, 25 slices, TR = 6 seconds). Voxels meeting functional activation criteria are highlighted with their statistical scores (z-scores), the scale of which is illustrated on the right. Robust activation was visible in both visual and motor cortices. C: Average time courses over all activated voxels from two matching slices with 3D GraSE (red, asterisk) and 2D GE EPI (blue, open circle) VASO MRI, respectively, are shown. The two vertical dashed lines indicate the start and cessation of functional stimulation. Time is relative to the start of stimulus. The error bars show intervoxel standard deviations. It can be seen that the cerebral blood volume dynamics measured by the two different VASO sequences matched well. |
More recently, Hua et al.30 proposed to use the 3D fast gradient-echo (fast GRE, also known as turbo field-echo or turboFLASH) sequence for VASO MRI. The main advantages of this sequence for VASO MRI are that it can achieve very short TEs (normally a few milliseconds) to further minimize BOLD contamination and uses very low flip angles (<10 degrees) to further reduce image distortion and power deposition. This is particularly useful at ultrahigh
magnetic field (>3T), where imaging sequences, such as EPI, TSE, and GraSE, suffer from increased geometrical distortion (EPI and GraSE) and higher power deposition (TSE and GraSE). Figure 79.4 shows typical 3D fast GRE VASO images (21 slices, TR = 4 seconds, and 2-mm in-plane resolution), an activation map, and the average time course from voxels meeting the activation criteria (visual stimulation), which were acquired on a 7T human MRI scanner (Philips Medical Systems, Best, The Netherlands).
magnetic field (>3T), where imaging sequences, such as EPI, TSE, and GraSE, suffer from increased geometrical distortion (EPI and GraSE) and higher power deposition (TSE and GraSE). Figure 79.4 shows typical 3D fast GRE VASO images (21 slices, TR = 4 seconds, and 2-mm in-plane resolution), an activation map, and the average time course from voxels meeting the activation criteria (visual stimulation), which were acquired on a 7T human MRI scanner (Philips Medical Systems, Best, The Netherlands).
In summary, for whole brain VASO MRI, 3D GraSE sequence for magnetic fields of 3T and lower and 3D fast GRE sequence for ultrahigh magnetic field such as 7T are recommended. As shown in previous examples, both methods can achieve comparable spatial and temporal resolution.
Signal-to-Noise Ratio in VASO MRI
VASO MRI has a relatively low signal-to-noise ratio (SNR). When using an inversion recovery (IR)-based sequence, only 10% to 20% of brain tissue signal is recovered at the blood nulling time at 3T.31 This problem becomes worse at higher magnetic fields, where the longitudinal relaxation times (T1) of blood and tissue water increase and the signal difference between tissue and blood reduces at the time of blood nulling.2 Hua et al.31 designed the magnetization transfer–enhanced VASO (MT-VASO) approach, which employs the MT effects to speed up tissue signal recovery after inversion and augment the residual tissue signal at blood-nulling TI (elaborated below), thus boosting SNR and the contrast-to-noise ratio (CNR) for VASO MRI. The MT effects enable MR detection of magnetization changes—usually induced by RF irradiation—in semisolid macromolecules through the signal changes of the bulk water pool.32 Although there are large MT effects in many brain tissues, such as GM and white matter (WM), it has been reported that blood has little MT effect because of the low concentration of semisolid macromolecules32,33—especially when using medium irradiation power (≤3 μT) and duration (≤500 milliseconds)—or a frequency offset far away from water resonance (≥40 ppm).31 Application of an MT pulse (off-resonance RF irradiation) before or after the VASO inversion pulse can be used to accelerate the recovery process for tissue magnetization, thereby obtaining a higher residual tissue signal at TI.31 As the MT effects in blood are negligible when using appropriate experimental settings, the blood-nulling TI is not affected. It has been shown that the MT-VASO approach can improve SNR and CNR for VASO fMRI by approximately 40% at 3T, while preserving the CBV sensitivity.31 This enhancement is even greater at 7T mainly due to the further convergence of blood and tissue T1, furnishing an improvement of 149% compared to conventional VASO.30
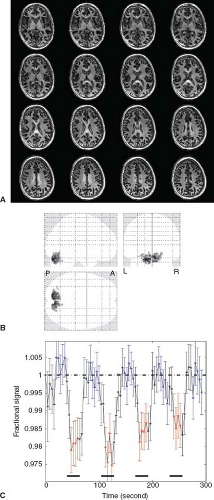 FIGURE 79.4. Three-dimensional (3D) fast gradient-echo (GRE) vascular-space-occupancy (VASO) magnetic resonance imaging (MRI) at 7T. A: Typical 3D fast GRE MT-VASO images (voxel = 2 mm isotropic, 21 slices acquired, 16 slices shown, TR = 4 seconds). B: Activation maps for functional MRI with the pulse sequence in (A) (glass brain overlay). A, anterior; P, posterior; L, left; R, right. Visual stimulation with blue-yellow flashing checkerboard was performed. C: Average time course from voxels meeting activation criteria in (B). The dark horizontal bars under the time course indicate the visual stimulation periods. Blue and red dots were used for calculating signals during baseline and stimulation, respectively. The error bars represent intervoxel standard deviations. (Reprinted from Hua J, Jones CK, Qin Q, et al. Implementation of vascular-space-occupancy MRI at 7T. Magn Reson Med. 2013;69(4):1003–1013, with permission.) |
Mechanism of VASO Contrast, Pitfalls, and Solutions
The VASO signal change reflects predominately CBV alteration. Nevertheless, similar to most in vivo MRI approaches, the VASO contrast is affected by several concomitant effects, such as CBF, BOLD, and CSF contributions as well as inflow effects and water exchange. The following sections briefly discuss the mechanisms of these effects, their influence on VASO signal, and potential solutions to alleviate and eliminate such contaminations.
Perfusion (CBF) Effects in VASO
The VASO contrast is also affected by CBF contributions, especially when short TR acquisitions are used.25 Similar to ASL (see Chapter 15), the inverted blood spins affect the extravascular tissue signal through water exchange. CBF typically increases during neuronal activation, which further reduces tissue signal and results in a VASO signal change that is larger (more negative) than expected for CBV alone. Donahue et al.25 extended the original VASO theory with the perfusion (CBF) contributions using a single-compartment model established in the ASL literature.34,35 Both numerical simulations and experimental data confirmed that such perfusion contributions are negligible for TR values longer than 5 seconds, but can be substantial for shorter TRs.25,36,37 Note that the single-compartment model assumes fast (instant) exchange between blood and tissue water. However, the average water exchange time in the capillary compartment has been reported to be 0.5 to 1 second,38,39,40 which should make the actual effect smaller within the time scale of VASO experiments. Indeed, theoretical work by Wu et al.,41 which proposed a two-compartment model with finite capillary permeability for VASO, demonstrated smaller perfusion effects (<0.1%) in VASO signals. In general, when designing VASO experiments, a TR of 5 seconds or longer is recommended for predominant CBV contrast. When shorter TR is desired for better temporal resolution, one can combine VASO with ASL MRI, so that CBF changes can be measured and taken into account when interpreting the VASO signals. Interestingly, the sensitivity for CBF also opens the possibility for simultaneous measurement of CBV and CBF by performing VASO MRI with varying TRs (vascular-space labeling).25 A more complete theoretical model, possibly with multiple compartments to characterize the water-exchange process between blood and tissue, is needed in order to quantify CBV and CBF separately in such multi-TR-VASO experiments.
BOLD Effects in VASO
During functional activation, the BOLD and VASO contrasts normally result in signal changes of opposite polarity (positive vs. negative, or vice versa).1 Therefore, the apparent VASO signal change will be reduced, which will cause an underestimation of CBV changes in the brain. Spin-echo–based MRI pulse sequences, such as TSE26 and GraSE,29 can be employed to mitigate such BOLD contamination, as the extravascular spin-echo BOLD effect is approximately one-third that of the extravascular GE BOLD effect in microvessels.27 As the BOLD signal change is mainly reflected in the alteration of transverse relaxation times (T2 or T2*), the shortest TE is usually used in VASO scans to minimize the BOLD effects. It was demonstrated that fast GRE sequences with very short TE (<2 milliseconds) have negligible residual BOLD effects.30 Furthermore, the BOLD contamination can be completely removed by acquiring images at multiple TEs and extrapolating the signal change to zero TE.42
CSF Effects in VASO
The VASO signal change can also have contributions from CSF in the brain because of partial volume effects. Numerical simulations have demonstrated that the presence of CSF in a GM voxel will lead to an overestimation of CBV changes if not accounted for.25,43 Furthermore, the volume of CSF within a voxel might change during functional activation, which will cause additional apparent VASO signal changes that are not related to CBV alterations.25,44,45,46 However, it is still not entirely clear whether local CSF volume changes occur in the cortex during neuronal activation. Several studies have reported different results: in human visual cortex, no significant change25 and 5% to 6% decrease in CSF volume from a 20 × 20 × 20 mm3 voxel44 during visual stimulation, an increase of 2% during hypercapnia,45 and most recently in cat visual cortex 2.45% CSF volume reduction during activation.46 This is an issue that requires further investigation.
Related posts:
 Dose Considerations in CT Perfusion
 Confounding Effects in Arterial Spin Labeling
 Arterial Spin Labeling Acquisition Protocols
 Pediatric Stroke and Congenital Disease
 Clinical Applications of Dynamic Contrast-Enhanced Magnetic Resonance Imaging in Musculoskeletal Tumors
 Perfusion and Dynamic Contrast-Enhanced Imaging in White Matter Disease
Stay updated, free articles. Join our Telegram channel

Full access? Get Clinical Tree


