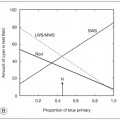
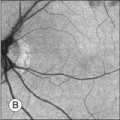
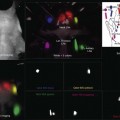
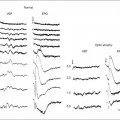
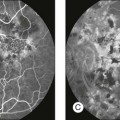
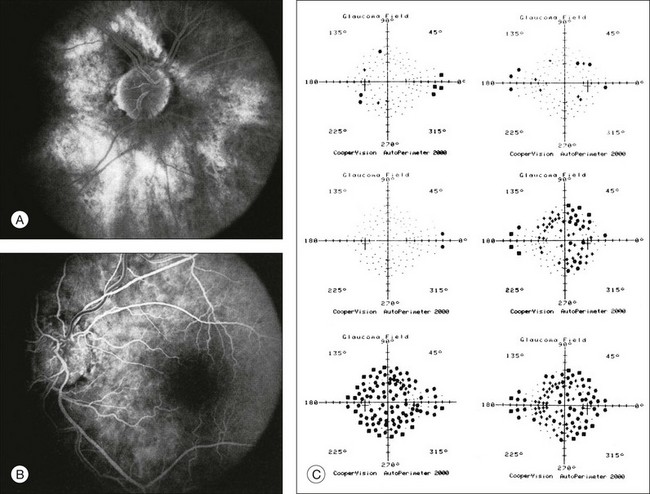
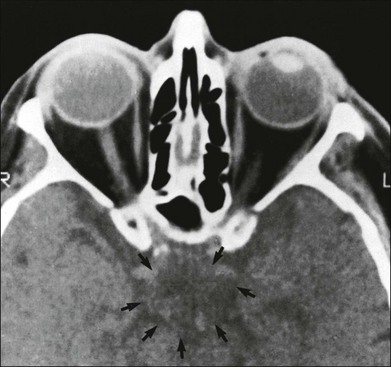
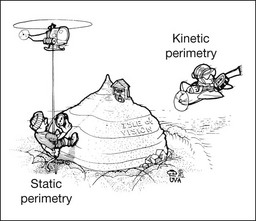
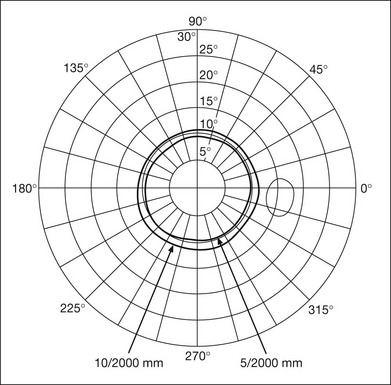
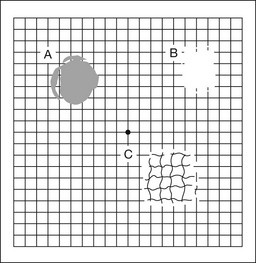
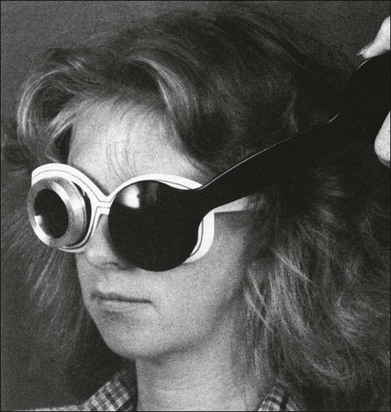
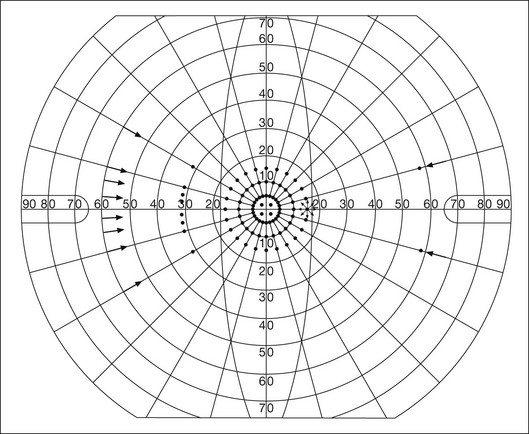
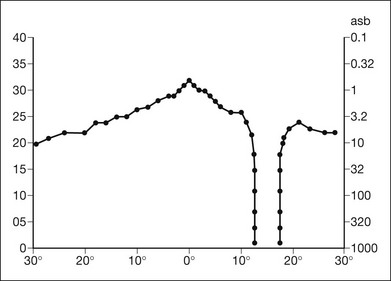
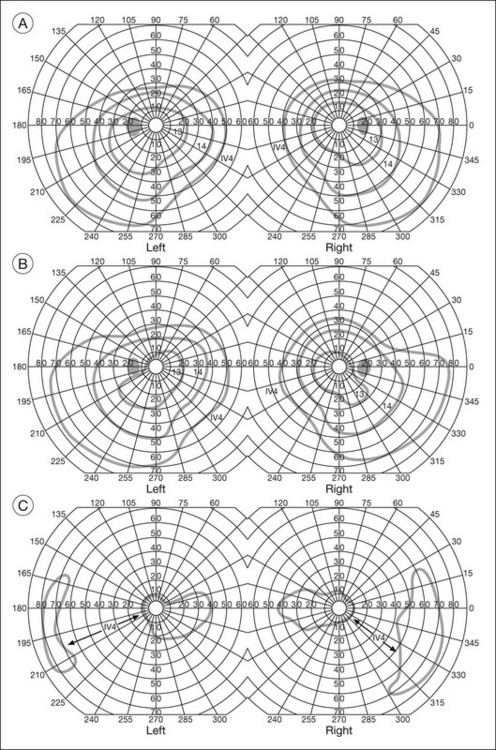
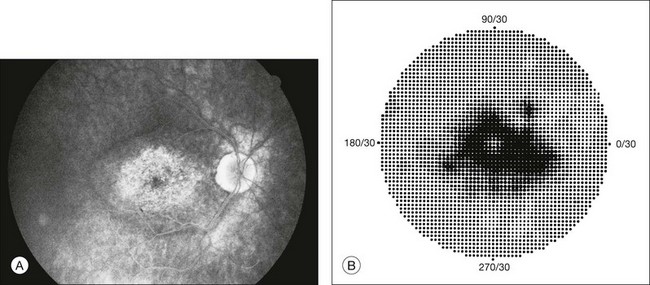
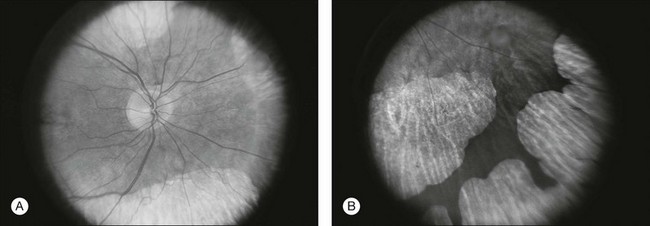
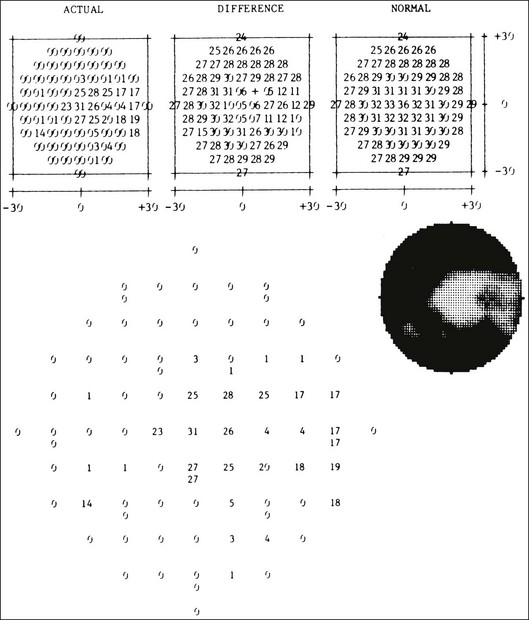
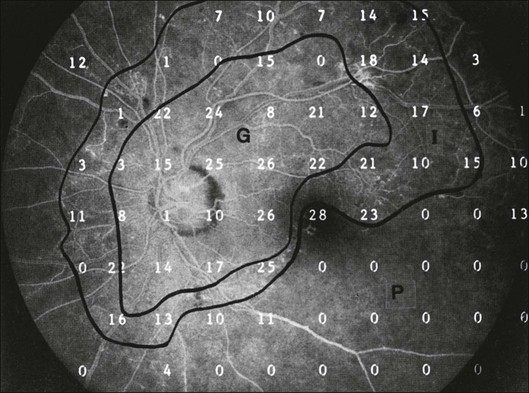
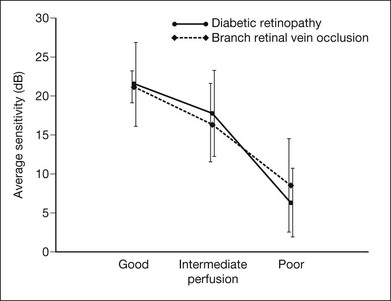
Chapter 12 One need only review the classic atlas by Dr J. Donald M. Gass1 to recognize that most retinal diseases are readily diagnosed by careful ophthalmoscopic examination. However, for the ophthalmologist to understand and document visual consequences of retinal disease, qualitative and quantitative assessment is critical. In particular, visual field testing helps with the correlation of structural changes in the retina or elsewhere in the visual pathway with deficits in function. For example, AM is a 70-year-old woman diagnosed as having an old central retinal vein occlusion (CRVO) in the left eye and surface wrinkling retinopathy in both eyes. She also had been treated for elevated intraocular pressure. Fluorescein angiography of the left eye showed shunting vessels around the optic nerve head, thought to be consistent with the old vein occlusion. However, progressive bilateral visual field loss (Fig. 12.1) over 2 years suggested the need for further investigation. A computed tomography (CT) scan demonstrated a large subfrontal meningioma compressing both optic nerves (Fig. 12.2). Fig. 12.1 (A, B) Fluorescein angiograms of a 70-year-old woman who has had progressive loss of vision in both eyes over 2 years. She has controlled ocular hypertension and surface-wrinkling retinopathy. The history of an old central retinal vein occlusion in the left eye is supported by the slightly dilated and tortuous retinal veins and the multiple shunting capillaries on the surface of the disc (B). (C) Progressive field loss, documented in both eyes over 3 years, is inconsistent with the ophthalmoscopic appearance. A computed tomographic scan was ordered, the results of which are shown in Fig. 12.2. Fig. 12.2 Computed tomographic scan from the patient described in Fig. 12.1 demonstrates a large subfrontal meningioma with bilateral optic nerve compression. Surgical resection improved sensorium but not vision. The single most important concept in understanding the visual field is depicted by the island of Traquair, which is defined as a “hill of vision” surrounded by a “sea of blindness.”2 The shape of the normal visual field is oval. There is decreasing sensitivity with increasing eccentricity in the field, as the elevation corresponds to the sensitivity of the field, and the flat plane corresponds to location within the field (Fig. 12.3). From the point of fixation, the field extends 60° superiorly, 60° nasally, 70–75° inferiorly, and 100–110° temporally. The blind spot is represented by a hole in the “hill” about 15° temporal to the foveal “peak.” Fig. 12.3 The “island,” or “hill of vision,” proposed by Traquair is surrounded by a “sea of blindness.” The height of the island represents increasing sensitivity. Using kinetic perimetry, the island is intercepted by a moving target of fixed size. Using static perimetry, a target’s visibility is increased in size or luminosity until it descends on to the island. The blind spot located 15° temporal to fixation is absolute, creating a small “well” in the sensitivity contour. (Courtesy of Steven Newman, MD.) Perimetric tests have been developed that systematically measure the level of light sensitivity in the visual field. Two basic types exist: kinetic perimetry and static perimetry. In kinetic perimetry a target is moved from outside the potentially seeing area toward the seeing area until it is detected. In static perimetry a target located within a potentially seeing area can be increased in size or intensity until it is detected. With either method a region of vision can be defined in relation to a test stimulus of given size, hue, brightness, and uniform level of background illumination. For instance, under standardized conditions, the central visual field of about 30° can be mapped with a moving white target of 3 mm at a distance of 2 meters.3 Although the tangent screen can be used quantitatively, it is most effective as a qualitative tool for estimation of visual loss in the central field. A 1-meter screen can be used to evaluate suspected midperipheral field loss, but a 2-meter screen is essential if the intent is to map central scotomata or the physiologic blind spot. The sensitivity of the test can be increased with the use of smaller test objects and by seeking subjective responses about the quality (e.g., blurry, dim, flickering, faded) of seen targets. Most important, conical visual field constriction of retinal origin can be readily distinguished from tubular fields of nonorganic visual loss by using large test objects at varying distances. With a doubling of the distance to the screen, there must be a doubling in size of the test object used. Although not routinely available or performed in a retinal specialist’s office, no other form of perimetric evaluation is as effective in discriminating real from fictitious visual field constriction (Fig. 12.4). Fig. 12.4 A tangent screen field from a hysterical or malingering patient fails to show expansion of the visual field with doubling of both test object size and distance. The Amsler grid is another extremely important qualitative tool for the evaluation of central vision. It is routinely used in regular self-monitoring of vision between eye exams by patients with macular degeneration or other progressive macular pathology to detect early signs of disease progression. In its original form, the patient fixates on the center dot of a white grid on a black background from a distance of 35.5 cm (14 inches) (Fig. 12.5). The patient describes the appearance of the grid pattern, especially in regard to missing areas (scotomata) and distortion (metamorphopsia). The sensitivity for detection of macular lesions can be increased with the use of red grids with or without the use of crossed polarizing lenses (Fig. 12.6) to decrease the light entering the patient’s eye.4 Fig. 12.5 The Amsler grid is viewed at 35.5 cm (14 inches), using the central dot for fixation. Regions of metamorphopsia (C), scotoma (B), and blur (A) are noted. Fig. 12.6 The sensitivity of the Amsler grid test can be increased by using red lines on a black background rather than black or white lines on contrasting backgrounds. Further sensitivity may be achieved by using crossed-polarizing glasses that decrease the amount of light entering the eye. (Courtesy of Alfredo Sadun, MD.) Both Goldmann and Tübinger perimetry require examiners with a high degree of training. The Goldmann visual field (GVF) perimeter uses a kinetic strategy, although static perimetry is possible (Fig. 12.7). It is especially useful for monitoring peripheral visual field loss and large scotomata. It has limited capabilities for the evaluation of small central scotomata. The Tübinger perimeter uses a static strategy. It is a sensitive but time-consuming technique for identifying small or large relative field defects once the approximate region of the field loss has been determined. Laborious Tübinger profiles are usually made only across a single meridian of the visual field, limiting its screening capabilities (Fig. 12.8). Fig. 12.7 The Goldmann visual field strategy developed by Armaly and Drance uses kinetic targets (arrows) to map the peripheral isopters and suprathreshold static targets (dots) to check central visual field function. (Reproduced with permission from Rock WJ, Drance SM, Morgan RW. Visual field screening in glaucoma. An evaluation of the Armaly technique for screening glaucomatous visual fields. Arch Ophthalmol 1973;89:287–90.) Fig. 12.8 The Tübinger perimeter produces a static profile of visual sensitivity through any chosen meridian. (Reproduced with permission from Harrington DO. The visual fields: a textbook and atlas of clinical perimetry. St Louis: Mosby, 1981.) Quantitative perimetry received a tremendous boost with the advent of automated, computerized methodology. Suprathreshold automated visual screeners, such as the Fieldmaster 101 and the Dicon units, did much to popularize visual field testing in the ophthalmic community. Pseudothreshold algorithms have been developed for these machines to enhance their quantitative capabilities.5 However, threshold perimeters, such as the Octopus and the Humphrey visual field (HVF) analyzer, have surpassed the capabilities of even the Tübinger instrument. Automated, quantitative threshold perimetry is ideal for the evaluation of retinal disease. Randomized sequences for stimulus presentation within the visual field enhance the possibility of detecting small or irregular field defects. Density of points can be varied to characterize fully field losses that are either focal or diffuse. Although the HVF has the ability to test 60° of visual field, this protocol is very time-consuming. The standard protocols used are the 30-2, 24-2, and 10-2, which measure the central 30, 24, and 10° respectively. The choice of field is based on the region of pathology in the visual field. The dash 2 (-2) refers to protocol 2, the analysis which points on either side of the vertical and horizontal meridians rather than just on the vertical and horizontal axis as performed in protocol 1. Thus, both the 24-2 and 30-2 protocols test points 3° from the horizontal and vertical axis as well as points at 6° intervals beyond this region in the central 24 or 30° respectively. A 10-2 protocol tests points 1° from the horizontal and vertical meridian as well as points at 2° beyond this region in the central 10° and thus is more sensitive for detecting subtle field losses in the macular region.6 Newer algorithms such as the Swedish interactive threshold algorithm (SITA) have been developed to increase efficiency and decrease variability in the standard Humphrey strategy. This strategy uses normative and real-time data from patients during the test to update estimates of thresholds and adjust presentation times of stimuli continually. Short-wavelength automated perimetry (SWAP) is a variant on the usual white light stimulus used in standard threshold testing. SWAP isolates the S-cone system (blue–yellow pathway), using a blue stimulus on a yellow background. Normal, age-corrected retinal sensitivity values have been established, increasing the utility in clinical testing.7,8 Care must be taken when using this technique to correct for chromatic filtering effects from the crystalline lenses.9 Longer test duration, increased variability, and learning effects make SWAP most applicable to conditions for which early detection has important therapeutic implications and requires careful supervision of the patient by the tester during visual field testing.10 In each case, the ability to map statically determined threshold retinal sensitivity directly on to the retina with automated quantitative threshold perimetry with a high degree of accuracy is important in the evaluation of retinal disease.11 This ability has further been refined by techniques such as microperimetry. However, as with any repeated test used to follow changes over time, consistency in choice of testing method is important in accurately characterizing and following the progression of retinal diseases. Microperimetry is a relatively new methodology for assessing visual fields that is especially helpful for evaluating and following macular disease. It is used to correlate anatomic pathology with function of the visual system by integrating fundus imaging and computerized threshold perimetry at specific locations in the fundus. One technique of microperimetry uses a scanning laser ophthalmoscope (SLO) (e.g., Rodenstock, Ottobrunn, Germany) to plot field defects within geographically defined regions of the retina. A modulated helium-neon laser beam of variable intensity (0–21 dB) at 633 nm projects stimuli on to the retina during ophthalmoscopy performed with an infrared diode laser at 780 nm.7,12 Another type of microperimetry is Micro Perimeter 1 (MP 1, Nidek Instruments, Padova, Italy) which uses an infrared fundus camera that provides a 45° view and performs perimetry using a liquid crystal display with a special software. The MP-1 allows for eye tracking and real-color fundus image acquisition. Images from other tests, such as fluorescein angiogram, can be overlaid on to the microperimetry, which is not possible in SLO microperimetry. Moreover, as SLO microperimetry is also restricted to red laser light, comparison with standard perimetry or MP-1 is difficult.12 Both the SLO and MP-1 microperimetry devices allow for kinetic and static perimetric testing of the macula and permit simultaneous observation of the retina during perimetric testing. Similar to conventional perimetry, stimulus sizes range from Goldmann size I to V and the central 15–20° of visual field can be tested in both devices, although the MP-1 allows for a slightly larger field for testing. Rohrschneider and colleagues determined that for patients with retinal disease both the SLO and MP-1 microperimetry devices provided comparable results, with the SLO devices providing better-resolution fundus images and the MP-1 providing better fixation analysis with more accurate real-time image alignment.13 As efforts to correlate better anatomic and functional changes in the retina have advanced, more refined devices are being developed that combine techniques of visualizing the ultrastructure of the retina, such as three-dimensional spectral optical coherence tomography (OCT) and adaptive optics, with corresponding perimetric functional assessment.14,15 Perimetric tests are being developed to screen for early changes in retinal diseases affecting the macula. Rarebit testing, or the matching of test targets to receptive field sizes, has been used in select studies in the last decade to assess central functional vision in a variety of retinal diseases. A compact rarebit screening test has been developed and tested in patients with age-related macular degeneration (AMD).16 Preferential hyperacuity perimetry (PHP) is another screening device for detecting early visual field changes in retinal disease. PHP uses the phenomenon of hyperacuity (Vernier acuity), the ability to discern differences in the spatial location of two or more stimuli, to test one’s ability to identify local distortion of a series of dotted vertical or horizontal signals. The responses are correlated to a normative database and scored to generate a probability of deviation from normal. PHP has been found to be more sensitive than Amsler grid testing for the early detection of neovascular AMD in patients with intermediate AMD. Home monitoring devices using PHP, which allow for convenient and timely early detection of progression of AMD, have been developed and are currently being evaluated for more widespread clinical use.17 Anatomic, physiologic, and psychological factors unrelated to the pathology in question can significantly affect measurement of the visual field. The nose, brow, and lid may constrict the nasal and superior fields artifactually. Numerous variables pertaining to both the patient and the environment must be controlled during testing if meaningful results are to be obtained. Even so, considerable short-term variability must be taken into account. Box 12.1 outlines a list of factors that must be controlled for optimal determination of the visual field. Perimetric testing has a degree of subjectivity and therefore ultimate reliability and repeatability of the testing rely on the patient and the test giver.18 Patients with retinal disease may be more prone to variability in testing over time, which can influence the validity of test results. Seiple and colleagues19 demonstrated that for patients with retinitis pigmentosa (RP) the results of repeated HVF testing performed at different time points were two times more variable when compared to similar fields performed in normal controls despite controlling for disease progression. Microperimetry has the added advantage of real-time retinal surface monitoring with eye tracking to correct for eye movements during testing. Weingessel and colleagues have demonstrated good interexaminer and intraexaminer reliability of microperimetry using the MP-1 device in eyes with and without retinal disease.20 Visual fields have traditionally been used to characterize and monitor the progression of visual field loss in RP. The earliest field defect in RP is reported to be a group of isolated scotomata 20–25° from fixation.3 Eventually these isolated defects coalesce into a “ring scotoma” affecting the midperiphery of the visual field. Usually the peripheral field loss progresses and leaves a small, central island of vision. Eventually, complete visual loss may occur (Fig. 12.9). Fig. 12.9 Classic development of a ring scotoma with focal sparing of a peripheral temporal island seen in retinitis pigmentosa and cone–rod dystrophies. (A) Progressive depression of peripheral visual field in a patient with cone–rod degeneration at presentation. (B) Same patient after 1 year. (C) Same patient during fourth year of follow-up. (Reproduced with permission from Krauss HR, Heckenlively JR. Visual field changes in cone–rod degenerations. Arch Ophthalmol 1982;100:1784–90.) Characterization and comparison of specific patterns of visual field loss in genotypically and phenotypically different forms of RP such as X-linked, dominant, pericentral, and Usher syndrome using GVF perimetry have been attempted to differentiate better subgroups of RP based on visual prognosis and genotype.21–23 Association of degree of visual field loss with different genotypes in syndromic associations of RP, including Bardet–Biedl syndrome 1, has also been studied.24 In addition, HVF measurements have been correlated with contrast sensitivity in RP and were found to be a sensitive predictor for central visual function in advanced RP.25,26 Visual field perimetry has been used to test outcomes of treatments for varieties of RP, including fundus albipunctatus.27 Visual fields have also been used in correlating photoreceptor anatomy and visual function in RP. Decreased retinal sensitivity on electroretinogram has been linked to visual field loss demonstrated by perimetry in RP.28 Recently, changes in GVF, HVF, and microperimetry have been correlated with anatomical changes at the cellular level using OCT and autofluorescence to identify abnormal photoreceptor morphology and damage to retinal pigment epithelial (RPE) cells.29–35 Perimetric changes occur in a variety of retinal dystrophies. Cone dystrophy produces progressive symmetric to slightly asymmetric central visual loss. This is associated with a macular pigmentary disturbance. The visual fields demonstrate central scotomata with relative sparing of the fovea (Fig. 12.10). A central or paracentral scotoma can also be seen in Stargardt disease. However, microperimetry identifies two types of scotoma in patients with Stargardt disease. In one type there is a dense ring scotoma associated with stable fixation. In the second type there is a dense central scotoma associated with fixation shift. The second type is also correlated with poorer acuity.36 In contrast, there is constriction of the visual field corresponding to the progressive peripheral retinal degeneration with scalloped margins in gyrate atrophy of the retina and choroid, a rare tapetoretinal degeneration caused by an inborn error of ornithine aminotransferase activity (Figs 12.11 and 12.12). Constricted GVF tests are also seen in Bietti crystalline dystrophy.37 Correlations between HVF sensitivity and multifocal electroretinogram (mERG) have been documented for eyes with central areolar choroidal dystrophy and North Carolina macular dystrophy.38,39 Functional changes as evidenced by perimetry and mERG have also been correlated with morphological changes documented by fundus autofluorescence in adult vitelliform macular dystrophy.40 Fig. 12.10 (A) Fluorescein angiogram of the right eye of a 54-year-old man with a 5-year history of slowly progressive loss of central vision in each eye shows marked pigmentary disturbance of the macula. The left fundus showed similar changes. Electrophysiologic testing was diagnostic of cone dystrophy. (B) Octopus perimetry (program 31) demonstrates a dense central scotoma corresponding exactly to the region of macular pigmentary change. Note the relative sparing of foveal sensitivity. Fig. 12.11 Central (A) and peripheral (B) fundus appearance of a patient with gyrate atrophy of the retina. The visual field of this patient is shown in Fig. 12.12. Fig. 12.12 Thirty-degree Octopus visual field (program 31) demonstrates marked peripheral constriction, with relative sparing in the centrocecal region. In addition, there are a few more peripheral islands of reduced sensitivity. (Reproduced with permission from Feldon SE. Computerized perimetry in selected disorders of the retina. In: Whalen WR, Spaeth GL, editors. Computerized visual fields: what they are and how to use them. Thorofare, NJ: Slack; 1985.) The diffuse retinal ischemia associated with diabetic retinopathy would seem to make visual field assessment an ideal method for follow-up of the disease. However, visual fields are not routinely used to evaluate this retinal disease, even though field defects may exist in the absence of observable retinopathy. Roth41 found central field defects in about 40% of eyes without visible retinopathy and in all diabetic patients with retinopathy. SWAP studies on patients with early diabetic maculopathy demonstrated a correlation between the decrease in mean thresholds and the increase in size of the foveal avascular zone and the perifoveal intercapillary area. These changes were not observed with standard white-on-white perimetry.42 In patients with clinically significant diabetic macular edema, Hudson and colleagues43 found all patients had abnormal SWAP 10–2 fields, but only one-third had abnormal standard perimetric fields. Further, the area of abnormal sensitivities was greater than that expected by clinical assessment. Using microperimetry, macular scotomata were also found in 74% of 19 patients with clinically significant macular edema.44 Furthermore, SWAP sensitivity in the central 10° of visual field of diabetic patients without macular edema was significantly reduced compared to standard white-on-white perimetry.45 A study of visual field defects in diabetic children without retinopathy by Mastropasqua and colleagues46 suggested that light sensitivity was impaired in the midperiphery of the visual field proportional to the degree of microalbuminuria. Once diabetic retinopathy is present, visual field loss is readily documented. Gandolfo and colleagues47 studied 85 eyes with preproliferative diabetic retinopathy using the Goldmann perimeter. They were able to identify retinal hemorrhages and exudates of at least 3–4° in diameter as localized depressions in the visual field. Macular exudation and edema caused an irregular depression and flattening of static profiles of the central field. Wisznia and colleagues48 tried to correlate the degree of retinopathy with the amount of visual field loss. They hypothesized that a correlation might exist between retinal capillary perfusion and field loss. Bell and Feldon11 used Octopus static perimetry to show that visual sensitivity is quantitatively correlated with retinal perfusion in preproliferative diabetic retinopathy (Figs 12.13 and 12.14). Utilizing standard perimetry, Federman and Lloyd49 found the degree of perfusion to be more important in predicting field loss than the amount of proliferative retinopathy. This relationship between nonperfusion and regional field loss has been confirmed in other studies as well.47,50 Fig. 12.13 Fluorescein angiogram of a patient with preproliferative diabetic retinopathy. Static sensitivities from Octopus perimetry are superimposed. Areas of good perfusion (G) have normal visual function. Areas of intermediate perfusion (I) have a moderate decrease of visual function, and nonperfused areas (P) have complete loss of visual function. (Reproduced with permission from Bell JA, Feldon SE. Retinal microangiopathy: correlation of Octopus perimetry with fluorescein angiography. Arch Ophthalmol 1984;102:1294–8.) Fig. 12.14 Average sensitivity of the retina decreases with decreasing perfusion, both for diabetic retinopathy (dots) and for branch retinal vein occlusion (diamonds). (Reproduced with permission from Bell JA, Feldon SE. Retinal microangiopathy: correlation of Octopus perimetry with fluorescein angiography. Arch Ophthalmol 1984;102:1294–8.) Lutze and Bresnick51 demonstrated a correlation between the degree of retinopathy in type I diabetic patients and visual field loss using SWAP. These findings were consistent with those of Zwas and coworkers and have been confirmed in more recent studies.9,52 In addition, automated perimetry was found to correlate better with severity of diabetic retinopathy than visual acuity.53A study by Agardh and colleagues demonstrated that SWAP sensitivity of visual field loss was correlated to ischemic changes in areas of macular edema, rather than to the severity of macular edema.54 SWAP analysis also demonstrated a greater decrease in mean sensitivity in menstruating diabetic women who were in the luteal phase, which was not seen in menstruating control patients.55 In a study by Stavrou and Wood,56 flicker perimetry appeared to be more sensitive than static perimetry in documenting early visual field changes in diabetic retinopathy, especially in a region of clinically significant diabetic macular edema. In instances of vitreous hemorrhage and tractional retinal detachment due to high-risk proliferative diabetic retinopathy, visual acuity is often dramatically improved by vitrectomy; however, severely impaired visual fields due to extensive retinal ischemia may still preclude driving.57 Moreover, the treatment of diabetic retinopathy with either panretinal or focal photocoagulation may produce visual field defects, a fact that should be considered in overall patient management.58,59 In a study by Zingirian and colleauges,60 isolated photocoagulation of diabetic retinopathy results in small scotomata that are difficult to isolate by kinetic perimetry. Confluent lesions measuring one to two disc diameters cause correspondingly sized scotomata with sloping margins. Panretinal photocoagulation produces a marked concentric contraction of the visual field. Yoon et al.61 demonstrate preservation of retinal sensitivity in central visual field after panretinal photocoagulation in diabetic patients. At 1 week after treatment, there is significant depression, but recovery of up to 95% occurred within the ensuing 3 months. They attribute these encouraging findings to the use of burn sizes of 200 µm or less, as recommended by Hulbert and Vernon.62 Using automated perimetry, an initial loss of sensitivity seen after grid laser for diabetic macular edema was seen followed by improvement.63 Hudson and colleagues64 followed 24 diabetic patients with macular edema before grid laser treatment and up to 12 weeks following treatment with microperimetry. They found correlation between the edema index and visual function in some, but not all, patients. In another study of 30 patients, 8 eyes remained stable, 15 improved mean deviation after treatment, and laser scars corresponded to marked loss of function.65 Thus, retinal sensitivity tested by microperimetry appears to increase after micropulse diode laser, but to decrease after modified Early Treatment Diabetic Retinopathy Study focal laser in eyes with clinically significant diabetic macular edema. These perimetric changes are observed even though there is no difference in visual acuity or retinal thickness after either treatment.66
Visual Fields in Retinal Disease
Principles of perimetry
Methods of visual field testing
Qualitative techniques
Quantitative techniques
Other methodologies of visual field testing in retinal disease
Reliability and reproducibility of visual field tests
Perimetry in specific retinal diseases
Retinal dystrophies
Diabetic retinopathy
![]()
Stay updated, free articles. Join our Telegram channel

Full access? Get Clinical Tree


Visual Fields in Retinal Disease