Functional magnetic resonance imaging (fMRI) is used clinically to map the visual cortex before brain surgery or other invasive treatments to achieve an optimal balance between therapeutic effect and the avoidance of postoperative vision deficits. Clinically optimized stimuli, behavioral task, analysis, and displays permit identification of cortical subregions supporting high-acuity central vision that is critical for reading and other essential visual functions. Emerging techniques such as resting-state fMRI may facilitate the use of fMRI–based vision mapping in a broader range of patients.
Key points
- •
Functional MR (fMR) can be used to map the visual cortex and identify healthy brain tissue near a site of operable brain abnormality.
- •
fMR mapping using an advanced stimulus/task paradigm permits identification of brain subregions supporting central vision that is critical for reading and other visual functions.
- •
Novel functional field map (FFMap) displays permit instant appreciation of the behavioral relevance of visual cortex activation, especially with respect to existing and treatment-induced visual field deficits.
- •
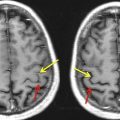
Neurovascular uncoupling (NVU) can complicate the interpretation of fMRI data, but this can be ameliorated by use of new methods to detect and map NVU.
- •
Resting-state fMRI can be used to map the visual cortex in patients who are behaviorally compromised.
Introduction
Being the most essential of our senses, the intricacy and brilliance of vision are perhaps most appreciated when compromised by damage or disease. Although a comprehensive account of the processes by which quanta of light falling on the retinae are translated into subjective visual experience is lacking, recent advances, particularly from functional neuroimaging, have allowed researchers to sketch out the functional organization of the human visual system, and thus provide a framework for understanding the sensory and perceptual effects of central vision pathology. For instance, it is now known that vision-related cortex, once thought to reside primarily in the calcarine fissure of the occipital lobe, extends throughout the entire lobe and into adjoining portions of the temporal and parietal lobes ( Fig. 1 ) and even to remote locations in the frontal lobes. Though highly interconnected, this extensive network can be subdivided into more than a dozen functionally distinct visual areas which, if selectively damaged, can result in deficits ranging from simple scotomata (localized regions of blindness) to complex agnosias and higher-order perceptual deficiencies. For the clinician, staying abreast of all these developments can be daunting and of questionable therapeutic value given their limited ability to “cure” central nervous system damage. However, there are clinical applications, such as the guidance of neurosurgery and the documentation of disease progression, for which detailed assessment of visual system involvement may be warranted to avoid potentially debilitating vision deficits. Accordingly, this article outlines some of the more clinically relevant tools developed in the last decade for mapping the human visual system, and highlights key interpretational issues and future trends.
From a clinical applications perspective, it is noteworthy that some of the earliest accounts of vision loss attributable to brain damage noted the relationship between the anatomic site of damage and the location and severity of a visual scotoma within the patient’s field of view. This perspective is reiterated today in the use of functional magnetic resonance imaging (fMRI) to provide retinotopic maps of the visual cortex potentially at risk from invasive surgical and radiation treatment of nearby brain tumors, arteriovenous malformations, or epileptic foci. fMRI is used to map eloquent neural responses evoked by sensory, motor, or cognitive tasks by measuring localized changes in the oxygenation of blood hemoglobin that are triggered by focal changes in neural activity. Although fMRI is, therefore, an indirect measure of neuronal function, it is noninvasive, well tolerated by patients, rapidly acquired in as little as 20 minutes, and can provide extensive maps of eloquent brain tissue that, if damaged, could result in a posttreatment visual deficit.
Visual mapping paradigm and analysis
Early approaches to mapping human visual cortex were as simple as turning the lights on and off, or flashing a large checkerboard. Although such stimuli can evoke activation of the visual cortex, the resulting fMRI maps do not reveal even the most rudimentary features of functional organization such as the distinction between the cortical representations of peripheral versus central vision, the latter being particularly critical for many day-to-day visual tasks such as reading. Today, more comprehensive and informative approaches are available. (For detailed reviews of methodology and the functional organization of the visual cortex, see Gill and colleagues and DeYoe and colleagues ). Mapping of visual field eccentricity and angular position using fMRI scans of approximately 4 minutes each can yield more informative cortical maps that delineate multiple, functionally distinct, visual areas and differentiate subregions supporting central versus peripheral vision. This mapping can be done efficiently through sequential display of a slowly expanding checkered annulus and a slowly rotating checkered wedge, respectively ( Fig. 2 ). The checkerboard patterns are composed of high-contrast, black and white checks that counterphase flicker at 8 Hz, resulting in strong neural activation and, subsequently, relatively large increases in the blood oxygen level dependent (BOLD) fMRI signal in visually responsive brain areas. The stimuli are presented in a temporal phase mapping sequence, meaning that locations in the visual field differing in eccentricity (distance from center of gaze) or angular (clock) position are stimulated at different times (temporal phases). Consequently, this approach uses the timing of the fMRI response to identify the location in the patient’s visual field that most strongly activates each responsive brain voxel when stimulated. Although this stimulus sequence can be viewed passively with good results, the patient can be asked to watch a small marker at the center of the video display and press a button whenever the marker briefly disappears at random intervals. The button task is advantageous in that it provides independent verification that the patient is viewing the display throughout the fMRI scan, and documents that the patient is paying attention to the stimulus. Moreover, actively attending to the visual stimulus can significantly enhance the brain response in both primary and later stage (extrastriate) visual areas. Complementary information garnered by using both the annulus and wedge stimuli yields detailed retinotopic maps of the visual cortex in addition to any focal defects resulting from abnormality.
Together, the eccentricity and angular mapping data can be used to generate a novel Functional Field Map (FFMap), which displays the brain activation in the form of a map of the patient’s visual field (see Fig. 2 ). Each circle symbol in the FFMap corresponds to a visually responsive voxel in the cortex, its position determined by the eccentricity and angle of the ring and wedge stimuli to which the voxel has responded most strongly. The color of each circle indicates the strength of the fMRI response while the size represents an estimate of the error in measuring the preferred stimulus position. For a healthy individual, the FFMap will contain circle symbols distributed throughout the visual field. However, if the visual cortex is focally damaged, symbols will be missing or less numerous within the retinotopic zone of the visual field affected by the disorder, as illustrated in Fig. 3 , which shows the FFMap from a patient with an upper left quadrant scotoma (indicated by the black area in the underlying Humphrey visual perimetry map). In sum, the FFMap provides a unique display that can instantly reveal the relationship between a cortical pattern of focal pathologic disorder and its effects on the patient’s vision.
Clinical application
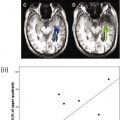
In general, the primary clinical application of fMRI vision mapping has been for presurgical planning in patients with pathologic abnormality or potential surgical involvement of the visual pathways. When resection is necessary, neurosurgeons are able to use knowledge gained from the fMRI maps to help plan an optimal approach and extent of resection that maximizes therapeutic value, yet avoids damage to neighboring eloquent cortex that may be critical for daily visual functions. Although aggressive resection of a tumor can significantly improve long-term outcome, potentially debilitating postoperative deficits can arise if neighboring eloquent cortex is damaged. Identification of eloquent brain tissue using intraoperative cortical stimulation (ICS) has traditionally been the method of choice for neurosurgeons. Consequently, several studies have compared task-based fMR (tbfMR) imaging activation with ICS maps to help establish the validity of fMRI for presurgical planning. (For reviews see Sunaert, Dimou and colleagues, and Giussani and colleagues ). fMRI maps of sensorimotor areas are generally in good agreement with ICS, although results have been more variable in language areas, possibly because of higher variation in the behavioral task activation and the more diffuse anatomy of language networks. Nevertheless, fMRI has been widely implemented for presurgical mapping of both sensorimotor and language areas. Studies comparing fMRI and ICS maps in the visual cortex have also reported good correspondence. However, for a variety of reasons fMRI vision mapping has not been used as widely in the clinic despite its potential utility (see DeYoe and colleagues ).
As the clinical use of fMRI grows, reliance on visual mapping paradigms optimized for clinical rather than research applications will also become increasingly important. Such optimization includes use of visual stimuli extending out to visual field eccentricities of 10° to 20° or more to obtain reasonably complete retinotopic maps. Use of time-efficient paradigms such as temporal phase mapping can reduce scanning time, which promotes patient compliance and permits acquisition of additional scan paradigms such as diffusion tensor imaging to map white matter tracts, and breath-hold cerebrovascular reactivity to detect hemodynamic abnormality (see the section on NVU). As already mentioned, use of a button-press task is highly recommended because it helps the physician to distinguish fMRI signals that are compromised by brain abnormality from signals compromised by poor patient compliance, sedation, or other nonspecific effects. Even so, fMR vision mapping under passive viewing conditions can successfully reveal fMRI activation when other task paradigms fail. Finally, fMR visual field mapping and the FFMap display technology have been shown to yield diagnostic information that can help to differentiate an apparent sensory deficit from higher-order perceptual problems such as hemispatial neglect.
Related posts:
 Clinical Applications of Functional MRI
 Foreword
 Blood Oxygen Level Dependent Functional Magnetic Resonance Imaging for Presurgical Planning
Technical Considerations for Functional Magnetic Resonance Imaging Analysis
Blood Oxygen Level Dependent Functional Magnetic Resonance Imaging for Presurgical Planning
Technical Considerations for Functional Magnetic Resonance Imaging Analysis
 Pretherapeutic Functional Magnetic Resonance Imaging in Children
 Applications of Blood-Oxygen-Level-Dependent Functional Magnetic Resonance Imaging and Diffusion Tensor Imaging in Epilepsy
Stay updated, free articles. Join our Telegram channel

Full access? Get Clinical Tree


