(1)
Center for Applied Geoscience, University of Tuebingen, Tuebingen, Germany
Abstract
The identification of environmental processes and mechanisms often requires information on the organochemical and inorganic composition of specimens at high spatial resolution. X-ray spectroscopy (XAS) performed in the soft X-ray range (100–2,200 eV) provides chemical speciation information for elements that are of high biogeochemical relevance such as carbon, nitrogen, and oxygen but also includes transition metals such as iron, manganese, or nickel. Synchrotron-based scanning transmission X-ray microscopy (STXM) combines XAS with high resolution mapping on the 20-nm scale. This provides two-dimensional (2D) quantitative information about the distribution of chemical species such as organic macromolecules, metals, or mineral phases within environmental samples. Furthermore, the combination of STXM with angle-scan tomography allows for three-dimensional (3D) spectromicroscopic analysis of bio-, geo-, or environmental samples. For the acquisition of STXM tomography data, the sample is rotated around an axis perpendicular to the X-ray beam. Various sample preparation approaches such as stripes cut from TEM grids or the preparation of wet cells allow for preparing environmentally relevant specimens in a dry or in a fully hydrated state for 2D and 3D STXM measurements. In this chapter we give a short overview about the principles of STXM, its application to environmental sciences, different preparation techniques, and the analysis and 3D reconstruction of STXM tomography data.
Key words
Scanning transmission (soft) X-ray microscopy (STXM)Angle-scan tomographySpectromicroscopy3D reconstructionChemical microscopyChemical tomography, Chemical nanotomography1 Introduction
1.1 Scanning Transmission (Soft) X-ray Microscopy
Scanning transmission (soft) X-ray microscopy is a combination of microscopy and X-ray absorption spectroscopy. A tens of nm to μm-thin sample is scanned in a focused X-ray beam, while transmitted X-rays are detected to generate a two-dimensional (2D) chemical map. Early developments of scanning transmission soft X-ray microscopy (STXM) were conducted in the 1980s by Kirz and Rarback [1] at the National Synchrotron Light Source (NSLS, Brookhaven, USA). In the following decades, several STXMs were installed at different synchrotron light source facilities all over the world. Currently, there are soft X-ray STXMs in operation at (alphabetical order) the Advanced Light Source (ALS, Berkeley, USA) [2], Bessy II (Berlin, Germany) [3], the Canadian Light Source (CLS, Saskatoon, Canada) [4], the Elettra Synchrotron Light Laboratory (Trieste, Italy) [5], the Photon Factory (Tsukuba, Japan), the Shanghai Synchrotron Radiation Facility (SSRF, Shanghai, China) [6], the Stanford Synchrotron Radiation Lightsource (SSRL, Stanford, USA), the Swiss Light Source (SLS, Swiss) [7], and the Ultraviolet Synchrotron Orbital Radiation Facility (Okazaki, Japan) [8]. Soft X-ray STXMs are currently under construction at the Australian Synchrotron (Melbourne, Australia), the Diamond Light Source (Harwell, UK), the National Synchrotron Radiation Research Center (Hinschu, Taiwan), the Pohang Accelerator Laboratory (PAL, Pohang, Korea), the Soleil Synchrotron (Paris, France).
A synchrotron light source is an electron accelerator wherein electrons at relativistic speed circulate in an evacuated storage ring (see Fig. 1a). Synchrotron radiation is generated tangentially to the trajectory of electrons at bending magnets or by so-called insertion devices such as undulators/wigglers, which are sequences of magnets in the straight sections of the storage ring. It consists of light with a high brilliance and photon energies that stretch from IR to hard X-ray region [9]. STXM uses a monochromatic soft X-ray beam in the energy range of 100–2,200 eV [10] and in the standard setup records photon transmission through a thin sample (tens of nm up to several μm, depending on the sample and the X-ray energy). A schematic view of an undulator-based STXM beamline in standard configuration is illustrated in Fig. 1. Soft X-rays are produced by an undulator (see Fig. 1b), which in the case of an elliptically polarized undulator (EPU) allows for full control of the polarization of the generated X-rays (linear polarization, circular left or circular right polarization) [4]. Undulator-based beamlines do not require an entrance slit since the electron-beam position in the synchrotron storage ring defines the source point of the light, whereas bend-magnet-based beamlines would require an additional entrance slit. A monochromator (see Fig. 1c) is used to select an energy range of the incident soft X-ray beam. X-ray mirrors focus the photon beam onto an exit slit (see Fig. 1d), which selects the energy spread and controls the intensity of the soft X-ray beam. A Fresnel zone plate (see Fig. 1e) focuses the soft X-ray beam onto the sample. Fresnel zone plates are radially symmetric diffraction patterns suitable to focus X-rays. Spatial resolution of the STXM (down to 10 nm reported with state-of-the-art zone plates, Tolek Tyliszczak, pers. comm. 2011) depends on the diameter of the Fresnel zone plate (typically 120–300 μm) and the width of the outermost zones as well as on the precision of the scanning/positioning system. An order-sorting aperture (OSA) (see Fig. 1f) that is located between Fresnel zone plate and sample blocks non-focused zeroth-order light. The sample (see Fig. 1g) is raster scanned by a piezo stage in the first-order focal plane of the zone plate in x– and y-directions. An interferometer-controlled piezoelectric stage with precision of a few nm is used for fine scans, and a stepping-motor-driven stage is employed for positioning and coarse scans. Next generation STXMs also allow for scanning the zone plate instead of the sample. Transmitted photons are detected using a phosphor scintillator in front of a photomultiplier tube (see Fig. 1h). The STXM beamlines are typically operated at an energy resolving power E/ΔE > 3,000 with a photon flux of 108–109 s−1 on the sample. The STXM can be operated under low or high vacuum, under atmospheric pressure (depending on the X-ray absorption edges of interest), or in a helium atmosphere during operation. Since He does not absorb soft X-rays, the latter is the most common way of operating the STXM [2, 10–12].
Fig. 1
Setup of a synchrotron undulator-based STXM beamline in standard configuration (not to scale). Electrons are stored in an evacuated storage ring (a) and synchrotron radiation is generated by an undulator (b). A monochromator (c) allows for controlling the energy of the incident soft X-ray beam. Exit slits (d) are selecting the energy range and control the intensity of the beam. The soft X-rays are focused on the sample by a Fresnel zone plate (e). An order-sorting aperture (f) blocks non-focused zeroth-order light. The sample is raster scanned in x– and y-direction and for tomography measurements additionally rotated in the beam path by a stepper motor mounted on a STXM sample plate (g). The transmitted photon signal is detected by a phosphor scintillator in front of a photomultiplier tube (h)
The energy of the X-ray beam is scanned across X-ray absorption edges, resulting in the generation of near-edge X-ray absorption fine structure (NEXAFS) spectra. NEXAFS spectra are generated by absorption of photons through excitation of core electrons (e.g., of the K or L shell) to higher unoccupied energy states. The fine structure of NEXAFS spectra depends on the elemental composition and on the chemical bonding environments of the elements that are present in the sample. It is possible to acquire images at selected single photon energies or to acquire sequences of images (image stacks) at tens to hundreds of different photon energies [13] across absorption edges, resulting in NEXAFS spectra for each individual pixel. The measured transmitted photon flux is normalized into linear absorbance scale (optical density, OD) OD = −ln (I/I 0) where I 0 denotes the transmitted photon intensity in an empty spot adjacent to the sample and I the detected photon intensity on the sample. According to Lambert–Beer’s law, the OD can then be used to quantify chemical species in the beam path [10–12].
The energy range of soft X-rays allows for accessing the 1s absorption edges of light elements of high biological relevance such as carbon, nitrogen, and oxygen as well as environmentally important elements such as sodium, magnesium, aluminum, silicon, and phosphorous. Furthermore, the 2p absorption edges of environmentally relevant elements such as potassium, sulfur, chlorine, and calcium as well as the 2p absorption edges of most (redox-sensitive) transition metals like titanium, vanadium, chromium, manganese, iron, cobalt, nickel, copper, and zinc can be accessed by undulator-based soft X-ray STXMs. Also, analysis of the 4d absorption edges of actinide elements such as uranium is possible [10, 12, 14, 15].
1.2 Application of STXM in Bio-, Geo-, and Environmental Sciences
The identification of environmental processes and mechanisms often requires information on the organochemical and inorganic composition of specimens at high spatial resolution. Thus, STXM, a combination of high spatial resolution microscopy with NEXAFS spectroscopy, is ideally suited for many applications in bio-, geo-, and environmental sciences. Several examples wherein STXM-based chemical mapping was used to tackle environmentally relevant questions are described in the following sections.
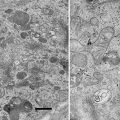
STXM can be used to do in situ chemical analysis of fully hydrated samples up to approximately 2 μm thickness, which allows for investigating chemical processes at solid–liquid and solid–solid interfaces (e.g., at the mineral–water or mineral–microbe interface) and sorption processes for different metals or chemical substances. In the energy range between the C-1s (284.2 eV) and O-1s (543.1 eV) absorption edges, the so-called water window, the X-ray absorption of organic material is an order of magnitude higher than the absorption of water, which makes STXM a particularly well-suited approach for the analysis of hydrated organic samples such as biofilms or cell–mineral aggregates formed by bacteria [16]. In the last decade, many studies has been performed on environmental biofilm samples that were either deposited or directly grown on silicon nitride (Si3N4) windows or, alternatively, embedded between two Si3N4 windows for STXM measurements in fully hydrated state. It was possible to determine with STXM the distribution of organic macromolecules (like polysaccharides, proteins, lipids, nucleic acids, and contaminants), metals, and mineral phases within the wet biofilm samples. To give an example, Lawrence and colleagues [17] showed that the spatial distributions of organic macromolecules can be mapped quantitatively within a biofilm at the C-1s absorption edge without previous fixation or staining just by using the intrinsic absorption contrast. Thus, they could, for example, identify and distinguish between cells that are rich in protein, cell compartments that are rich in lipids, and an extracellular matrix that is rich in polysaccharides. STXM also allows for acquiring quantitative information about spatial distributions and speciations (redox state/mineralogy) of different metals such as copper, iron, manganese, and nickel at their respective 2p absorption edges in biofilms. Dynes and coworkers identified and quantified the sorption of Ni2+ that was supplemented to these biofilms to Mn oxides and Fe oxides and to organic sorbents within the biofilms. In this system, Mn oxides were identified to be the main sorbents for Ni2+ [18]. A further detailed study revealed that iron, manganese, and nickel were associated to the silicate-rich sheaths of filamentous bacteria [19]. The high resolution of STXM also facilitated to study the fate of copper nanoparticles in these biofilms. The authors found that the copper nanoparticles were sorbed by extracellular polymeric substances (EPS) and diatoms [20]. Another study on biofilms was done by Hunter and coworkers [21]. Biofilms formed by Pseudomonas aeruginosa were analyzed for the spatial distribution of Fe(II) and Fe(III). STXM revealed that Fe(III) was mainly located at the cell surface whereas Fe(II) was associated with the EPS. In addition, during the last few years, STXM is increasingly applied to elucidate the different mechanisms of bacteria that mediate redox reactions such as Fe(II) oxidation by Fe(II)-oxidizing bacteria. Combinations of conventional (transmission) electron microscopy studies with STXM analysis of the mixotrophic, nitrate-reducing, anaerobic Fe(II)-oxidizing Acidovorax sp. strain BoFeN1 revealed initial Fe(II) oxidation in the periplasm with subsequent cell encrustation and goethite formation in vicinity to the cell. An amorphous iron phosphate was identified as an initial iron mineral phase [22, 23]. Additionally, green rust, a highly reactive mixed Fe(II)–Fe(III) hydroxide, was also observed as intermediate mineral phase of Fe(II) oxidation by BoFeN1 [24]. Arsenic sorption to encrusted BoFeN1 cells and extracellular iron minerals was studied by Hitchcock and colleagues [25] in a study wherein low-energy X-ray fluorescence detection was implemented in STXM for sensitive As detection. In contrast to the cell encrusting microbial Fe(II) oxidation mechanism, no cell encrustation and extracellular nano-goethite formation was observed for the phototrophic, anaerobic Fe(II)-oxidizing Rhodobacter sp. strain SW2. Organic polymeric fibers of polysaccharides and lipids were indicated as templates for mineral precipitation by STXM [26]. Chan and colleagues [27–29] analyzed iron oxyhydroxide containing sheaths and stalks, which are characteristic for microaerophilic bacterial strains such as Gallionella and Leptothrix. They identified that sheaths and stalks contain polysaccharides which are possibly secreted by cells to control Fe(III) mineral precipitation and to avoid cell encrustation. Moreover, iron minerals were found to protect polysaccharides from degradation. In contrast to the different microbial Fe(II) oxidation mechanisms, dissimilatory Fe(III) reduction by Shewanella oneidensis MR-1 was studied by STXM in combination with X-ray magnetic circular dichroism (XMCD). Coker and colleagues [30] revealed that magnetite, as a product of dissimilatory Fe(III) reduction, was associated with proteins and lipids produced by the bacteria. These precipitates showed higher Fe(II)/Fe(III) ratios compared to stoichiometric magnetite. This was in contrast to magnetite associated with polysaccharides that showed lower Fe(II)/Fe(III) ratios compared to stoichiometric magnetite. The authors interpreted the result to indicate a direct electron transfer from bacterial cell surfaces to Fe(III) minerals. The combination of STXM with XMCD was also used to study magnetosomes that are formed by the marine Vibrio sp. strain MV-1 [31]. The XMCD results showed that the magnetic fields of individual magnetite crystals in linear chains of magnetosomes were orientated in parallel. Also, higher Fe(II)/Fe(III) ratios were observed in biogenic magnetosomes as compared to stoichiometric magnetite.
STXM was also used to investigate microbial oxidation of Mn(II) [32, 33]. STXM allowed to map the spatial distribution of Mn(II)-, Mn(III)-, and Mn(IV)-containing precipitates resulting from biogenic Mn(II) oxidation by the marine Bacillus sp. strain SG-1. From these results, the authors assumed a single-electron-transfer step during oxidation of Mn(II) [32]. Also, Toner and colleagues [33] studied microbial Mn(II) oxidation and Mn(III)- and Mn(IV)-containing precipitates within a biofilm formed by the Pseudomonas putida strain MnB1. They identified that Mn(III) was formed during microbial Mn(II) oxidation as a reaction intermediate that acts as an oxidant in the environment. Another field of research wherein STXM was often used to study biomineralization processes is the precipitation of calcium containing minerals. Applying STXM at the C-1s, Ca-2p, and P-2p absorption edges allowed to identify the formation of hydroxyapatite by the microorganism Caulobacter crescentus grown under high calcium concentrations [34]. Obst and colleagues [35] identified an amorphous calcium carbonate phase with an aragonite-like short-range order within the EPS of the cyanobacterial strain Synechococcus leopoliensis PCC 7942 that could act as a protection mechanism against cell encrustation by the thermodynamically more stable mineral phase calcite.
Norlund and coworkers studied the sulfur speciation within microbial consortia from an acid mine drainage (AMD) environment [36]. Sulfur compounds with three different oxidation states, such as sulfur, sulfite, and sulfate, were identified and mapped with STXM at the S-1s and S-2p absorption edges, indicating a coupled microbial sulfur oxidation and reduction within these microbial consortia.
Thus, in various studies, STXM has been used to quantify and map at high spatial resolution chemical species, which allowed for identifying and quantifying previously unknown reaction mechanisms in environmental samples. However, all of these studies used a 2D mapping approach, which projects an in fact 3D sample into 2D.
1.3 STXM Angle-Scan Tomography
The study of 3D objects such as biofilms or cell–mineral aggregates using the conventional 2D projection approach results in a loss of structural and chemical information. To circumvent this problem, samples can be analyzed in 3D. STXM in combination with angle-scan tomography provides the potential of acquiring 3D spectromicroscopic data. For STXM angle-scan tomography measurements, the sample is rotated around an axis perpendicular to the incident soft X-ray beam (see Fig. 1g). Typically, a range of ~140–180° is covered in steps of 3–5° [37, 38]. The larger angle step size in comparison to electron tomography is caused by the limitation of synchrotron beamtime that is available for STXM angle-scan tomography. Transmission images are acquired at several selected photon energies from different tilt angles, resulting in angle series of spectromicroscopic datasets. Similar to the well-established transmission electron microscopy (TEM) tilt-series tomography or transmission X-ray microscopy (TXM) tomography, a 3D model can be reconstructed by numeric algorithms such as back projection and filtered back projection or iterative approaches such as algebraic reconstruction techniques [39] and serial iterative reconstruction techniques [40].
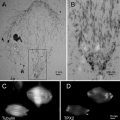
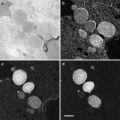
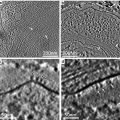
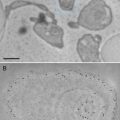
Early pioneering work was done by Wang and colleagues [41, 42], who applied 3D mapping using a cryo-STXM. They acquired datasets at selected single photon energies and focused on the reconstruction of structural features of frozen hydrated eukaryotic cells. Although no chemical information was extracted from the dataset, the contrast mechanisms employed the intrinsic contrast caused by biomacromolecules and did not require contrasting agents such as heavy metals that are commonly used in electron microscopy. Depending on sample properties and the scientific question, the sample can be prepared in different ways for STXM tomography. The different approaches are optimized either for the preservation of structural features or for the preservation of the chemical composition of the specimen. One powerful approach is the use of glass micro-capillaries filled with hydrated samples. Tomography measurements with glass micro-capillaries were performed on wet biofilms and polymer microspheres in aqueous suspensions at the O-1s absorption edge [37, 43, 44]. Analysis of samples at the C-1s absorption edge, however, has not been possible with this approach due to the relatively high absorption of soft X-rays by the glass walls of the capillaries. This problem was overcome by the introduction of carbon micropipettes (carbon tubes), which allowed measurements at the C-1s absorption edge [44]. In a different approach, Obst and colleagues [38] used a stripe cut from a Formvar-coated copper TEM grid with dried biological sample material for STXM tomography measurements. They conducted 3D chemical mapping at the C-1s and Ca-2p absorption edges to characterize the distribution and the quantitative correlation of calcium and organic carbon for the cyanobacterial strain S. leopoliensis PCC 7942. A novel wet cell sampler holder was developed in collaboration with Luxel (Luxel, Friday Harbor, USA) and introduced for spectromicroscopic 2D and 3D chemical mapping of fully hydrated samples [45]. Obst and colleagues [45] first tested this Luxel wet cell to analyze in 2D the cell–mineral aggregates formed by the Fe(II)-oxidizing bacteria Acidovorax sp. BoFeN1 at the O-1s and Fe-2p absorption edges to detect organic macromolecules and iron in different redox states. Therefore, the wet sample was injected into the gap between two LUXFilm® polyimide membranes by a micropipette. Wang and colleagues [46] used the Luxel wet cell for 3D chemical mapping of sulfur-metabolizing bacteria. They recorded spectromicroscopic datasets at the S-2p, C-1s, and Ca-2p absorption edges to determine the 3D distribution of calcite and organic macromolecules. A different approach was used in material science by Hilhorst and colleagues [47]. The authors grew colloidal photonic crystals directly on platinum- or palladium-coated TEM grids. A stripe was cut from the TEM grid for STXM tomography measurements at the Si-1s absorption edge, permitting the 3D reconstruction of the internal crystal structure. Another technical approach for acquiring STXM tomography datasets was applied by Hitchcock and colleagues [48]. They combined STXM with serial sectioning of the sample to perform 3D chemical mapping of carbon toner particles at the C-1s absorption edge. The focus of all STXM tomography approaches is clearly the combination of chemical information with high spatial resolution in three dimensions.
However, being a scanning technique, STXM is rather slow as compared to full-field microscopy approaches such as TEM or TXM. The major advantage of STXM tomography over full-field techniques, however, is the capability of extracting intrinsic chemical information from the specimen, i.e., the combination of microscopy and NEXAFS spectroscopy. The most relevant advantages and limitations of STXM angle-scan tomography are summarized in Table 1 [12, 49].
Table 1
Advantages and limitations of STXM
Advantages | Limitations |
|---|---|
No staining or fixation of the sample required | Challenging sample preparation (mounting of brittle Si3N4 windows, cutting of the stripes of TEM grids) |
High spatial resolution (10–50 nm) | Low data acquisition rate compared to TXM or TEM tomography |
Elemental analysis of organic and inorganic chemical components | Limited sample thickness (for biological samples <300 nm at C-1s absorption edge) |
Speciation (molecular structure, redox state, mineral phase) from NEXAFS spectra | Missing wedge and poor image quality at high tilt angles |
Quantitative mapping | Radiation damage |
Hydrated samples | Absorption saturation |
~5–10 times lower dose and thus less radiation damage as compared to TXM tomography | Limitation of available synchrotron beamtime |
As already mentioned, another powerful approach is the combination of transmission (soft) X-ray microscopy (TXM) with angle-scan tomography. This approach has been the method of choice for biological studies wherein scientists were less interested in the chemical composition of the sample but rather used the intrinsic X-ray absorption contrast of the samples to avoid artifacts introduced by sample staining. Since the sample is not raster scanned on a piezo-driven stage, the approach allows for performing tomography at cryogenic temperatures using an appropriate cryostage. This will also be possible in the next generation STXMs such as beamline 5.3.2.1 at the ALS that includes capabilities for scanning the zone plate instead of the sample. However, in contrast to STXM, a TXM consists of two zone plates that act as condenser and objective respectively. Due to the beamline and instrument designs, the major differences between STXM and TXM are the focus on spatially resolved chemical information (i.e., higher spectral resolving power, optimization for changing incident photon energies) in case of STXM and the focus on fast imaging in case of TXM. A significant disadvantage of TXM over STXM is the lower detection efficiency due to an additional loss of photons caused by the second zone plate, which requires higher photon fluxes through the sample in order to obtain the same information. However, a major disadvantage of STXM as compared to TXM is the much slower rate of data acquisition. One of the first 3D reconstructions by TXM tomography was performed by Weiss and colleagues [50] who studied the structure of the algae Chlamydomonas reinhardtii. Other pioneering TXM tomography results include 3D reconstructions of yeast cells [51].
2 Materials
In the next section, tools and special equipment that are required for the different sample preparation approaches for 2D STXM and/or 3D STXM tomography measurements will be described.
2.1 STXM Sample Preparation
1.
Formvar-coated copper TEM grids (diameter of 3.05 mm) (see Table 2):
Table 2
Sample holder materials for conventional 2D and tomography STXM measurements
Material | Application | References |
|---|---|---|
Silicon nitride windows (Si3N4) | Dry and hydrated samples. No STXM tomography possible | |
TEM grids | Dry samples. Little X-ray absorption due the Formvar (C-1s background). Limited tilt angle for TEM stripes | |
Glass micro-capillaries with tip diameter of ~2–5 μm | Hydrated samples. 360° sample rotation possible. High X-ray absorption at the C-1s absorption edge | |
Wet cell, window is covered on both sides by 30-nm LUXFilm® polyimide membrane | Hydrated samples. Thicker samples at the C-1s absorption edge due to lower X-ray absorption compared to Si3N4 windows. Photon energies down to the S-2p absorption edge possible. Higher stability and less wobbling during rotation. Limited tilt angle | |
Carbon tubes with wall thickness of 45 nm | Partially hydrated samples. Low X-ray absorption at the C-1s absorption edge | [44] |
(a)
200 mesh for conventional 2D spectromicroscopic measurements (i.e., image sequences across absorption edges for 2D chemical mapping).
(b)
300 mesh for tomography samples; properly aligned single stripes of 300-mesh grids (width ≈120 μm) can be rotated in space between the order-sorting aperture and the focal plane.
2.
Silicon nitride (Si3N4) windows for spectromicroscopic 2D studies: a silicon frame of 5 × 5 × 0.2 mm with a window size of 1 × 1 mm or 0.5 × 0.5 mm. A thickness of 75 nm turned out to be a good compromise for stability and X-ray transparency (see Table 2).
3.
Glass micro-capillaries with a tip diameter of ~2–5 μm made from boron silicate glass capillaries with an initial outer diameter of ~1 mm and a micropipette puller (e.g., P-87 Flaming/Brown Micropipette Puller, Sutter Instruments Inc., Novato) (see Table 2). Fabrication of carbon micropipettes (carbon tubes) is described by Schrlau et al. [52].
4.
Luxel wet cell stripes (nickel frame, 250 μm wide, and 15 μm thick), window covered on both sides with 30-nm LUXFilm® polyimide membranes (Luxel, Friday Harbor) (see Table 2).
5.
For handling TEM grids reverse (self-closing) tweezers are suitable. For handling Si3N4 windows carbofib tweezers are best, since they reduce chipping of Si3N4 at the edges. Additionally, high precision or ultra fine tweezers for handling TEM grids and stripes or Si3N4 windows. Round and fresh scalpel blades (shape 24 blades turned out to be most convenient for cutting TEM grids without bending them).
6.
Small, one-way syringes and micropipettes for transfer of suspended or diluted sample. Filter paper for blotting wet TEM grids and single Si3N4 windows. Microscopy glass slides for handling TEM grids for cutting. Stainless steel or brass rods (diameter of ~0.8–0.9 mm, flattened for ~1 mm at half diameter at one end) for mounting wet cells or TEM grid stripes.
7.
Epoxy resin for sealing two sandwiched Si3N4 windows if anoxic sample treatment is required. Nail polish for mounting TEM grid stripes on the stainless steel or brass rods for tomography. Silicone grease for sealing glass micro-capillaries and carbon micropipettes (carbon tubes).
8.
A custom-made mounting tool that holds and remote-controls tweezers is available at both the CLS and the ALS for simpler mounting and gluing of the TEM stripes on the flat side of the rods. Optimally, the tomo-mounting tool is used in combination with a XYZ micromanipulator for accurate positioning of the TEM grid stripes.
9.
A stereomicroscope for preparation of samples, e.g., when tweezers are required.
10.
STXM tomography rotation stage, controller, and software. These tools are available at most STXM beamlines upon request; e.g., at the ALS and at the CLS, rotation stage for conventional scanning stage; Jova solutions (San Francisco, CA) for stepper motor controller; and LabView-based software for rotation control.
2.2 STXM Beamlines
Table 3 summarized currently available STXM beamlines in operation, in commission, and in construction.
Table 3
Available STXM beamlines with bending magnet (BM), elliptically polarizing undulator (EPU) or an undulator (U) as synchrotron radiation source