Fig. 1
Primary cells and commonly used cell lines exhibit false-positive PI staining. Primary cells and cell lines were harvested and stained with propidium iodide and DRAQ5. Primary cells included chicken blastodermal cells, goldfish primary kidney macrophages (PKM), porcine lung macrophages, porcine spleen macrophages, murine splenocytes, and bone marrow (BM) macrophages. Cell lines included human Jurkat T-cells and murine RAW macrophages. Imagery was acquired by an ImageStream multi-spectral imaging flow cytometer.Fig. 1 (a) Representative analysis shows procedure for classification of primary kidney macrophage cells into true positive (R4) and false positive (R5) populations. Using a mask that highlighted the nuclear area, based on the pixel intensity of the DRAQ5 stain, the degree of colocalization between DRAQ5 and PI was determined. (b) All cell types tested exhibited false-positive PI staining to varying degrees. To allow for easier visual determination of PI and DRAQ5 colocalization, the DRAQ5 stain was given a green pseudocolor. Areas where PI and DRAQ5 colocalize appear yellow. Cells with a high degree of colocalization were characterized as true positive. Cells with a low degree of colocalization were characterized as false positive. Chicken blastodermal cells, n = 5; goldfish PKM, n = 3; porcine lung and spleen macrophages, n = 3; murine splenocytes and bone marrow (BM) macrophages, n = 2; Jurkat T-cells, n = 3; RAW macrophages, n = 3. Modified figure from Rieger et al. (2010) [15]
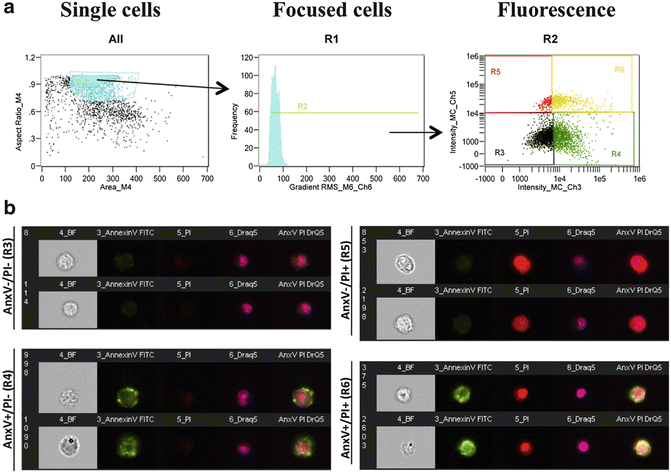
Fig. 2
Gating strategy for ImageStream analysis. (a) To analyze cell death, cells are first gated to remove clumps and debris (far left). Using this population, cells are then gated based on focus using gradient RMS (middle). To create this gate, progressively selects bins to find identify focused cells. This population represents the single, focused cell population. This population is used for all downstream analyses. To determine cell death, a dot plot denotes the fluorescence intensity of Annexin V versus the fluorescence intensity of PI. (b) Representative images correspond to cells that are Annexin V−/PI− (healthy cells), Annexin V+/PI− (apoptotic cells), Annexin V−/PI+ (necrotic cells), and Annexin V+/PI+ (late apoptotic/necrotic cells)
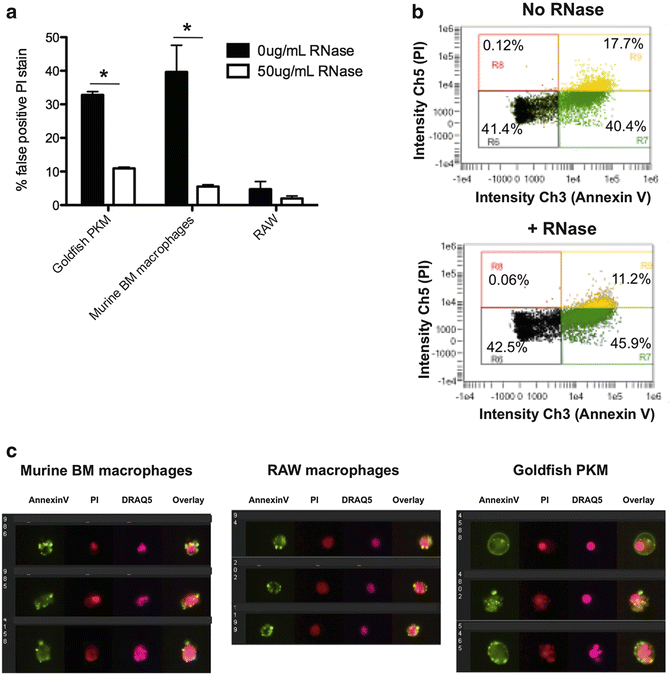
Fig. 3
Improving the Annexin V/PI based assessment of cell death across a range of experimental models using imaging flow cytometry. (a) Cells were fixed with 1 % formaldehyde and treated ±50 μg/mL DNase-free RNase for 15 min, according to our modified protocol. A conventional staining protocol leads to marked PI cytoplasmic staining, whereas modification of the protocol and inclusion of RNase A decreases cytoplasmic RNA staining. (b) Scatterplots depicting Annexin V/PI stain of goldfish primary macrophages (PKM). Following RNase treatment, there was a decrease in the percentage of PI+ cells due to removal of false-positive events. Note: the decrease in false positive events is shown in the context of the whole population of cells (PI+ and PI−). (c) Representative images of goldfish PKM, murine bone marrow macrophages, and RAW cells stained using the modified Annexin V/PI protocol. Using this protocol, cytoplasmic PI staining is reduced while intensity/pattern of Annexin V stain is unchanged. Modified figure from Rieger et al. (2010) [15]
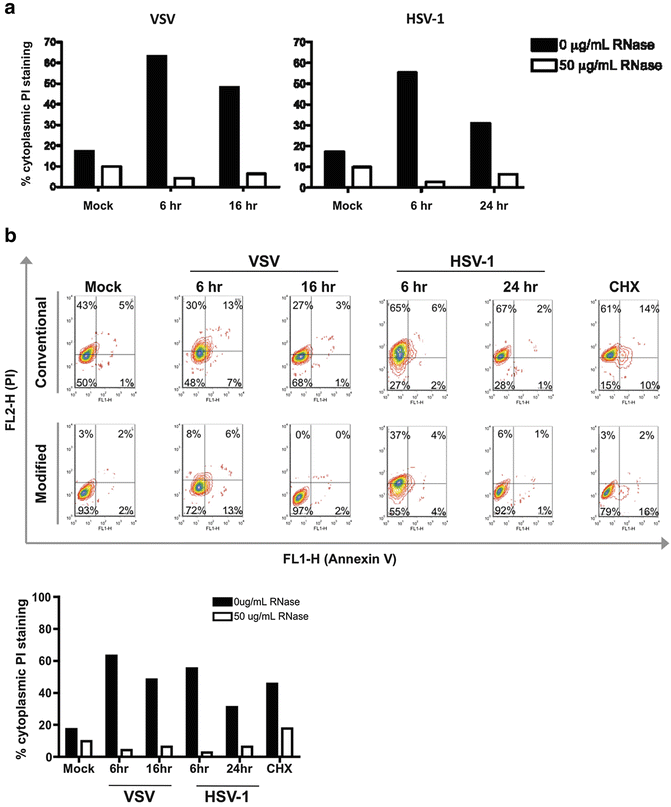
Fig. 4
Application of modified Annexin V/PI protocol for examination of cell death in virally infected cells. (a) Application of modified Annexin V/PI protocol to virally infected cells using an ImageStream platform. Vero cells were infected with vesicular stomatitis virus (VSV) or herpes simplex virus (HSV-1) with a multiplicity of infection of five. Cells were harvested at the indicated time points and stained using either the conventional Annexin V/PI protocol (no fixation, no RNase) or with the modified Annexin V/PI protocol (with fixation and RNase addition). Viral infection increases the number of false positive PI events detected. Treatment with RNase greatly reduces the percentage of cells with cytoplasmic PI staining. (b) Application of modified Annexin V/PI protocol to virally infected cells using conventional flow cytometry platform. Vero cells were infected with VSV or HSV1 and stained using the conventional Annexin V/PI protocol or the modified Annexin V/PI protocol, as described above. Cell death was analyzed on a BD FACSCanto II. Conventional flow cytometry analysis also shows that RNase treatment reduces cytoplasmic PI staining associated with increased RNA content from viral infection
2 Materials
2.1 Phosphate-Buffered Saline
Phosphate-buffered saline (PBS) is an isotonic solution made with sodium phosphate and sodium chloride. The formulation we use lacks calcium and magnesium. A 10× solution is prepared with: KCl–2.00 g, KH2PO4–2.00 g, NaCl–80.00 g, Na2HPO4∙7H2O–21.60 g, top to 1 L with ultrapure water (prepared by purifying deionized water to attain a sensitivity of 18.2 MΩ cm at 25 °C) (see Note 1 ). Diluting 10× solution with ultrapure water creates a 1× PBS−/− stock solution (see Note 2 ).
2.2 Annexin V Binding Buffer
A 10× solution of Annexin V binding buffer can be purchased from various sources (see Note 3 ). This solution has the appropriate calcium and magnesium concentrations for staining with Annexin V (see Note 4 ). Prior to staining, a 10× solution should be diluted to 1× with ultrapure water. This solution should be used cold and made fresh for each experiment.
2.3 Annexin V
Annexin V can be purchased complexed with a number of different fluorochromes. Common fluorochromes include FITC, PE, APC, eFluor®450, or PerCP-eFluor®710. Fluorochrome selection will depend on the laser configuration of the flow cytometer or microscope platform used, and the fluorochromes of any other stains being used in the experiment.
2.4 Propidium Iodide
PI intercalates into double-stranded nucleic acids (RNA or DNA). This dye cannot penetrate living membranes, so it is only incorporated into cells with disrupted membranes. PI can be purchased from many vendors.
2.5 Formaldehyde
Formaldehyde is a commonly used tissue fixative and embalming agent. Many vendors supply formaldehyde at a 37 % solution. To create an isotonic 2 % stock solution, add 54 mL 37 % formaldehyde to 100 mL 10× PBS−/− and top to 1 L with ultrapure water. This solution can be stored a room temperature for a number of months.
2.6 RNase A
RNase A was purchased from Sigma-Aldrich (catalogue # R4642) and derived from bovine pancreas (see Note 5 ).
3 Methods
This procedure can be performed in 1.5 mL microcentrifuge tubes or 5 mL polystyrene round-bottom FACS tubes. The latter is normally used when carrying out viability analysis in conjunction with other procedures or for standard flow cytometry platforms. All volumes provided are for 5 mL polystyrene round-bottom FACS tubes. For 1.5 mL microcentrifuge tubes, reduce all wash volumes by 1/5; volumes of staining parameters remain unchanged. Microcentrifuge tubes are used for ImageStream analysis. Staining for ImageStream analysis can be done directly in 1.5 mL microcentrifuge tubes or in 5 mL polystyrene round-bottom FACS tubes and subsequently transferred to 1.5 mL microcentrifuge tubes.
The optimum concentration for imaging flow cytometry analysis is 2–4 × 10⁶ cells per 200 μL volume. Cell loss may result from this procedure and thus we recommend that each sample consist of 4 × 10⁶ cells at the start of the procedure if possible. For standard flow cytometry platforms, a lower cell concentration is possible. 1 × 10⁶ cells are sufficient when using a BD FACSCanto II platform, where staining steps are performed in 100 μl and washes in 2 mL volumes.
3.1 Cell Preparation
1.
 Quantitative Functional Morphology by Imaging Flow Cytometry
Principles of Amnis Imaging Flow Cytometry
Quantitative Functional Morphology by Imaging Flow Cytometry
Principles of Amnis Imaging Flow Cytometry
 Detection and Characterization of Rare Circulating Endothelial Cells by Imaging Flow Cytometry
 Assessment of Granulocyte Subset Activation: New Information from Image-Based Flow Cytometry
 Screening for Drugs Against the Plasmodium falciparum Digestive Vacuole by Imaging Flow Cytometry
 Quantitation of Chromosome Damage by Imaging Flow Cytometry


Harvest cells—use lab-specific procedures for corresponding cell lines or primary cell isolations. Harvesting procedures will vary greatly depending on cell type (e.g., if cell is adherent or non-adherent).
Related posts:
Quantitative Functional Morphology by Imaging Flow Cytometry
Principles of Amnis Imaging Flow Cytometry
Detection and Characterization of Rare Circulating Endothelial Cells by Imaging Flow Cytometry
Assessment of Granulocyte Subset Activation: New Information from Image-Based Flow Cytometry
Screening for Drugs Against the Plasmodium falciparum Digestive Vacuole by Imaging Flow Cytometry
Quantitation of Chromosome Damage by Imaging Flow Cytometry
Stay updated, free articles. Join our Telegram channel
Full access? Get Clinical Tree
