Fig. 1
Gating strategy for enrichment of CECs during acquisition on an ImageStream MKII. Debris and large aggregates were eliminated with the R1 gate (a). The majority of CD146 PE-negative events were eliminated with the R2 gate to enrich for CD146-positive cells. Great care must be taken to ensure all PE-positive events are included in the R2 gate. The left edge of the R2 gate should be set generously. Events which may have saturated the camera in the PE channel were also eliminated in the R2 gate (b). 7-AAD or Hoechst fluorescence which may have saturated the camera was gated out (c), as was any saturating CD3 AlexaFluor 647 or CD45 APC-Cy7 fluorescence (d)
1.
Load the unstained sample.
(a)
Create a two-parameter dot plot of the Area_Channel 1 feature versus the Aspect Ratio_Channel 1 feature and draw a generous amorphous gate (“R1”) around the single-cell population to eliminate the acquisition of debris and aggregates into the acquired data file (Fig. 1a).
(b)
Create a histogram, gated on “R1,” of the Raw Max Pixel_Channel 3 feature. Create a region (“R2”) whose left edge excludes the majority of the unstained cells and whose right edge is set at a RMxP_Ch 3 value of 4090 to exclude events which were saturating the camera (Fig. 1b). Great care must be taken to ensure that dim CD146 PE positive events are included in this gate. The gate should be set generously. Stricter gating can be done in subsequent analysis after compensation has been performed. Exact values for the lower RMxP_Ch 3 setting are not given here, as the actual lower RMxP_Ch 3 setting may vary from instrument to instrument, with laser powers, and with staining conditions.
The following steps were only used to eliminate saturating events. These are not strictly necessary, but are highly valuable in gating out events which are saturating the camera, and thus could have incorrectly calculated feature values.
(c)
Create a two-parameter dot plot, gated on the CD146 positive gate “R2”, of the Raw Max Pixel_Channel 7 feature (Hoechst) versus Raw Max Pixel_Channel 5 feature (7-AAD). Create a large rectangular gate (“R3”), which includes all events except those containing saturating fluorescence (Fig. 1c). Set the upper left and lower right vertices to a raw max pixel value of 4090.
(d)
Create a two parameter dot plot, gated on the “R3” gate, of the Raw Max Pixel_Channel 11 feature (CD3-AF647) versus the Raw Max Pixel_Channel 12 feature (CD45 APC-Cy7). Create a large rectangular gate (“R4”) (Fig. 1d) which includes all events except those containing saturating fluorescence. Set the upper left and lower right vertices to a raw max pixel value of 4090. Setting the gate in this manner allowed the study of Th17 phenotype identified by CD146 expression on CD3+ cells [16].
2.
Set the destination folder, enter the file name, and number of events to collect.
3.
Designate the R1 acquisition gate in the File Acquisition area in INSPIRE. It is necessary to use the R1 gate at this step, as the R2 gate is for acquiring PE-positive events, which should not occur in the unstained sample. Acquire 10,000 events of the unstained sample.
4.
Load and acquire 10,000–20,000 events of the N − 1 sample using the R1 acquisition gate. Similarly as for the unstained sample, it is necessary to use the R1 gate at this step, since the R2 gate is set for acquiring PE-positive events, which should not occur in the N − 1 sample. Any PE positive events that do occur in the acquired file will have arisen as a result of nonspecific binding or dead cells, etc., and will help with eliminating false PE positive events from the final CEC gate.
5.
Load the CEC sample and ensure that the acquisition gate acquisition gate in the File Acquisition area in INSPIRE is set (“R4”). The cells which are being currently viewed (top left pull-down menu in INSPIRE) can also be set to R4 to visualize only the events of interest as they are being acquired.
6.
Acquire multiple 10,000–20,000 event files.
3.2.3 Acquiring Single-Color Compensation Controls
It is absolutely essential that compensation controls be acquired properly and that the compensation matrix is accurate (see Subheading 3.3.1 for creating the compensation matrix). Single-color controls for compensation must be run with bright field and the 785 nm laser turned off, and with all other lasers set to the power used while collecting the CEC samples. The acquisition gates will be different for the single-color controls than they were for acquiring the unstained, N − 1, or CEC sample because turning off bright field invalidates the R1 acquisition gate (as no events will fall in the R1 bright-field gate). In fact, the acquisition gates will be different for each single color control, corresponding with which fluorescence channel is currently being used. Further, extremely bright events which saturate the camera should be eliminated from the acquisition file using the Raw Max Pixel feature, to ensure proper compensation. Since the CEC sample was acquired uncompensated, the single-color controls can be acquired after the samples.
Acquisition gates for the single-color controls were set as follows:
(a)
Turn off both bright field and the 785 laser. Files acquired with bright field turned off will be annotated with “_NoBF.rif”. These files should be used when creating the compensation matrix in IDEAS following acquisition.
(b)
Create a histogram gated on All events using the Raw Max Pixel_Channel 3 (CD146 PE) feature and draw a region so that events above 4090 are eliminated from the acquired file. Use this gate while acquiring the CD146 single-color control.
(c)
Acquire 10,000 events.
(d)
Repeat steps (b) and (c) above for each fluorescence channel used, changing the Raw Max Pixel feature channel as appropriate for each single-color control. A new acquisition gate, which eliminates the saturating fluorescence for the channel currently being used, will need to be created for each channel used, and set as the acquisition gate.
3.3 Data Analysis
All data analysis is performed in IDEAS analysis software.
3.3.1 Compensation Matrix
1.
Prior to creating the compensation matrix, each single color control file can be separately analyzed to identify true positively stained cells, and a new “_NoBF” rif can be created which contains only true positively stained cells, eliminating debris, particles staining nonspecifically for the dye, or auto-fluorescence (see Note 6 ).
2.
Follow the steps in the compensation wizard to create a compensation matrix utilizing the “_NoBF” single color control rif files.
3.
View the created matrix and ensure that there are values for each channel used. It is absolutely imperative that all compensation values in the matrix be verified and modified if necessary. All single-color controls should be checked individually against every other single color control used in the panel with the calculated compensation matrix to ensure that appropriate values have been determined. If values are over- or under-compensated, the matrix should be edited until compensation is accurate.
3.3.2 Gating Strategy
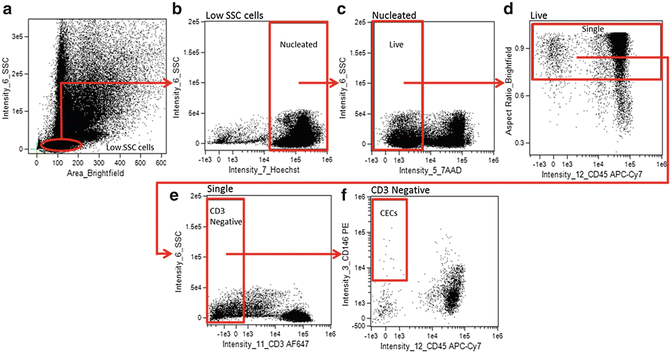
A hierarchical gating strategy is created to identify CECs (Fig. 2).


Fig. 2
Analysis gating strategy for identifying CECs from Samsel, et al. [15]. CECs were identified as low SSC (a), Hoechst positive (nucleated) (b), 7-AAD negative (live) (c), aspect ratio high (single cells) (d), CD3 negative (non-T-cells) (e), CD45 negative (non-leukocytic) CD146-positive cells (f)
1.
Open a CEC rif file and apply the optimized compensation matrix.
2.
Create a Brightfield_Area versus Intensity_Side Scatter plot to identify and create a gate on low side scatter mononuclear cells (Fig. 2a).
3.
Create an Intensity_Hoechst (Channel 7) versus Intensity_Side Scatter (Channel 6) plot, gated on the low side scatter mononuclear cells, to identify and gate on Hoechst positive (nucleated) cells (Fig. 2b).
4.
Create an Intensity_7AAD (Channel 5) versus Intensity_Side Scatter (Channel 6) plot, gated on nucleated low side scatter cells, to identify and gate on Live (7AAD negative) cells (Fig. 2c).
5.


Create an Intensity_CD45 APC-Cy7 (Channel 12) versus Aspect Ratio_Brightfield plot, gated on Live, Nucleated, low side scatter cells, to identify and gate on single cells (Fig. 2d). Single, round cells have a higher aspect ratio while elongated cells, aggregates, or more than one cell in a frame have a lower aspect ratio.
Stay updated, free articles. Join our Telegram channel

Full access? Get Clinical Tree


