Computed Tomography of Coronary Arteries and Ischemic Heart Disease
Computed Tomography of Coronary Arteries and Ischemic Heart Disease
Karen Ordovas
Brett Elicker
Charles B. Higgins
INTRODUCTION
More than 700,000 patients die each year from myocardial infarction (MI) in the United States. Approximately 50% of these patients have sudden death or MI as the first manifestation of coronary artery disease (CAD). Therefore, methods for early detection and risk stratification of CAD are extremely important. The most widely used risk stratification method is the Framingham score. This score provides an estimate of the risk of a major cardiac event occurring in the following 10 years based upon eight clinical and laboratory criteria including blood pressure, serum lipids, diabetes, and family history of CAD. As up to 50% of patients with MI have no Framingham risk factors, supplementary methods for detection and additional risk stratification for CAD are highly desirable.
The development of fast computed tomography (CT) scans with cardiac gating capabilities has made noninvasive visualization of the moving heart and coronary arteries possible. The first cross-sectional images of the coronary arteries were obtained for the purposes of calcium quantification using electron beam CT in the early 1980s. Subsequently, methods for coronary CT angiography have been developed, allowing not only visualization of the coronary lumen, but also assessment of the coronary wall and atherosclerotic plaque characteristics. Initial studies demonstrating the clinical utility of CT coronary imaging were performed using 16 slice multidetector CT (MDCT) scanners.
These showed a reasonable accuracy for the detection of significant coronary stenosis when compared to invasive coronary angiography. Most of the clinical studies, however, showing the highest accuracy of CTA for the detection of CAD have used 64 MDCT technology. More recently, new CT technology including 256 MDCT, 320 MDCT, dual energy, and dual source MDCT have shown significant improvement in coronary CTA image quality and are very promising tools for improved assessment of CAD including vessel wall imaging.
INDICATIONS
Multiple studies have been performed to assess the accuracy of coronary CT for the diagnosis of CAD using both 16 and 64 slice MDCT, and more recently dual source CT scanners. The sensitivity, specificity, positive predictive value, and negative predictive value for the detection of significant coronary stenosis (greater than 50% luminal narrowing) have varied from 86% to 99%, 90% to 99%, 66% to 97%, and 92% to 100%, respectively (Table 38-1). The negative predictive value is the parameter that has been consistently high in these studies, with numbers approaching 100%. Applying this concept to clinical practice, the most important indication for coronary CTA is to exclude the presence of significant CAD.
Guidelines on appropriate criteria for the use of coronary CTA have been formulated by national and international radiology and cardiology societies (Table 38-2). In the outpatient setting, there is consensus that coronary CTA is indicated for patients who have a discrepancy between their pretest probability of having CAD based upon risk factors and clinical symptoms. For instance, coronary CTA is indicated for patients with a low risk of CAD who present with classic symptoms of angina. It may also be useful in patients who have moderate risk for CAD and present with equivocal symptomatology. Other accepted indications include coronary evaluation prior to major vascular surgery, aortic valvular replacement, and lung or liver transplant, among others.
In patients with acute chest pain, recent studies have shown that coronary CTA can accurately exclude acute coronary syndrome and can be used as a first line test leading to direct discharge from the emergency room. Coronary CTA has been used in patients with an intermediate risk for CAD presenting to the emergency room with chest pain and normal cardiac enzyme levels or normal/equivocal ECG findings. Recent studies in this particular clinical setting have shown that these patients can be safely discharged from the emergency room after a negative CTA or a CTA showing less than 25% stenosis of the coronary arteries. This approach has the potential to significantly reduce the cost of unnecessary hospital admissions for the diagnosis of possible acute coronary syndrome in patients with a low to intermediate risk for CAD. These patients account for the majority of those presenting with chest pain to emergency rooms. Guidelines on the use of CTA for acute chest pain have been recently published and recommend the use of this technique in patients with intermediate pretest probability of CAD, negative enzymes, and negative or equivocal ECG. It should be mentioned that multiple trials using coronary CTA for the exclusion of acute coronary syndrome are ongoing and changes to the current guidelines should be expected in the near future.
TABLE 38.1 Accuracy of CT for Detection of Significant Coronary Artery Stenosis Compared to Conventional Coronary Angiography
Coronary CTA images are acquired using MDCT technology. The two major technical challenges of coronary CTA are obtaining optimal spatial and temporal resolution, and at the same time trying to minimize three-dimensional (3D) reconstruction artifacts. Spatial resolution is primarily a function of the physics of the scanner and currently is in the range of approximately 0.4 mm. The greater the number of detectors, the longer the z-axis length of coverage per unit time, allowing for acquisition of images covering the entire heart in only 1 to 2 beats. Reducing the number of heart beats used for full cardiac coverage significantly reduces or eliminates misregistration artifacts on reconstructed images. Fast acquisitions with high temporal resolution decrease motion artifacts and provide higher image quality. Temporal resolution is primarily a function of gantry rotation speed. Based upon half-rotation scanning time techniques, it takes a minimum of one half a gantry rotation to produce an entire 3D dataset. The newer generation of scanners has significantly faster gantry rotation speeds than previous generations and thus improved temporal resolution. With the introduction of dual source CT, two separate gantries have introduced the possibility of quarter-rotation scanning providing sufficient projection data to image the entire heart with a minimum temporal resolution of approximately 83 ms. That being said, reasonable image quality can still be obtained with 16-detector MDCT technology. Sixty-four MDCT technology is currently the most commonly used platform, since it provides a good balance of cost and image quality. Advantages of the most advanced CT scanners with state-of-the-art technology such as 256 MDCT, 320 MDCT, dual energy, and dual source scanners are of higher image quality with the possibility of image acquisition without pharmacologic heart rate control.
TABLE 38.2 Clinical Indications for Coronary CTA
Detection of CAD
Acute chest pain
Intermediate pretest probability of CAD, normal or equivo cal ECG and negative serial enzymes
Chronic chest pain (angina)
Intermediate pretest probability of CAD
ECG uninterpretable
Unable to exercise or equivocal test results
Evaluation for coronary anomalies
Structure and function
Coronary artery mapping prior to repeat revascularization
Assessment of complex congenital heart disease
Cardiac Gating
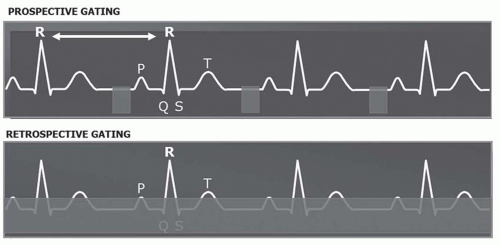
CT with cardiac gating has allowed for imaging of the heart while minimizing the blurring artifacts caused by cardiac motion. Visualization of the beating cardiac structures can be obtained using either a prospective or retrospective gating technique (Fig. 38.1). With prospective cardiac gating, the images are only acquired during a predetermined phase of the cardiac cycle, usually end-diastole. Retrospective cardiac gating technique acquires data throughout the entire cardiac cycle and allows the diagnostician to select, after the acquisition, the phases of the cardiac cycle to be used for reconstruction of the images. Retrospective gating has two major advantages. First, the phase of the cardiac cycle in which the coronary arteries are best visualized can be used for the evaluation of stenoses and production of the 3D reconstructions. This is not always at a predetermined phase of the cardiac cycle. Also, with retrospective gating cine loops can be used for the assessment of ventricular and valvular function.
FIG. 38.1. Diagram demonstrates the principles of prospective and retrospective cardiac gating. The top image shows an ECG trace including three consecutive heart beats (R-R intervals). CT acquisition occurs only during a short predetermined diastolic period (gray square) with prospective cardiac gating. On the bottom image CT acquisition occurs throughout the entire cardiac cycle (gray strip) with retrospective gating.
The other important difference between the two gating methods is the amount of radiation used. While prospective cardiac images can be obtained with very low radiation exposure, approaching 3 to 5 mSv, prospective images of the heart require a much higher radiation dose (approximately 12 to 15 mSv) that is similar to that used during invasive coronary angiography. Dual source CT with radiation reduction techniques has recently produced diagnostic CT coronary angiograms at less than 1 mSv.
Heart Rate Control
The optimal cardiac phase for imaging the coronary arteries is typically end-diastole. Patients with a low heart rate have a longer diastolic length than patients with fast heart rates. Therefore, heart rate management is essential for the acquisition of good quality coronary images. Beta-blockers are used to decrease the heart rate prior to a coronary CTA. In addition, these agents affect the heart rhythm and tend to stabilize the heart rate, which is essential for good image quality as imaging data is currently acquired over multiple cardiac cycles. It has been shown that patients with a heart rate lower than 60 bpm have significantly better image quality and less motion artifact compared to patients with higher heart rates. Various groups use oral b-blockers, intravenous b-blockers, or a combination of both. The most common protocol is to use oral β-blockers (Metoprolol 50 mg or Atenolol 100 mg) 1 hour prior to the imaging study, followed by intravenous fast acting β-blocker (usually Metoprolol) immediately before contrast administration if the heart rate is still above 60 bpm.
The Protocol
A complete cardiac CTA study starts with a noncontrast chest CT for the purposes of calcium scoring. These are continuous axial images with 2.5 to 3 mm thickness encompassing the entire heart using prospective gating (R-R interval of 75%) and a small field of view (25 cm2).
The contrast enhanced CT images are then acquired with prospective or retrospective gating, with the minimum slice thickness available (0.625 mm for a 64 detector CT), encompassing the entire heart with a small field of view (25 cm2). Rotation speed and temporal resolution depend on patient’s heart rate and scanner characteristics. Temporal resolution varies from 83 to 330 ms.
Contrast Injection
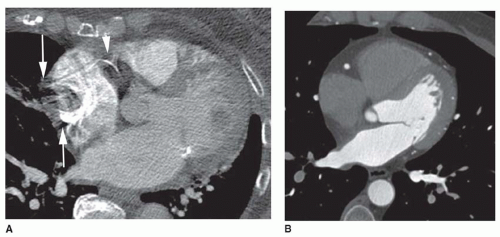
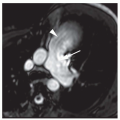
Optimal enhancement of the coronary arteries is the goal of contrast enhancement techniques for coronary CTA. In addition, avoiding streak artifact from dense contrast in the superior vena cava (SVC) and right atrium is essential for good visualization of the right coronary artery (RCA) in particular (Fig. 38.2). For this purpose, a saline flush is generally used after contrast administration in hopes of washing out the dense contrast in these chambers. A triple phase injection technique can also be used, consisting of standard concentration contrast followed by diluted contrast and finally a saline flush.
Good image quality can be obtained with either timing bolus or bolus tracking techniques. For bolus tracking, the region of interest is placed in the ascending aorta and the threshold is set for at least 100 HU. With the timing bolus technique, a test injection of 40 mL of contrast is administered followed by 40 mL of saline. This method allows for timing of not only the peak enhancement within the ascending aorta, but also for timing of peak enhancement of the SVC, which can be used to calculate the timing of the saline bolus. With both techniques, an injection rate of 5 mL/ second is recommended.
IMAGE POSTPROCESSING
Calcium score. There are multiple commercially available softwares for postprocessing of the calcium score. Following the Agatston score protocol, any pixel within the coronary arterial tree with a density higher than 130 HU is considered as containing calcium. A peak density factor is then multiplied to the area of calcification depending on the density of each of the identified pixels. The results are plotted against risk curves obtained from multiple cardiovascular disease population studies and the results are compared to an age and gender matched cohort. Results can be provided as an Agatston score (the most used parameter), calcium volume or volume score. Based on the calcium score and the percentile compared to the population curves, the risk of an obstructive coronary lesion is estimated. The American Heart Association has proposed guidelines on reporting and clinical recommendations for calcium score studies.
FIG. 38.2. Timing of contrast enhancement. A: Poor timing of the contrast injection is seen in this case, resulting in dense contrast enhancement of the right atrium producing streak artifacts (arrows). Note the poor visualization of the right coronary artery (arrowhead) due to the artifact. B: Ideal contrast injection protocol for a coronary CTA shows well-opacified left-sided cardiac chambers and coronary arteries. Contrast has been washed out of the right-sided cardiac chambers from the saline flush.
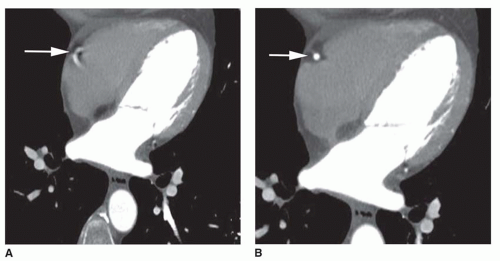
FIG. 38.3. Cardiac phase selection. A: Axial coronary CTA image obtained at 50% of the R-R interval shows motion artifact precluding visualization of the right coronary artery (arrow). B: Image reconstruction at 70% of the R-R interval shows no motion artifact and clear visualization of the right coronary artery (arrow).
Coronary CTA. The initial step for postprocessing of the coronary arteries is the selection of the cardiac phase with best image quality and least amount of motion artifact (Fig. 38.3). This is usually, but not always, approximately 70% of the R-R interval. In some cases, different cardiac phases must be used in the reconstruction of the right and left coronary arteries. This is often necessary in patients with high heart rates. In these patients the best quality images are often found earlier in the cardiac cycle, around 45% of the R-R interval. When a prospective acquisition technique is used, reconstructions are limited to a small window of the cardiac cycle thus this technique is best reserved for patients with well controlled heart rates.
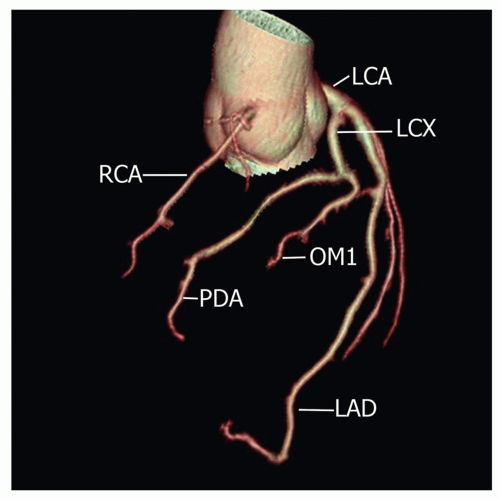
The most commonly used techniques for 3D reconstructions of the coronary arteries are 3D volume rendering, curved multiplanar reformated (MPR) image and cross-sectional images of the coronary arteries. Three-dimensional volume rendered reconstructions are useful for an overall depiction of the coronary artery anatomy and its relationship to the cardiac chambers (Fig. 38.4). It provides a good overview of the anatomy when bypass grafts are present. This technique is not particularly useful for visualization of specific coronary artery lesions. Curved MPR images are reconstructions performed in a plane aligned to the center of the coronary artery lumen. Multiple projections can be obtained encompassing 360 degrees of the vessel circumference, maintaining the plane aligned to the center of the coronary vessel (Fig. 38.5). This technique allows for accurate visualization of coronary lesions and depiction of the point of maximum stenosis. When a lesion is detected, cross-sectional images of the coronary artery can be obtained in a plane perpendicular to the curved maximum intensity projection (MIP) reconstruction plane, providing the best tool for determining the degree of stenosis (Fig. 38.6).
FIG. 38.4. Volume rendering. Three-dimensional volume rendered reconstruction of the coronary arteries. Note a very long left anterior descending (LAD) coronary artery with a transapical course. RCA, right coronary artery; LCA, left coronary artery; LCX, left circumflex coronary artery; OM1, first obtuse marginal branch of the left circumflex; PDA, posterior descending coronary artery.
IMAGE INTERPRETATION
Most of the findings on a coronary CTA can be identified on the axial images. Three-dimensional reformations are excellent tools for focused problem solving and for precise measurement of the degree of coronary stenosis. An ideal reading session involves interactive use of 3D workstations. The most useful reformats are the curved multiplanar reconstructions and the cross-sectional coronary views.
A systematic and comprehensive approach to interpreting a coronary CTA study should include calcium scoring and evaluation of the coronary arteries, followed by an assessment of other cardiac and extracardiac findings.
Calcium Scoring
The use of calcium scoring for CAD risk stratification is based on multiple research studies which have shown a correlation between the amount of calcium present in the coronary arteries and likelihood of significant coronary stenosis/cardiac death. This association is independent of other traditional risk factors for CAD. The relative risk of cardiac death in patients with a calcium score greater than 160 compared to those with a calcium score less than 160 is approximately 4.2 (95% confidence interval 1.6-11.3). It is known that the extent of atherosclerotic disease correlates with the amount of calcium in the coronary arteries (Fig. 38.7). Although the absence of coronary calcification does not exclude the presence of soft atherosclerotic plaque, the likelihood of an obstructive lesion is very low in these patients. The negative predictive value of coronary calcium screening is very high, with an estimated risk of 0.1% per year of developing a major cardiovascular event in 2 to 5 years.
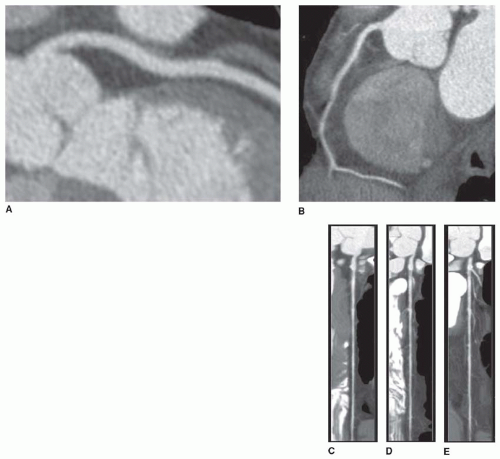
FIG. 38.5. Curved multiplanar reformation (MPR) of the left anterior descending (A) and right coronary (B) arteries. Liner reformation of the curved MPR shows multiple images (C-E) obtained during rotation along the curved MPR plane.
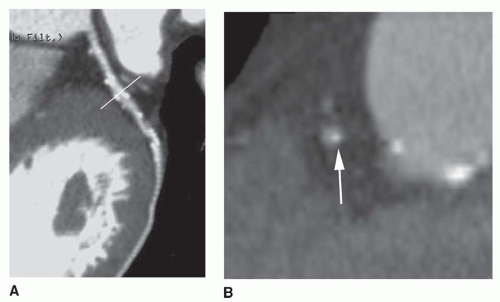
FIG. 38.6. Curved multiplanar reformation of the left anterior descending coronary artery shows multiple calcified and non-calcified atherosclerotic plaques (A). A plane (line) was prescribed for cross-sectional visualization of a calcified plaque. Cross-sectional reconstruction (B) shows an eccentric calcified plaque (arrow) with no significant luminal narrowing.
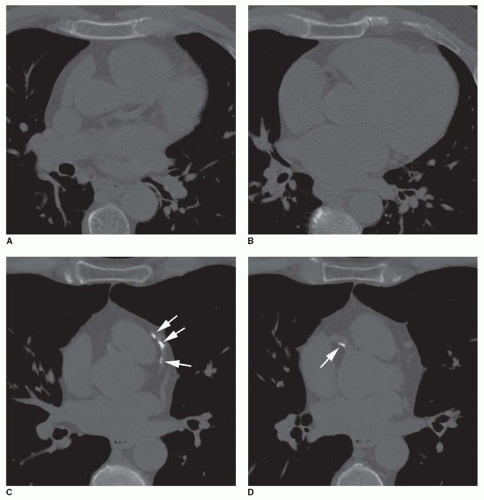
FIG. 38.7. Calcium score. Axial images from a two calcium score protocols in patients with no coronary calcium (A and B) and coarse coronary calcification (arrows) (C and D) with a calcium score of 500.
Calcium score and Framingham risk assessment have similar accuracy in predicting major cardiovascular events in 10 years. The added value of calcium scoring to the Framingham risk is an approximate 15% increase in accuracy for predicting a major cardiovascular event. Patients with an intermediate risk of CAD based on the Framingham score are most likely to benefit from undergoing coronary calcium scoring. A recent study has shown that intermediate risk patients with a calcium score greater than 300, have the same cardiovascular risk as patients in the high risk category and should be managed similarly. Additionally, this study showed that patients with an intermediate risk and a calcium score less than 300 have a low risk of cardiovascular events.
Coronary Artery Findings
Coronary assessment should begin by determining the coronary arterial dominance. A right dominant system is most common (80%) and characterized by a RCA which gives origin to both the posterior descending and posterolateral arteries (Fig. 38.8). A left dominant system, the second most common variant (15%), occurs when both the posterior descending and the posterolateral arteries originate from the left circumflex artery (Fig. 38.9). Finally a codominant circulation (5%) is seen when the posterior descending artery originates from the RCA and the posterolateral artery originates from the left circumflex artery (Fig. 38.10).
Only gold members can continue reading. Log In or Register to continue