Fig. 1
Setting up the Inspire software. (a) Cell classifiers panel with the area lower limit and area upper limit for channel 1 bright field selected (red box). Intensity lower limit of channel 7 is selected to collect events with a positive nuclear signal (green box), and the desired channels selected (yellow box). (b) Experimental set-up panel on the left of the user interface is highlighted. Acquisition parameters (red oval), illumination (green oval), and magnification with EDF filter (blue) are shown
3.
4.
Enable only those channels used in the experiment to minimize the electronic file size. In this protocol channels 1 (bright field, camera 1), 2 (CEP-SpectrumGreen), 6 (scatter), 7 (DAPI-nucleus), and 9 (bright field, camera 2) are enabled (see Fig. 1a, yellow box).
5.
6.
7.
8.
To acquire compensation controls enable all channels and turn off the bright-field illumination and scatter laser. The 405 and 488 nm lasers should remain on at the power used to acquire the test sample (Fig. 1b, green oval). A minimum intensity cell classifier is set at 1000 for the channel of interest (for SpectrumGreen it would be channel 2, and for DAPI, channel 7) (Fig. 2). Collect 500 positive events (see Notes 31 and 32 ).
Fig. 2
Setting classifiers for compensation controls. (a) Compensation classifiers for the SpectrumGreen probe that is detected in channel 2. All channels are enabled (yellow box) and an intensity lower limit of channel 2 is selected to collect events with a positive signal (red box). (b) Compensation classifiers for the DAPI nuclear dye that is detected in channel 7. All channels are again enabled and an intensity lower limit of channel 7 is selected to collect events with a positive signal (red box)
9.
Perform compensation post-acquisition in IDEAS® software according to standard procedure by making a compensation matrix (*.ctm) file based on the single-color controls.
10.
When opening the rif file for the test sample you will be prompted to apply the compensation (*.ctm) file to the analysis. Apply the *.ctm file prepared in step 9.
11.
The IDEAS® software will automatically create a compensated image file (*.cif) and a data analysis file (*.daf). Open the *.daf file to begin analysis.
12.
First perform a hierarchical gating strategy to select focused, single events, to which the CEP probe has successfully hybridized (Fig. 3 and see Note 33 ).
Fig. 3
Hierarchical gating strategy to select cells of interest. Single events are gated using area of the bright-field image (either in channel 1 or channel 9) versus aspect ratio of the bright-field image (aspect ratio close to 1 represents a single cell). Cells in focus are gated using gradient root mean squared of the bright-field image. Positively hybridized cells are gated using intensity of the SpectrumGreen signal versus raw max pixel of the SpectrumGreen signal (raw max pixel is a measure of the brightest pixel in the event). Very bright event to the right of the scatterplot are not included since, upon visual inspection, they represent doublet events that were insufficiently eliminated by the initial single cell gate
13.
Design a spot mask for the SpectrumGreen signal (Fig. 4). Optimize the radius and spot-to-background ratio of the mask on one cell but always check the efficiency of the mask on a selection of other cells to ensure the mask performs well for them all [11].
Fig. 4
Setting the spot mask. To accurately design a spot mask first the “bright” option must be checked. This ensures that the mask obtains the bright regions from an image regardless of any intensity differences from one spot to another. Next, alter the spot-to-background ratio and the radius of the spot mask to ensure that the mask covers the spots but does not include any background
14.
Apply the generated spot mask to the “Spot Count” feature for channel 2 (SpectrumGreen) and graph the spot count of the hybridized cells using a histogram (Fig. 5a).
Fig. 5
Correlation between spot count and ploidy and fluorescence intensity. (a) Cells that are positively hybridized are plotted on a histogram with the spot count feature with the appropriate spot mask applied. Each spot population is gated as shown. (b) Each spot population overlaid on a histogram of intensity of the SpectrumGreen signal
15.
The control sample (a healthy donor probed for CEP 8) should theoretically result in two spots in each cell but spot counts and ploidy are not necessarily directly correlated. Since the ISx captures a 2D image of a 3D cell in flow one spot may be the result of two spots in such close proximity that the software cannot distinguish them (see Note 34 ). Three or even four spots may be the result of a segregated hybridization signal and is a common occurrence also observed in conventional FISH (Fig. 6). The next steps will apply a fluorescence intensity parameter to correct spot counting deviations from ploidy.
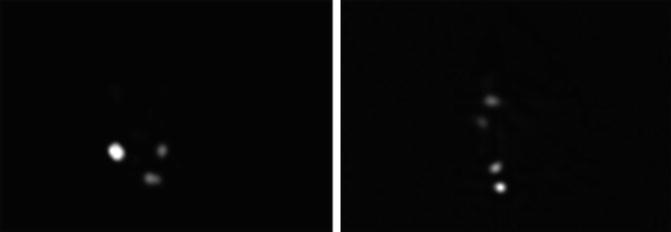
Fig. 6
Segregated hybridization signal. The images show CEP8 SpectrumGreen probe from a healthy donor where all events should contain two spots. Three spots (left image) or four spots (right image) can be observed but the intensity and proximity of the spots indicate that segregated hybridization has occurred. These examples would be classified as a disomy by conventional FISH
17.
 Quantitative Functional Morphology by Imaging Flow Cytometry
Principles of Amnis Imaging Flow Cytometry
Quantitative Functional Morphology by Imaging Flow Cytometry
Principles of Amnis Imaging Flow Cytometry
 Detection and Characterization of Rare Circulating Endothelial Cells by Imaging Flow Cytometry
 Assessment of Granulocyte Subset Activation: New Information from Image-Based Flow Cytometry
 Accurate Assessment of Cell Death by Imaging Flow Cytometry
 Screening for Drugs Against the Plasmodium falciparum Digestive Vacuole by Imaging Flow Cytometry


Draw an Intensity histogram of the SpectrumGreen signal for each population. True disomies whether counted as one, two, or three spots should have a similar fluorescence distribution (Fig. 5b and see Notes 35 ).
Related posts:
Quantitative Functional Morphology by Imaging Flow Cytometry
Principles of Amnis Imaging Flow Cytometry
Detection and Characterization of Rare Circulating Endothelial Cells by Imaging Flow Cytometry
Assessment of Granulocyte Subset Activation: New Information from Image-Based Flow Cytometry
Accurate Assessment of Cell Death by Imaging Flow Cytometry
Screening for Drugs Against the Plasmodium falciparum Digestive Vacuole by Imaging Flow Cytometry
Stay updated, free articles. Join our Telegram channel
Full access? Get Clinical Tree
