KEY FACTS
 Common causative organisms include Escherichia coli (E. coli) and streptococcus group B (newborns), Hemophilus (H. influenzae) (children <7 years), Neisseria (N. meningitides) (older children and adolescents), and Streptococcus (S. pneumoniae) (adults).
 Overall mortality (even with treatment) of meningitis is 10%.
 Viral agents (“lymphocytic” meningitis) include enteroviruses, mumps virus, Epstein-Barr virus, and arbovirus. Viral meningitis in adults is rare.
 Chronic meningitis is generally due to Mycobacterium tuberculosis or fungi.
 Diagnosis of meningitis is a clinical one, and by CSF analysis, imaging is reserved for complications.
 Mechanism of spread: hematogenous from paranasal sinus or mastoid infections, otitis media, penetrating head injury, and prior surgery.
 MRI is more sensitive than CT and shows leptomeningeal and/or ependymal enhancement (remember that durai enhancement at 3.0 T may be normal); fluid-attenuated inversion recovery (FLAIR) images show high signal in CSF (other causes of high CSF signal are high protein concentration (blood, tumor), susceptibility artifacts, oxygen administration, and some sedatives).
 Main differential diagnosis for leptomeningeal enhancement: metastases, sarcoidosis.
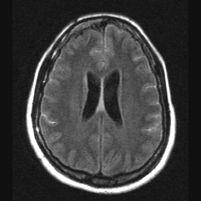
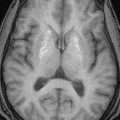
FIGURE 15-1. Axial FLAIR image shows high signal intensity in cortical sulci (compare with norma CSF signal in ventricles) due to proteins in CSF.
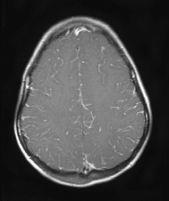
FIGURE 15-2. Axial postcontrast T1, in a different patient, shows leptomeningeal enhancement in cortical sulci.
SUGGESTED READING
Castillo M. Imaging of meningitis. Semin Roentgenol 2005;39:458–464.

KEY FACTS
 Suspect in young child with meningitis and progressively enlarging head; the most common complication is hydrocephalus.
 Sterile subdural effusions are more likely to be a complication of H. influenza meningitis and tend to be large, bilateral, and frontoparietal.
 About 2% of subdural effusions become infected (empyemas).
 Most effusions resolve spontaneously (large ones may require drainage).
 Both effusions and empyema show membrane enhancement.
 Empyemas occur in 15% of patients with meningitis; may also be secondary to sinusitis, postsurgical, or secondary to infection of an epidural hematoma.
 Complications from empyemas and/or meningitis include venous thrombosis, infarctions, cerebritis, ventriculitis, and abscesses.
 Empyemas may be identified by high signal on DWI (most reliable imaging technique); this high signal is due to restricted diffusion secondary to complex environment of pus (inflammatory cells, products of cell death, bacteria).
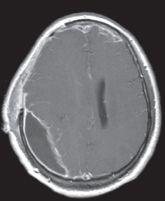
FIGURE 15-3. Axial postcontrast T1 shows a posterior subdural collection with enhancing walls.
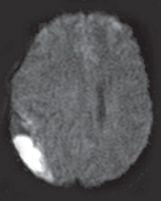
FIGURE 15-4. Corresponding DWI shows high signal from collection that was pus-filled.
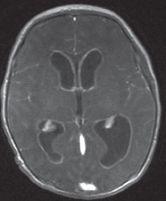
FIGURE 15-5. Axial postcontrast T1, in a different patient, shows diffuse enhancement of ventricular walls compatible with ventriculitis.
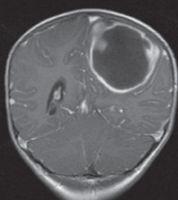
FIGURE 15-6. Coronal post contrast T1, in a different patient, shows a large left-sided abscess.
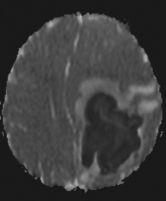
FIGURE 15-7. Axial ADC map, in the same patient as 15-6, shows restricted diffusion in pus.
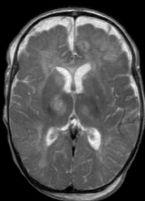
FIGURE 15-8. Axial T2, in a different patient, shows subdural collections bifrontally and areas of high signal in thalami.
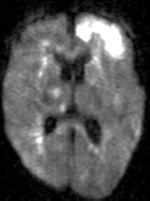
FIGURE 15-9. Corresponding DWI shows multiple infarctions.
SUGGESTED READING
Castillo M. Magnetic resonance imaging of meningitis and its complications. Top Magn Reson Imaging 1994;6: 53–58.

KEY FACTS
 Uncommon, generally seen in males between ages 10 and 30 years, particularly those with AIDS (however, 25% occur in children <15 years old).
 Mortality is 20% despite antibiotics. Ninety percent of all cerebral abscesses are bacterial in nature.
 Sources: sinusitis, otitis media, meningitis (particularly in children), penetrating head injury, and hematogenous spread from remote source (occasionally seen in patients with cyanotic cardiac disease and pulmonary arteriovenous malformations (AVMs).
 Locations: temporal, frontal, and parietal lobes.
 Early cerebritis occurs during the initial 5 days; late cerebritis (with central necrosis) occurs from 4 to 11 days; early capsule formation (incomplete abscess) occurs from 10 to 18 days; mature abscess is seen from days 14 to 19, and rim enhancement (in intact abscesses) may persist for up to 8 months.
 MRI features of cerebral abscesses include a capsule of low T2/FLAIR and slightly bright precontrast Tl signal intensity, a smooth-appearing capsule, greater thickness of the side of the capsule neighboring gray matter, and surrounding vasogenic edema.
 DWI: restricted diffusion in cavity is typical of bacterial abscesses but may be less prominent in those due to TB, toxoplasmosis, or fungi. DWI may be useful in posttherapy follow-up of abscesses; persistent high DWI may indicate treatment failure.
 Perfusion studies show low blood flow.
 MRS shows low choline, creatine, and NAA, high lipids/lactate, high amino acids (succhiate, acetate, alanine, and glycine).
 Main differential diagnosis: primary and secondary tumors.
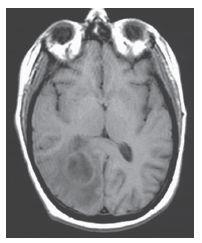
FIGURE 15-10. Axial noncontrast T1 shows a right occipital abscess with a slightly bright capsule.
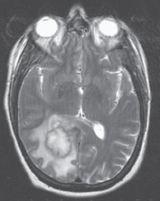
FIGURE 15-11. Corresponding T2 shows the capsule to be dark (possibly due to free oxygen radicals) and surrounding edema.
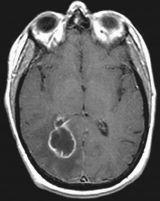
FIGURE 15-12. Corresponding postcontrast T1 shows thin smooth enhancing capsule with extension in the adjacent ventricle and ependymitis.
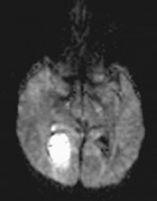
FIGURE 15-13. Corresponding DWI shows the central pus to be bright.
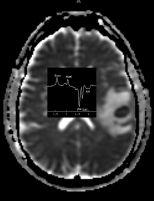
FIGURE 15-14. Axial ADC map, in a different patient, shows the left temporal abscess to have very restricted diffusion centrally and surrounding edema. MRS shows lipids/lactate and succinate/acetate. (Case courtesy of D. Camacho, Milwaukee, Wisconsin.)
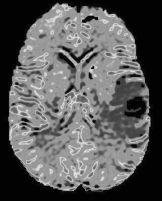
FIGURE 15-15. Corresponding MR rCBV map shows low perfusion in lesion. (See color insert)
SUGGESTED READING
Cartes-Zumelzu FW, Stavrou I, Castillo M, Eisenhuber E, Knosp E, Thumher MM. Diffusion-weighted imaging in the assessment of brain abscesses therapy. Am J Neuroradiol 2004;25:1310–1317.
Pal D, Bhattacharyya A, Husain M, Prasad KN, Pandey CM, Gupta RK. In vivo proton MR spectroscopy evaluation of pyogenic brain abscesses: a report of 194 cases. Am J Neuroradiol 2010;31:360–366.

KEY FACTS
 Herpes type I: Occurs in adults from primary infection or reactivation (dormant virus in trigemina! ganglion or lower cranial nerves); accounts for >90% of all viral encephalitis; mortality is 50% to 70%, and produces necrotizing encephalitis in the insula and orbital surface of frontal lobes (may be bilateral); the brain stem is occasionally involved; hemorrhagic transformation is common. Best imaging techniques are FLAIR and DWI (which may be more sensitive and demonstrate extent of disease better).
 Herpes type H: Results from direct inoculation during vaginal delivery (especially in premature babies); produces a dimise meningoencephalitis, which may involve the cerebellum, and the end result is cystic malaria and atrophy.
 Cytomegalovirus (CMV): Although rare, it is the most common transplacental encephalitis; most patients remain asymptomatic but may have microcephaly (50% to 75%), mental retardation, deafness, seizures, and intracranial calcifications (70%) including those in perforating arteries; it affects the germinal matrix resulting in neuronal migration anomalies, and produces a chorioretinitis and micro-ophalmia (more common with CMV than with toxoplasmosis); it may occur in patients with AIDS. In adults, the most common findings are focal areas of cerebritis accompanied by overlying meningea! enhancement.
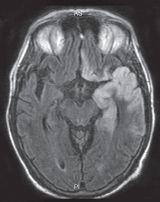
FIGURE 15-16. Axial FLAIR image shows high signal in the cortex of the left temporal lobe and ipsilateral gyrus rectus typical of HSV 1 infection.
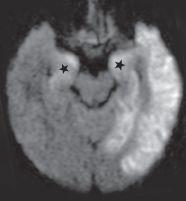
FIGURE 15-17. In the same patient, corresponding DWI shows better the extent of the infection as high signal intensity particularly in gray matter. Note the typical involvement of amygdalae (stars).
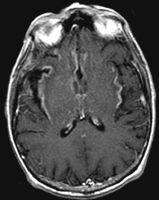
FIGURE 15-18. Axial postcontrast T1, in a different patient, shows enhancement in insular cortices and basal frontal lobes.
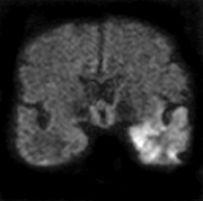
FIGURE 15-19. Coronal DWI, in a different patient, shows unilateral high signal in the left temporal lobe.
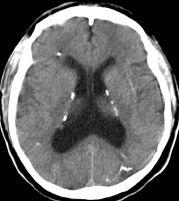
FIGURE 15-20. Axial CT, in a patient with congenital CMV, shows periventricular calcifications, hydrocephalus, and thickened cortex.
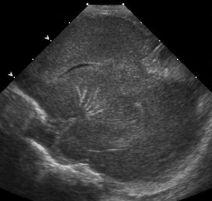
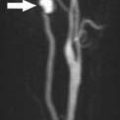
FIGURE 15-21. Sagittal oblique sonogram shows a branching pattern of calcification involving the enticulostriate arteries.
SUGGESTED READING
Castillo M, Thumher M. Imaging viral and prion infections. Semin Roentgenol 2005;39:482–494.
 HUMAN IMMUNODEFICIENCY VIRUS INFECTION
KEY FACTS
 In children, maternal transmission accounts for majority of cases; 2% of all AIDS patients are children; most children die early in life, and the brain shows basal ganglia calcifications (appearing generally after 12 months of age), atrophy, and microcephaly.
 In adults, HIV produces a subacute encephalitis characterized by demyelination, gliosis, and multi-nucleated giant cells; it constitutes the initial presentation in 10% of AIDS patients and eventually develops in up to 60% of them, leading to the AIDS dementia complex.
 In adults, MR shows confluent, ill-defined areas of high signal intensity on T2/FLAIR, especially in the white matter of the frontal and parietal lobes (may involve the corpus callosum); these lesions do not enhance; there is diffuse atrophy (particularly cortical); occasionally, HIV results in an aseptic meningitis and produces meningeal enhancement. In 10% of patients, posterior fossa involvement occurs, particularly in middle cerebellar peduncles. Occasionally, gray matter involvement is present.
MRS may initially show elevation of choline and low NAA; with chronicity, all metabolites become low.
 The abnormal signal intensity in the white matter of adults may improve or even resolve after treatment.
 Main differential diagnosis in adults: progressive multifocal leukoencephalopathy (PML).
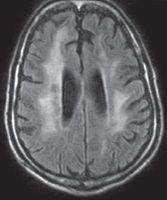
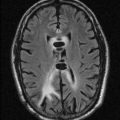
FIGURE 15-22. Axial FLAIR shows high signal in white matter of both hemispheres, cortical atrophy, and ventricular dilation.
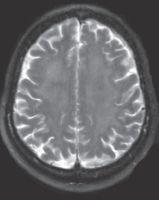
FIGURE 15-23. Axial T2 in a different patient, shows diffuse and subtle high signal in the white matter bihemispherically.
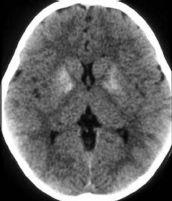
FIGURE 15-24. Axial CT shows calcification of basal ganglia in a baby at 1 year of age with congenital AIDS.
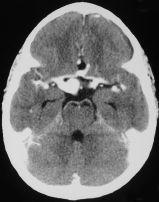
FIGURE 15-25. Axial postcontrast CT, in a different patient, shows dilated vasculopathy of AIDS These same findings can be seen with infections of the arterial wall by other pathogens. (Courtesy H. Alvarez, Chapel Hill, NC).
SUGGESTED READING
Thumher MM, Schindler EG, Thumher SA, Pemerstorfer-Schön H, Kleibl-Popov C, Rieger A. Highly active antiret-roviral therapy for patients with AIDS dementia complex: effect on MR imaging findings and clinical course. Am J Neuroradiol 2000;21:670–678.
 PROGRESSIVE MULTIFOCAL LEUKOENCEPHALOPATHY
KEY FACTS
 PML is usually due to reactivation of the papovavirus and is seen in 1% to 4% patients with AIDS; other patients at risk are those with organ transplants, Hodgkin lymphoma, chronic lymphocytic leukemia, congenital immunodeficencies, lupus erythematosus, sarcoidosis, amyloidosis, and scleroderma and those receiving steroids.
 PML destroys oligodendrocytes, leading to demyelination.
 Imaging studies show peripheral white matter abnormalities (usually occipitoparietal and less likely frontal), which may be symmetrical, have little or no mass effect, and show no enhancement. Perfusion studies show low blood flow.
 MRS shows high choline and low NAA and lactate initially and then is followed by pan metabolite decrease and presence of lipids.
 Up to 50% of patients may have involvement of gray matter structures (especially basal ganglia and thalamus).
 Some lesions may improve after treatment.
 Main differential diagnosis:HIV
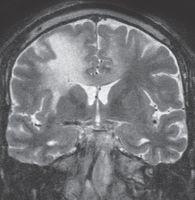
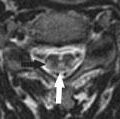
FIGURE 15-26. Coronal T2 shows high signal in white matter of both hemisphere and corpus cal-losum. Note involvement of the entire thickness of white matter and thinning of overlying cortex.
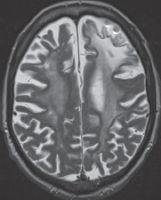
FIGURE 15-27. Axial T2 in a patient with PML as complication of rheumatoid arthritis treatment shows diffuse white matter involvement more pronounced in the left frontal lobe.
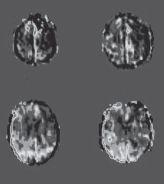
FIGURE 15-28. Axial arterial spin labeling perfusion images, in the same patient shown in 15-27 show low CBF in affected white matter. (See color insert)
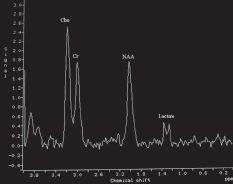
FIGURE 15-29. MRS, long TE, in a different patient at the start of the disease shows mildly elevated choline and low NAA and lactate.
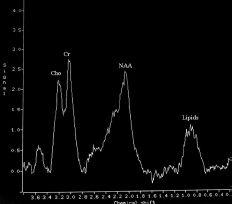
FIGURE 15-30. MRS, long TE, in the same patient as 15-29 during chronic part of the disease, shows decreased levels of choline and NAA and lipids.
Related posts:
Stay updated, free articles. Join our Telegram channel

Full access? Get Clinical Tree


