KEY FACTS
 Account for 10% to 30% of cerebral gliomas in adults.
 Histologically, low-grade astrocytomas are fibrillary (diffuse), and over 80% eventually degenerate to anaplastic astrocytoma and GB (particularly those with TP53 mutation).
 Usually occur in the cerebral hemispheres at age 20 to 45 years.
 Median survival rate varies between 4 and 10 years.
 10% to 20% of low-grade astrocytomas show calcification by CT; all are hyperintense on MR T2/FLAIR; contrast enhancement may be absent or mild; edema and hemorrhage are rare.
 They show no increased rCBV on MR and/or CT perfusion studies.
 MRS: high myoinositol, moderately elevated choline, low NAA, no lipids/lactate (spectra are normal in edema).
 DTI: no invasion of neighboring white matter tracts.
 Main differential diagnosis: other astrocytoma, cerebritis, vasculitis, sequelae of seizures.
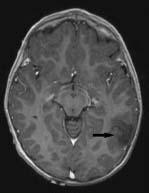
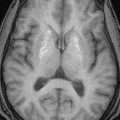
FIGURE 14-1. Axial postcontrast T1e shows non-enhancing mass (arrow) of low signal in the posterior left temporal region.
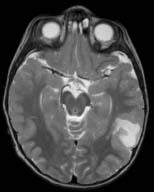
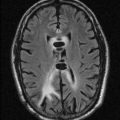
FIGURE 14-2. Corresponding T2 shows that trv bright lesion involves white and gray matter, is well-demarcated, and has no surrounding edema.
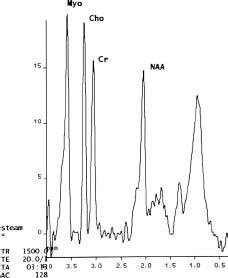
FIGURE 14-3. Short-TE MRS shows high myoinositol (Myo).
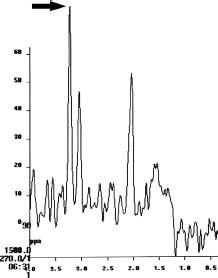
FIGURE 14-4. Long-TE MRS shows high choline (arrow) and low NAA (at 2.0 ppm).
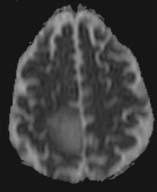
FIGURE 14-5. Axial ADC map, in a different patient, shows no restricted diffusion In the right posterior frontal low-grade astrocytoma.
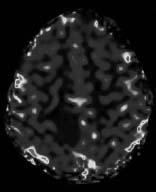
FIGURE 14-6. Corresponding MR rCBV map shows low perfusion in tumor. (See color insert)
SUGGESTED READING
Law M, Yang S, Wang H, Babb JS, Johnson G, Cha S, et al. Glioma grading: sensitivity, specificity, and predictive values of perfusion MR imaging and proton MR spectroscopie imaging compared with conventional MR imaging. Am J Neuroradiol 2003;24:1989–1998.

KEY FACTS
 Account for 30% of cerebral gliomas ( frontal, parietal, temporal, occipital) in adults (40 to 60 years of age).
 Prognosis is poor; median survival rate is 2 years.
 Histologically, they contain gemistocytes and protoplasmic elements but no necrosis.
 Dissemination that occurs through the white matter tracts (invasion is evidenced by DTI with low fractional anisotropy in abnormal tracts), ependyma, and subarachnoid space is relatively common.
 Imaging studies show them as an inhomogeneous mass, surrounded by edema, and sometimes peripheral and/or central areas of enhancement. Contrast enhancement must be considered Grade IV tumor until proven otherwise.
 >rCBV by MR and CT perfusion studies.
 MRS: low myoinositol, high choline, low NAA, lactate (particularly peripherally reflecting zones of ischemia and angiogenesis), no lipids (abnormal spectra in edema may occur).
 Main differential diagnosis: glioblastoma, lower grade astrocytoma, cerebritis, atypical infarction, herpes encephalitis.
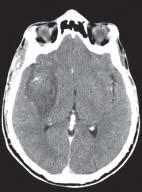
FIGURE 14-7. Axial postcontrast CT shows a low-density mass in the right frontotemporal region with some enhancement anteriorly.
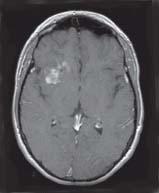
FIGURE 14-8. Postcontrast axial T1, in the same patient, shows enhancement in the right subinsular frontal region.
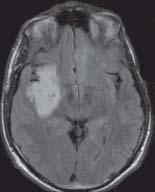
FIGURE 14-9. Axial FLAIR image in the same patient shows a bright lesion involving white and gray matter.
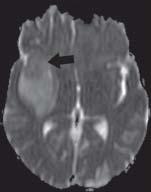
FIGURE 14-10. Axial ADC map in the same patient shows restricted diffusion (arrow) in the enhancing portion of the tumor.
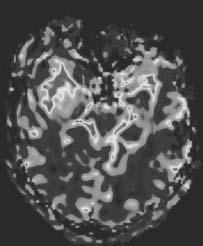
FIGURE 14-11. Axial MR perfusion rCBV map in the same patient shows increased perfusion in the enhancing part of the mass. (See color insert)
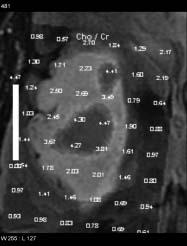
FIGURE 14-12. Choline to creatine MRS map in the same patient displays in red areas of highly elevated choline in the central part of the tumor. (See color insert)
SUGGESTED READING
Law M, Yang S, Babb JS, Knopp EA, Golfinos JG, Zagzag D, et al. Comparison of cerebral blood volume and vascular permeability from dynamic susceptibility contrast-enhanced perfusion MR imaging with glioma grade. Am J Neuroradiol 2004;25:746–755.

KEY FACTS
 Accounts for >50% of cerebral gliomas in adults (the most common brain tumor in adults, males: 3:2).
 Prognosis is poor; most patients expire 8 to 16 months after diagnosis.
 Necrosis, neovascularity, and cellular pleomorphism are typical histological features of GB.
 Most GBs arise in white matter of cerebral hemispheres (frontal, temporal, parietal, corpus callosum) in males >50 years of age.
 Imaging studies often reveal a typical nodular rim enhancement; edema is generally present, hemorrhage may occur, calcifications are rare, and 10% occur in multiple sites.
 They have high rCBV and rCBF in MR and CT perfusion studies.
 DWI: low ADC. SWI shows intra-tumoral blood vessels.
 DTI: invasion with loss of fractional anisotropy in adjacent white matter.
 MRS: very low myoinositol, high choline, very low NAA lipids and lactate (abnormal spectra in edema and even normal-appearing brain).
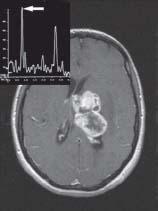
FIGURE 14-13. Axial postcontrast T1 shows an irregular/nodular enhancing mass in the deep aspect of the left hemisphere. Long-TE MRS (insert) shows very high choline (arrow) peak.
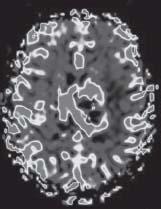
FIGURE 14-14. Corresponding MR perfusion rCBV map shows increased blood volume in the mass. (See color insert)
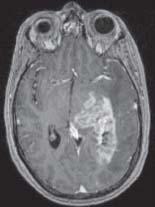
FIGURE 14-15. Axial postcontrast T1, in a different patient, shows a large enhancing mass in the left temporo-occipital region.
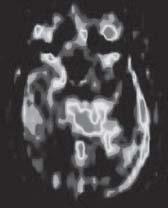
FIGURE 14-16. Corresponding arterial spin labeling CBF map shows high tumor perfusion. (See color insert)
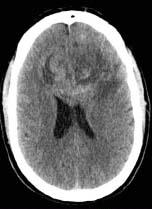
FIGURE 14-17. Axial noncontrast CT, in a different patient, shows a large hyperdense mass involving the frontal lobes and callosal genu in a “butterfly” fashion.
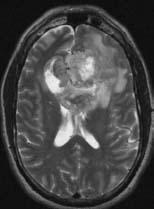
FIGURE 14-18. Corresponding T2 shows the solid tumor to be hypointense and necrosis bright.
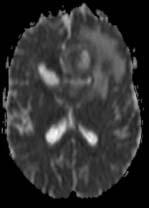
FIGURE 14-19. Corresponding ADC map shows restricted diffusion in the solid tumor.
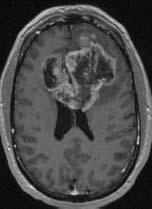
FIGURE 14-20. Corresponding postcontrast T1 mage shows irregular/nodular marginal tumor enhancement.
SUGGESTED READING
Law M, Yang S, Wang H, Babb JS, Johnson G, Cha S, et al. Glioma grading: sensitivity, specificity, and predictive values of perfusion MR imaging and proton MR spectroscopie imaging compared with conventional MR imaging. Am J Neuroradiol 2003;24:1989–1998.

KEY FACTS
 Rare disorder found predominantly in older males.
 Diffuse astrocytoma infiltrating two or more cerebral lobes.
 May contain areas of WHO grade 2 and 3, and rarely of WHO grade 4.
 Begins in white matter with widening of tracts and then extends diffusely.
 Contrast enhancement may be minimal or absent.
 MRS shows moderately high myoinositol, high choline (occasionally choline levels may be normal), lowNAA.
 MR and CT perfusion shows low-to-normal rCBV
 Main differential diagnosis: lymphoma, demyelinating disease, other astrocytoma, encephalitis, vasculitis, PML.
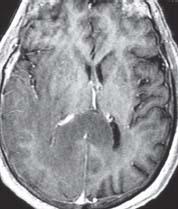
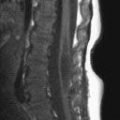
FIGURE 14-21. Axial postcontrast T1 shows low intensity in the right temporo-occipital regions and in the splenium, which is also thick. Note absent enhancement.
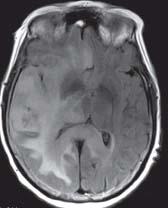
FIGURE 14-22. Corresponding FLAIR image shows extension of bright tumor to a better degree.
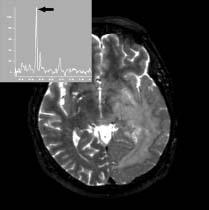
FIGURE 14-23. Axial T2, in a different patient, shows high signal in the left temporooccipita region with infiltration of basal ganglia. Long-TE MRS (insert) shows high choline (arrow) and low NAA.
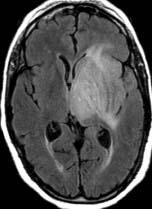
FIGURE 14-24. Axial FLAIR, in a different patient, shows a tumor in the left frontal and tempora regions with diffuse infiltration of gray matter structures.
SUGGESTED READING
Yip M, Fisch C, Lamarche JB. AFIP archives: gliomatosis cerebri affecting the entire neuraxis. RadioGraphics, 2003;23:247–253.

KEY FACTS
 Accounts for <5% of cerebral gliomas in adults, generally found during fifth to sixth decades of life; more common in men.
 Five-year survival is 75% for pure oligodendroglioma.
 Fifty percent are histologically “mixed” and contain neoplastic astrocytes (called an “oligoastrocy-toma,” which is identical to oligodendroglioma on imaging studies); growth is very slow.
 >85% are supratentorial.
 They involve the subcortical white matter in the frontotemporal regions (also in temporal and occipital lobes and the corpus callosum).
 Most common symptom: seizures (due to early cortical involvement).
 Most common intracranial tumor to calcify (70%), may cause scalloping of inner table of skull (17%); cysts are present in 20%; hemorrhage occurs in 20%, and contrast enhancement in 50%.
 Their high (paroxical) rCVB is due to dense capillary network; thus, it does not reflect higher histological grade but correlates with deletions in chromosomes lp and 19q which portray a better prognosis.
 MRS in low-grade oligodendroglioma: moderate-to-high myoinositol, moderate-to-high choline, low NAA, no lipids/lactate. When high grade, there are elevated choline and lactate/lipids. DWI: no restriction of diffusion when low grade.
 Main differential diagnosis: ganglioglioma, astrocytoma, DNET, PXA, arteriovenous malformation.
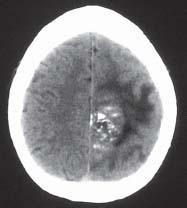
FIGURE 14-25. Axial CT shows a mass containing calcifications and surrounding edema in the medial left frontoparietal region.
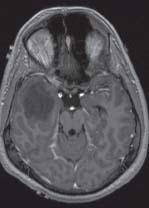
FIGURE 14-26. Axial postcontrast T1, in a different patient, shows a nonenhancing tumor in the right temporal lobe.
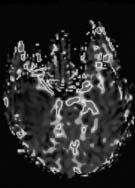
FIGURE 14-27. MR rCBV map in same patient as 14-26 shows no increased perfusion. (See color insert)
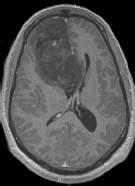
FIGURE 14-28. Axial postcontrast T1, in a different patient, shows large low-grade mixed oli-goastrocytoma that does not enhance in the right frontal region.
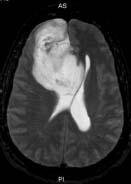
FIGURE 14-29. T2 image in same patient as 14-28 shows the tumor to be mostly bright, wel demarcated, and with no surrounding edema.
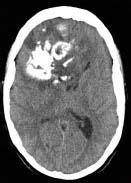
FIGURE 14-30. Axial noncontrast CT, in a different patient, shows a large calcified right frontal tumor involving the genu of the corpus callosum.
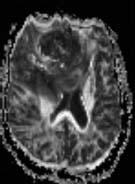
FIGURE 14-31. Axial ADC map in the same patient shows low signal from the lesion, which is a combination of the calcifications and true restricted diffusion.
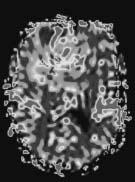
FIGURE 14-32. Axial MR perfusion rCBV map shows in same patient high perfusion in this ana-plastic oligodendroglioma. (See color insert)
SUGGESTED READING
Lev MH, Ozsunar Y, Henson JW, Rasheed AA, Barest GD, Harsh GRIV et al. Glial tumor grading and outcome prediction using dynamic spin-echo MR susceptibility mapping compared with conventional contrast-enhanced MR: confounding effect of elevated rCBV of oligodendrogliomas. Am J Neuroradiol 2004;25:214–221.
 EPENDYMOMAS AND SUBEPENDYMOMAS
KEY FACTS
 Ependymomas: Supratentorial ependymomas are generally tumors of adults. Locations: cerebral hemispheres (30% to 40% of all ependymomas) and 50% to 80% of supratentorial ependymomas are parenchymal (arising from ependymal cell rests) and are located in frontoparietal regions, many times adjacent to ventricles. Nonspecific appearance is indistinguishable from astrocy-toma. May also arise in lateral or third ventricles. Main differential diagnosis: oligodendroglioma, astrocytomas, métastases.
Related posts:
Stay updated, free articles. Join our Telegram channel

Full access? Get Clinical Tree


