Reference vessel diameter (mm)
MLA (mm2)
Sensitivity (%)
Specificity (%)
IVUS
<3.0
<2.4
63
67
3.0–3.5
<2.7
58
75
>3.5
<3.6
57
71
OCT
≥3.0
1.95
82
63
<3.0
1.62
80
83
Fig. 11.1
IVUS evaluation of a lesion having an intermediate stenosis severity. A 68 year-old male underwent catheterization for the evaluation of acute chest pain. Angiography of the right coronary artery demonstrated an intermediate stenosis in the mid-RCA (a). IVUS was used to further interrogate the lesion with the intent to defer PCI if the MLA was >4.0 mm2. Such a strategy is support by the concept that lesions having an MLA >4.0 mm2 are rarely associated with a significant FFR result and are associated with a low rate of future cardiac events. The IVUS frame having the most severe stenosis within the lesion is shown (b). The MLA at the most severe stenosis site was found to be 3.05 mm2 (c). Owing to the poor specificity of an MLA <4.0 mm2 to identify lesions that are hemodynamically significant, an MLA <4.0 mm2 should not be used to justify PCI. Consequently, FFR was performed to further evaluate the hemodynamic significance of the lesion and generated an FFR value of 0.85 (d). As a result, PCI was not performed and the patient was treated with medical therapy. FFR fractional flow reserve, IVUS intravascular ultrasound, MLA minimal luminal area, PCI percutaneous coronary intervention, RCA right coronary artery
Clinical Application of IVUS MLA in the Left Main
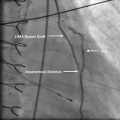
Analogous to studies performed in non-left main locations, several studies have compared IVUS MLA and FFR values in the assessment of intermediate severity stenoses in the left main coronary artery [18, 19]. Although a left main MLA of 7.5 mm2 has been established as the lower range of normal [20], this threshold should not be used as a surrogate for hemodynamic significance. The optimal MLA threshold in the left main to identify a hemodynamically significant lesion by FFR analysis was <5.9 mm2 in one study [18] and was <4.8 mm2 in another [19]. Unlike the optimal thresholds in non-left main locations, these MLA thresholds in the left main are characterized by higher sensitivities and specificities for hemodynamic significance [18]. Lending further support to an IVUS-based approach to assess intermediate stenoses in the left main, a prospective multicenter study has demonstrated that deferring PCI on left main lesions with a MLA ≥6.0 mm2 is associated with a favorable clinical outcome [21]. A detailed review of IVUS use to assess intermediate left main lesions has been recently published [22].
Clinical Application of OCT MLA
Analogous to studies comparing IVUS with FFR, OCT has also been directly compared with FFR for the assessment of lesions intermediate stenosis severity [12, 23]. In a study by Gonzalo et al. [12], the optimal OCT-derived MLA to identify an FFR ≤0.80 was 1.95 mm2, characterized by a sensitivity of 82 % and specificity of 63 % (Table 11.1). Due to this limited specificity, the presence of an MLA less than 1.95 mm2 by OCT does not justify performance of PCI. Rather, such lesions should be further evaluated with FFR to determine hemodynamic significance. When using OCT to evaluate lesions of intermediate stenosis severity in vessels having a reference diameter <3.0 mm, a threshold MLA of 1.62 mm2 has been found to be the optimal threshold for identifying lesions having an FFR ≤0.80 [12].
There are several important considerations regarding the use of OCT to evaluate lesions of intermediate stenosis severity. The fact that these OCT-derived MLA thresholds are smaller than those of IVUS is consistent with the concept that OCT generates smaller vessel measurements than IVUS [9, 10]. Although the sensitivities of the OCT-derived MLA thresholds are higher than those reported by many IVUS studies [12], longitudinal prospective OCT studies have not been performed to demonstrate the safety of deferring PCI in the setting of a particular MLA. Finally, due to the limited ability of OCT to evaluate ostial lesions, assessment of left main lesions with OCT may be difficult, especially in the case of ostial and proximal left main lesions. To date, no OCT studies comparing MLA and FFR values for left main lesions have yet been performed.
Intracoronary Imaging for Stent Selection
Once the decision has been made to perform PCI on a target lesion, IVUS and OCT can be utilized in a similar fashion to guide stent selection. Because stent selection requires both stent diameter and a stent length, measurements of the proximal and distal reference vessel diameters and the lesion length are the most useful imaging parameters to aid with stent selection. Whether using IVUS or OCT, these linear measurements are highly reproducible.
Intracoronary Imaging to Assess the Risk of Peri-Procedural Myocardial Infarction and Angiographic No-Reflow
Periprocedural Infarction and No-Reflow
Associated with both short- and long-term mortality, peri-procedural myocardial infarction and angiographic no-reflow remain common complications in contemporary PCI [24–29]. In many cases, these complications are triggered by the embolization of plaque contents that are liberated from the target lesion during PCI [24–29]. Thus, the underlying morphology and composition of the underlying target plaque plays a role in determining PCI risk. Importantly, the risk of angiographic no-reflow and peri-procedural myocardial infarction can be assessed prior to PCI by using intracoronary imaging with IVUS, OCT, or NIRS in order to scrutinize the target lesion for certain high risk features [30].
IVUS Predictors of Acute PCI-Related Complications
Several morphologic characteristics, when identified by greyscale IVUS at the target lesion prior to PCI, have been shown to be associated with an increased risk of peri-procedural myocardial infarction or angiographic no-reflow. These IVUS findings include include attenuated plaque, larger plaque burden, positive remodeling, a lipid pool-like image, and intracoronary thrombus [30]. Of these, attenuated plaque, which is defined by the presence of attenuation of the ultrasound signal in the absence of overlying calcification (Fig. 11.2), has been shown to be the strongest independent predictor of no-reflow [31] and in another study to be the only independent IVUS predictor of peri-procedural myocardial infarction [32]. Furthermore, it has been demonstrated that the extent of attenuated plaque by IVUS, rather than just its mere presence, predicts procedural complications during PCI [33, 34].
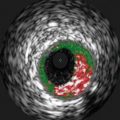
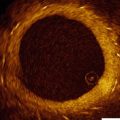
Fig. 11.2
Attenuated plaque by IVUS. Attenuated plaque by IVUS is defined as attenuation of the ultrasound signal in the absence of overlying calcification (asterisks, a). The presence of attenuated plaque at the culprit site is an independent predictor of angiographic no-reflow and peri-procedural myocardial infarction during PCI. Attenuated plaque should not be confused with attenuation of the ultrasound signal (asterisks) secondary to overlying calcification (red arrows, b). IVUS intravascular ultrasound, PCI percutaneous coronary intervention
Similar to greyscale IVUS, virtual histology (VH)-IVUS is also capable of assessing the risk of acute PCI-related complications. When found at the target lesion prior to PCI, VH-IVUS necrotic core, which is color-coded as red on the VH-IVUS images, has been associated with an increased risk of angiographic no-reflow, peri-procedural myocardial infarction, and distal embolization during PCI [35–39].
OCT Predictors of Acute PCI-Related Complications
Due to its superb spatial resolution, OCT is the only currently available intracoronary imaging modality capable of visualizing the thickness of the fibrous cap overlying a coronary atheroma. A fibrous cap is considered “thin” by OCT if its thickness is <65–70 μm [40–42]. Using this definition, an OCT-derived thin-cap fibroatheroma (TCFA) is defined by the presence of a thin-fibrous cap overlying a lipid-rich plaque (Fig. 11.3), which in turn is defined as lipid spanning at least two quadrants on a cross-sectional image [40–42].
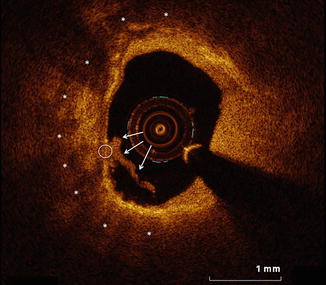
Fig. 11.3
OCT-defined thin-capped fibroatheroma at a culprit site in a patient presenting with an acute coronary syndrome. OCT imaging was performed for PCI planning within the culprit vessel of a patient who presented with an acute coronary syndrome. A representative frame from within the culprit lesion is shown. Lipid, evident by OCT as low-attenuation regions with poorly defined borders (asterisks), is present and involves greater than two quadrants of the image. The fibrous cap overlying the lipid measures less than 65 μm in the region highlighted by the white circle. The concomitant presence of these features is consistent with an OCT-defined TCFA. Identification of a TCFA has been shown to be the strongest OCT predictor of periprocedural myocardial infarction. Furthermore, a lipid arc spanning >180°, as shown in this image, is a strong predictor of the occurrence of angiographic no-reflow during PCI. OCT optical coherence tomography, PCI percutaneous coronary intervention, TCFA thin-capped fibroatheroma
When using OCT to image the target lesion prior to PCI, the presence of TCFA at the target site has been identified as the strongest OCT predictor of PCI-related complications and has been associated with a 50–75 % risk of peri-procedural myocardial infarction during PCI [40, 41]. Even without consideration of the fibrous cap thickness, the underlying lipid arc is another important morphologic feature by OCT that predicts acute PCI-related complications. Accordingly, the lipid arc by OCT is an independent predictor of angiographic no-reflow during PCI, with no-reflow occurring in up to 75 % of cases when PCI is performed on a target lesion having a lipid arc >180° [42]. Further emphasizing the importance of lipid in the target lesion, angiographic no-reflow was shown not to occur in the absence of a lipid-rich plaque in one study [42].
NIRS Predictors of Acute PCI-Related Complications
Intracoronary NIRS has been validated to detect the presence of lipid core plaque within coronary arteries and to quantify the amount of lipid present [43, 44]. By NIRS, lipid is quantified as the lipid core burden index (LCBI), defined as the fraction of pixels within a region of interest indicating lipid multiplied by 1,000 [43, 44]. Another commonly used metric to describe focal lipid quantity by NIRS is maxLCBI4mm, defined as the maximum LCBI in any contiguous 4-mm segment of vessel [45].
Among patients with ACS and stable angina, the maxLCBI4mm by NIRS of the target lesion is associated with the risk of peri-procedural myocardial infarction during PCI [45]. In fact, the presence of a maxLCBI4mm ≥500 at the culprit site (Fig. 11.4) is associated with a 50 % rate of peri-procedural myocardial infarction [45]. In contrast, the rate of peri-procedural myocardial infarction among those with a maxLCBI4mm <500 was demonstrated to be only 4 % [45]. The notion that the quantity of lipid detected by NIRS at the culprit site is an important predictor of peri-procedural myocardial infarction is consistent with observations by IVUS and OCT wherein the quantity of attenuated plaque and the degree of lipid, respectively, are associated with the risk of acute PCI-related complications [30].
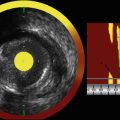
Fig. 11.4
NIRS identifies a large lipid core plaque within the angiographic culprit margins prior to stenting. Routine combined NIRS-IVUS imaging was performed within the culprit vessel for PCI planning and to assess the risk of peri-procedural complications during stenting. The NIRS chemogram of the culprit vessel is shown on the left. The standard orientation of the chemogram has the distal vessel on the right and the proximal vessel on the left. The x-axis represents position along the vessel in mm and the y-axis represent circumferential position around the vessel in degrees. Red on the chemogram is indicative of the absence of lipid whereas yellow indicates the presence of lipid core plaque. In the example above, the proximal [1] and distal [2] angiographic culprit margins have been marked. Upon placing these bookmarks the NIRS console automatically generates a maxLCBI4mm value, which in this case was 745. The presence of a maxLCBI4mm ≥500 at the culprit site is associated with a 50 % rate of peri-procedural myocardial infarction during PCI. A representative combined NIRS-IVUS frame from within the culprit lesion is shown on the right and depicts the presence a large, bulky, eccentric, lipid core plaque. IVUS intravascular ultrasound, maxLCBI 4mm maximum lipid core burden index in a 4-mm segment, NIRS near-infrared spectroscopy, PCI percutaneous coronary intervention
Limitation of Using Intracoronary Imaging to Assess PCI Risk
Based on the findings of multiple studies, it is clear that intracoronary imaging can identify target lesions at risk of inducing no-reflow and peri-procedural myocardial infarction during PCI. However at present, there are no studies demonstrating that identification of such high-risk lesions, whether by IVUS, OCT or NIRS, should alter the clinical approach to PCI. Importantly, the routine use of distal embolic protection devices during PCI without consideration of underlying plaque morphology is not beneficial [46]. Until studies evaluating the clinical benefit of pre-PCI risk assessment are performed, widespread adoption of pre-PCI intracoronary imaging to assess procedural risk is unlikely.
Intracoronary Imaging for Stent Optimization
Stent Optimization with IVUS or OCT
When applied after stent implantation, intracoronary imaging can be used to optimize the stent result. Although the application of OCT for PCI guidance has not yet been addressed by contemporary guidelines, use of IVUS for stent optimization is supported by a IIb recommendation in the 2011 guidelines [47]. The presence of guideline support for IVUS and the lack of similar support for OCT is likely attributable to the shorter duration that OCT has been available to generate an evidence base supportive of its routine use in PCI. When utilized after stent implantation, IVUS or OCT should focus on detecting edge dissections, strut malapposition, stent under-expansion, incomplete lesion coverage, thrombus, and tissue protrusion. Many of these findings have been associated with adverse clinical events when identified by IVUS [17, 48, 49], although studies linking these findings by OCT with adverse clinical events clinical events have not yet been reported.
Stent Strut Malapposition and Underexpansion
Whereas stent strut malapposition (Fig. 11.5) is defined as the presence of struts that are not in contact with the vessel wall [5, 17], stent underexpansion (Fig. 11.6) is often defined as a minimal stent area <80 % of the smallest reference segment luminal area [50]. Stent strut malapposition, when identified by IVUS at follow up, has been associated with a higher rate of stent thrombosis [51]. Stent underexpansion has similarly been associated with an increased risk of stent thrombosis [48] and has also been proposed as the most important determinant of restenosis risk after bare-metal stent placement in IVUS studies [52].
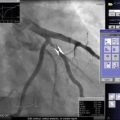
Fig. 11.5
Stent strut malapposition. Tandem stenoses are evident by invasive angiography in the mid-RCA (a). Stent placement (proximal and distal stent margins are marked by green lines) and post-dilation with a non-compliant balloon yielded an adequate angiographic result (b). OCT was performed after initial post-dilation to ensure an optimal PCI result and demonstrated that most of the stent struts were well-apposed to the vessel wall (white arrows, c). However, OCT also identified stent strut malapposition (red arrows, d), which was completely unapparent by angiography. Further post-dilation with a larger non-compliant balloon was subsequently performed. OCT optical coherence tomography, PCI percutaneous coronary intervention, RCA right coronary artery