Magnetic Resonance Imaging of Congenital Heart Disease
Charles B. Higgins
Karen Ordovas
Gautham P. Reddy
The overall objectives of imaging in congenital heart disease (CHD) are the precise delineation of cardiovascular anatomy and the quantitative assessment of function. The evaluation of CHD was one of the first applications of cardiac magnetic resonance imaging (MRI) and continues to be one of its most important indications. MRI has significant advantages over other modalities, including echocardiography and angiography, for the definitive assessment of congenital cardiovascular anomalies. MRI does not require the use of a contrast agent or ionizing radiation. The absence of ionizing radiation is a major advantage of MRI in children, who in the past have been exposed to large does of radiation during cine angiography for initial diagnosis and postoperative monitoring.
The role of MRI has been greatly influenced by the perceived success of echocardiography as the primary noninvasive imaging technique in CHD. The major applications have been for lesions incompletely evaluated by echocardiography. However, substantial technological improvements, especially fast cine MRI using (steady-state free precessation {SSFP[) and noncontrast and contrast-enhanced magnetic resonance angiography (MRA), make MRI at least equal to echocardiography in the diagnosis of all types of CHD in children and adults. Echocardiography is still considered to be the more effective and easily applicable modality for infants. On the other hand, MRI is becoming recognized as more effective in adolescent and adult CHD and for follow-up of corrected complex anomalies.
MAJOR CLINICAL INDICATIONS
At present, the major indications for MRI in CHD are as follows:
Thoracic aortic anomalies, such as coarctation and arch anomalies
Pulmonary arterial anomalies and pulmonary atresia
Complex cyanotic disease, such as atresia of atrioventricular valves and double-inlet ventricles
Abnormalities of pulmonary venous connections
Postoperative evaluation of complex procedures
Coronary arterial anomalies
Adolescent and adult CHD
Monitoring regurgitation and ventricular function before and after surgery
TECHNIQUES
MRI studies are directed toward precise display of the cardiovascular anatomy and quantification of ventricular function and blood flow. An advantage of MRI in CHD is measurement of ventricular volumes and function using cine MRI and velocity-encoded (phase contrast) cine MRI.
For children younger than 8 to 10 years and children unwilling or unable to remain immobile and cooperative during imaging, light anesthesia without intubation is used. This is usually under the control of an anesthesiologist. The favored drug is intravenous propofol. Blood pressure, heart rate, and oxygen saturation are monitored during the procedure.
Anatomy
Assessment of anatomy is done with one or more of the following techniques: ECG-gated multislice spin-echo (black-blood images); breath-hold single-slice or multislice turbo spin-echo (black blood); balanced SSFP (white blood); and noncontrast and contrast-enhanced three-dimensional (3D) MRA. The latter technique is usually applied for the evaluation of anomalies of the great arteries, pulmonary veins, and surgical shunts.
Function
The techniques used in the evaluation of right and left ventricular function are generically called cine MRI. There are a multitude of cine MRI sequences; the most frequently applied one now is a balanced steady-state free precession (SSFP) sequence and real-time cine MRI. Because of optimized homogeneous contrast between cavitary blood and myocardium, balanced SSFP sequences (balanced fast field echo {FFE[; true fast imaging with steady precession {FISP[; and fast imaging employing steady-state acquisition {FIESTA[) are now preferred. The so-called real-time sequence may be advantageous in infants and young children who cannot hold their breath.
Cine MR images are used to quantify ventricular volumes and function. Right and left ventricular volumes are indexed to body surface areas (EDV/m2 and ESV/m2).
A distinct advantage of MRI compared to echocardiography is its precision and reproducibility for quantifying right ventricular volume and function. For ventricular volumetrics, images are acquired in the cardiac short-axis plane.
A distinct advantage of MRI compared to echocardiography is its precision and reproducibility for quantifying right ventricular volume and function. For ventricular volumetrics, images are acquired in the cardiac short-axis plane.
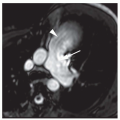
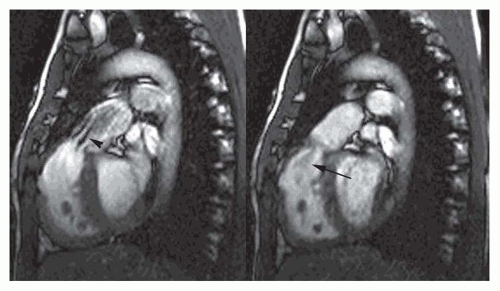 FIG. 36.1. Postoperative tetralogy of Fallot. Sagittal cine MR images in systole (left) and diastole (right) demonstrate a signal void (arrowhead) projected into the pulmonary artery (pulmonary stenosis) and a signal void (arrow) into the right ventricle (pulmonary regurgitation). |
Cine MR images are also used to evaluate valvular function. Planes approximately parallel to the valve leaflet or cusps can demonstrate valve motion, such as the horizontal long-axis plane for assessing mitral valve motion and RV outlet plane for visualizing infundibular and pulmonary valvular stenosis. The high-velocity jet caused by valvular stenosis and regurgitation may be identified on cine MR images as a flow void (Fig. 36-1). However, flow voids may not be discernible if the echo time (TE) is less than 6 milliseconds on GRE cine and on balanced SSFP cine. On the latter cine, high flow velocity may cause increased signal.
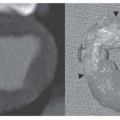
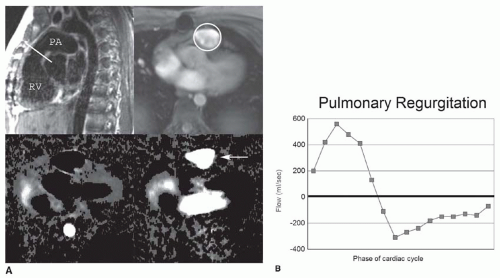 FIG. 36.2. A: Postoperative tetralogy of Fallot. Sagittal spin-echo image (top left), axial magnitude image (top right), and phase images in systole (bottom left) and diastole (bottom right). Phase contrast images show forward flow in systole (dark voxels) and retrograde flow in diastole (bright voxels; arrow). Region of interest for flow measurements is shown on the pulmonary artery. B: Flow versus time curve displays the forward and retrograde flow in the pulmonary artery. Area under negative component of the curve yields a direct quantification of the volume of regurgitation. |
Volume and Velocity of Blood Flow
Quantification of blood flow is done using velocity-encoded (VEC; phase contrast) MRI. In phase contrast imaging, the signal intensity signifies the velocity of blood at each pixel. ECG-gated phase contrast images can be produced in which each image shows the velocity at a different time in the cardiac cycle. Because these are cine-images, they can be referred to as VEC cine MRI. A region of interest drawn around a blood vessel will give the mean velocity within the vessel at that point in the cardiac cycle. The cross-sectional area of the vessel can be multiplied by the spatial mean velocity to obtain the flow in the blood vessel.
VEC cine MRI is used to measure valvular regurgitant volume (Fig. 36-2); differential flow in central pulmonary arteries; systemic to pulmonary shunt flow; flow through conduits (Rastelli and Fontan conduits); and collateral
flow in coarctation. By determining the voxel with the peak velocity just beyond a stenosis, this technique can estimate the peak gradient across a valvular or conduit stenosis.
flow in coarctation. By determining the voxel with the peak velocity just beyond a stenosis, this technique can estimate the peak gradient across a valvular or conduit stenosis.
ACYANOTIC LESIONS
Left-to-Right Shunts
Echocardiography provides essential diagnostic information in most left-to-right shunts. MRI is used for a few specific purposes. The major indications are for the following suspected lesions: sinus venosus atrial septal defect (ASD), partial anomalous pulmonary venous connection, and supracristal ventricular septal defect (VSD). A new indication in patients with ASD is to provide precise measurement of the defect and its location for planning of transcatheter ASD closure device placement. VEC cine MRI may also be employed to measure the systemic to pulmonary flow ratio.
Atrial Septal Defect
Spin-echo and cine MR images in the transaxial or fourchamber planes demonstrate the site of the ASD (Fig. 36-3). MR clearly depicts the defect in the portion of the septum separating the superior vena cava from the left atrium, which is diagnostic of a sinus venosus ASD (Fig. 36-4). It also shows the anomalous connection of the right upper lobe pulmonary vein to the superior vena cava adjacent to the septal defect. On spin-echo MR images, the thin fossa ovalis can be mistaken for an ASD. To avoid this error, the defect should be evident at two adjacent anatomic levels or confirmed by a flow jet (void) across the defect on cine MRI.
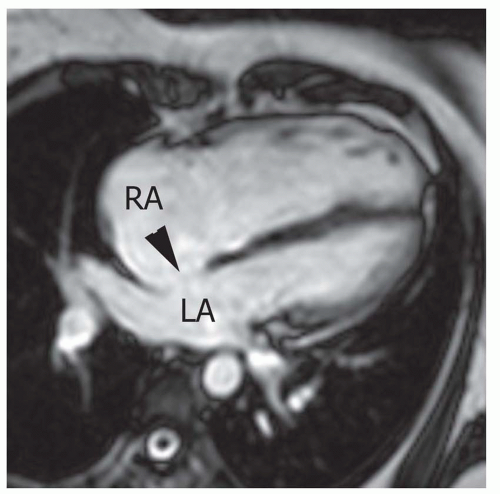 FIG. 36.3. Secundum atrial septal defect. Cine MR image in the axial plane demonstrates the defect in the atrial septum (arrowhead). RA, right atrium; LA, left atrium. |
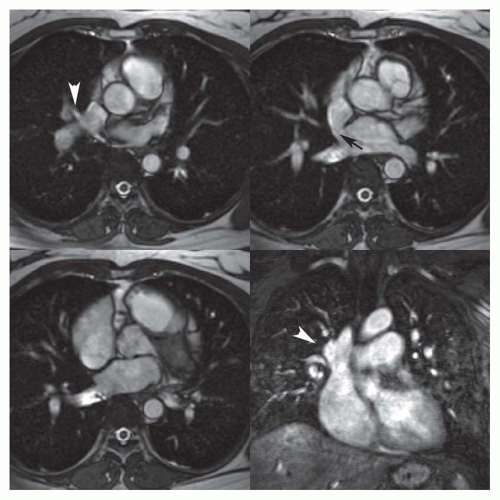 FIG. 36.4. Sinus venosus atrial septal defect. Cine MR images in three axial planes (top row and bottom left) and the coronal plane (bottom right) show the defect (arrow) in the portion of the atrial septum between the superior vena cava and the left atrium. The right upper lobe pulmonary vein (arrowheads) connecting at the junction of the superior vena cava (SVC) with the right atrium is associated with the sinus venosus defect. Coronal image shows the dilatation of the SVC at the site of connection of the anomalous pulmonary vein. |
Secundum ASD is situated in the middle of the atrial septum (Fig. 36-3). If very large, it may approach the aortic or mitral valve annulus (Fig. 36-5). Primum ASD is situated just adjacent to the atrioventricular valves (Fig. 36-6). A diagnostic characteristic of primum ASD is that the mitral and tricuspid valves are at the same level (distance) from the cardiac apex (Fig. 36-6). The demonstration of the location and size of an ASD is facilitated by cine MRI in the horizontal long-axis (four chamber) plane.
VEC (phase contrast) cine in a plane parallel to the ASD is used to determine the dimensions of the defect and if it is amenable for closing with an ASD closure device (Fig. 36-7). For this purpose, a low velocity encoding value (40 cm/s) is used in order to include flow at the margins of the defect. For placement of a closure device, the defect should be less than 3.5 to 4.0 cm in diameter. Cine MRI is also used to measure the distance of the margins of the defect from the mitral and aortic valves and pulmonary veins.
VEC cine MRI measurement in the main pulmonary artery and proximal ascending aorta can be used to calculate pulmonary to systemic flow ratio (Qp/Qs) (Fig. 36-8). The imaging planes are placed perpendicular to the direction of
blood flow in each artery using sagittal images to site their planes. Good correlations have been found for Qp/Qs, measured by VEC cine MR and oximetric samples acquired at cardiac catheterization.
blood flow in each artery using sagittal images to site their planes. Good correlations have been found for Qp/Qs, measured by VEC cine MR and oximetric samples acquired at cardiac catheterization.
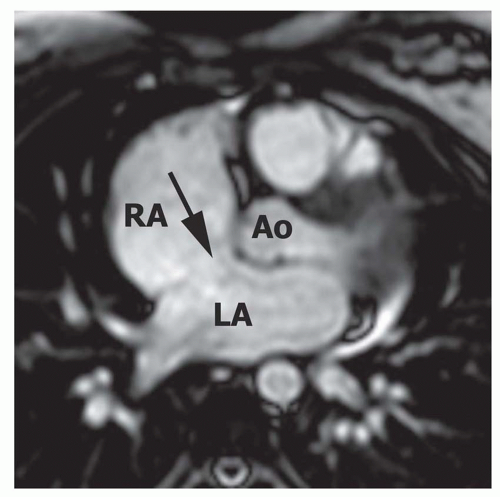 FIG. 36.5. Large secundum atrial septal defect. Axial cine MR image shows a large secundum ASD (arrow) approaching the aortic valve annulus. RA, right atrium; LA, left atrium; Ao, aorta. |
Partial Anomalous Pulmonary Venous Connection
Partial anomalous pulmonary venous connection (PAPVC) produces volume overload of right-sided cardiac chambers. The hemodynamic are identical to ASD. The most common type is connection of right upper lobe pulmonary vein to superior vena cava. This type of connection can occur alone (Fig. 36-9) or accompany sinus venosus ASD (Fig. 36-4). Nearly equally frequent is left upper lobe vein drainage via a vertical vein to the left innominate vein (Fig. 36-10). There is an increased incidence of secundum ASD as well as sinus venosus ASD in patients with PAPVC.
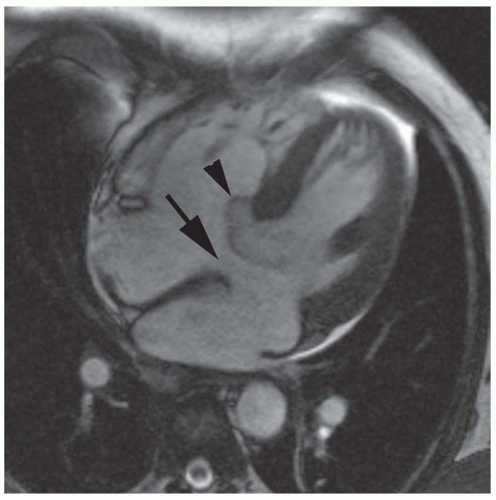 FIG. 36.6. Primum atrial septal defect. Axial cine MR image shows a defect in the primum atrial septum (arrow). The atrioventricular valve is attached to the foreshortened ventricular septum (arrowhead). |
MRI and MRA are the procedures of choice for identifying the presence and connections of this anomaly. MRA is crucial in this regard (Figs. 36-9 and 36-10). The connection of the right-sided pulmonary veins to one or more veins that connect to the inferior vena cava (IVC) can be displayed in the scimitar syndrome (Fig. 36-11).
Cine MR is done in the horizontal long plane to exclude a concomitant ASD. Cine MRI is also performed in the short-axis plane in order to document the severity of right ventricular enlargement. VEC cine MR is performed perpendicular to the direction of flow in the proximal pulmonary artery and aorta, in order to calculate pulmonary to systemic flow ratio (Qp/Qs) (Fig. 36-8).
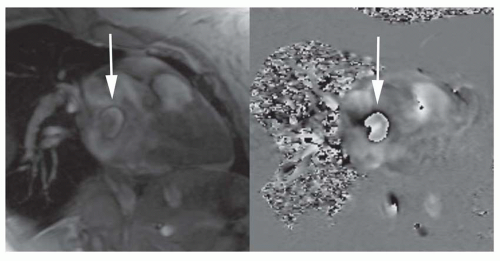 FIG. 36.7. ASD size. Magnitude (left) and phase (right) images from velocity-encoded cine MR sequence acquired parallel to the atrial septum (en face) delineates the flow through the defect (arrows) allowing precise measurement of the defect dimensions. |
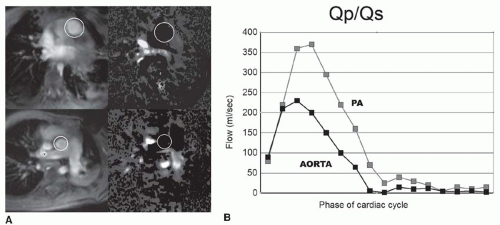 FIG. 36.8. A: Atrial septal defect. Magnitude (left) and phase (right) images from VEC cine MR in planes perpendicular to the long axis of the pulmonary artery (top) and the proximal ascending aorta (below). Regions of interest surround the aorta and pulmonary artery. B: Flow versus time curves for the aorta and pulmonary artery. Because of the left-to-right shunt, the area under the pulmonary artery curve is greater. The area under each curve provides a direct measurement of the pulmonary to systemic flow ratio (2.1:1). |
Ventricular Septal Defect
MRI in the transaxial, horizontal long-axis, or four-chamber plane can precisely demonstrate the site of single or multiple VSDs (Fig. 36-12). Inlet VSD is situated just beneath the atrioventricular valves. The tricuspid and mitral valves are equidistant from the cardiac apex. This relationship and the defect are displayed optimally on cine MR in the horizontal long-axis plane. The supracristal VSD is characterized by a defect that lies between the right ventricular outlet and the base of the aorta (Fig. 36-13). On cine MR, a flow void apparently passes from the base of the aorta (it actually passes from just below the aortic valve) to the right ventricular outlet region and into the proximal pulmonary artery. VEC cine MRI can be used to calculate Qp/Qs and quantify the left-to-right shunt.
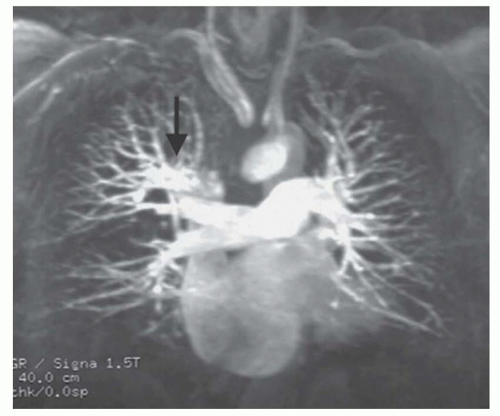 FIG. 36.9. Partial anomalous pulmonary venous connection. Contrast-enhanced 3D MRA shows anomalous connection of the right upper pulmonary vein (arrow) to the superior vena cava. |
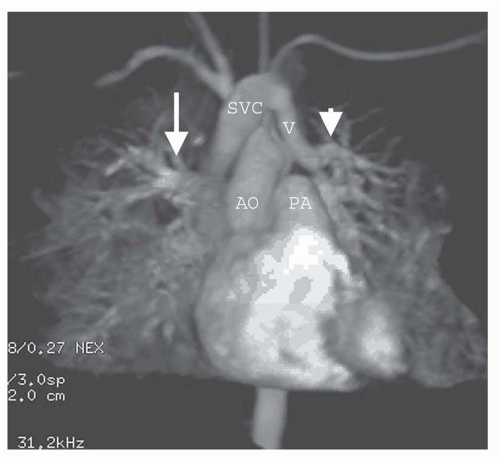 FIG. 36.10. Partial anomalous pulmonary venous connection. Contrast-enhanced 3D MRA shows anomalous connection of the left upper vein (arrowhead) to a vertical vein and the right upper vein (arrow) to the superior vena cava. AO, ascending aorta; PA, pulmonary artery; SVC, superior vena cava; V, vertical vein. |
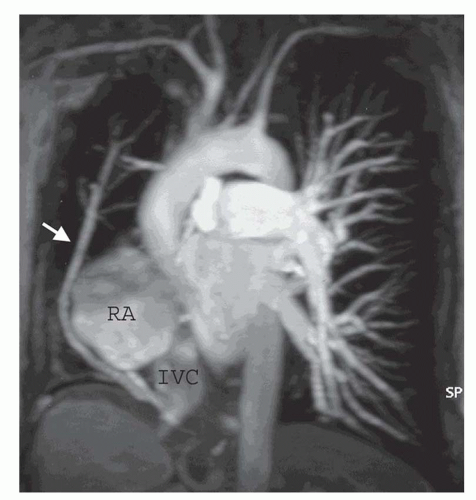 FIG. 36.11. Partial anomalous pulmonary vena connection in scimitar syndrome. Contrast-enhanced 3D MRA shows the scimitar vein (arrow) connecting with the inferior vena cava, hypoplastic right pulmonary artery, and dextroposition of the heart. IVC, inferior vena cava; RA, right atrium. (Courtesy of Gus Bis, Detroit, Michigan.) |
Aorta to Right-sided Shunts
MRI is rarely used to demonstrate patent ductus arteriosus or aorticopulmonary window (Fig. 36-14). With recent improvements in coronary MRA, it is effective for demonstrating the presence and sites of emptying of coronary arteriovenous fistulas. MRI and MRA are very effective for demonstrating sinus of Valsalva aneurysms and fistulas.
Atrioventricular Septal Defect/Atrioventricular Canal (Endocardial Cushion Defect)
These terms denote a spectrum of abnormalities that have in common an abnormal septation between the atria and ventricles. They are also called endocardial cushion defects because the defects are considered to be abnormalities of the embryologic endocardial cushions, which grow together in the center of the heart and divide the atria from the ventricles.
In the normal heart, the atrioventricular septum separates the right atrium from the left ventricle. The atrioventricular septum lies between the more apically located normal tricuspid valve and mitral valve (Fig. 36-15). In all cases of atrioventricular septal defect, the tricuspid and mitral valves lie at the same level, and the atrioventricular septum is defective. This abnormal relationship can be shown on MRI in the transaxial or horizontal long-axis plane. In the mildest form of atrioventricular septal defect, the shunt is from the left ventricle to the right atrium, which can be evident on cine MR. In other cases, the atrial septum adjacent to the atrioventricular valve orifice may also be absent, resulting in an ostium primum ASD (Fig. 36-16). Some patients have an inlet VSD, usually located in the same axial image as the atrioventricular valve or valves. In the most severe cases, both the atrial and ventricular portions of the septum around the valve origins are absent, a condition referred to as complete atrioventricular canal. This creates a common atrioventricular valve orifice with continuous, common atrioventricular valve leaflets (Fig. 36-17).
 FIG. 36.12. Ventricular septal defect. Spin-echo (left) and gradient-echo (right) axial images show a defect in the perimembranous ventricular septum. A signal void at the defect is projected into the right ventricle. |
Coarctation of the Aorta
MRI is the procedure of choice for definitive diagnosis and assessment of the severity of coarctation. MRI has been shown to be effective for preoperative assessment of coarctation and for postoperative evaluation of recurrent or persistent hypertension. To evaluate coarctation, spin-echo or cine MR sequences are obtained in the axial and oblique sagittal planes. The diameter of the narrowing can be precisely measured with MRI, especially with the use of thin (3-mm) sections through the center of the stenosis. Thin oblique sagittal images through the long-axis plane of the aorta show the diameter of the stenosis and provide an accurate measurement of its length (Fig. 36-18).
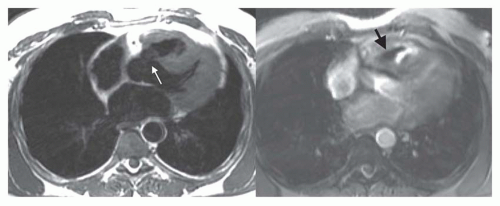 FIG. 36.13. Supracristal ventricular septal defect. Spin-echo (left) and cine MR (right) images in the axial plane demonstrate a defect (white arrow) in the outlet portion of the septum. A flow void (black arrow) projects into the upper region of the right ventricular outflow region. |
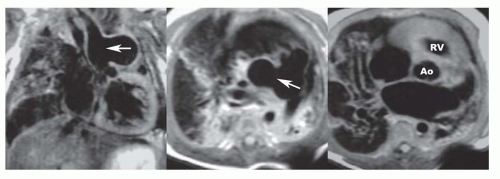 FIG. 36.14. Aorticopulmonary window. Coronal (left) and axial (center and right) spin-echo images demonstrate a defect (arrows) between the proximal ascending aorta and the pulmonary artery. Ao, aorta; RV, right ventricular outlet region. |
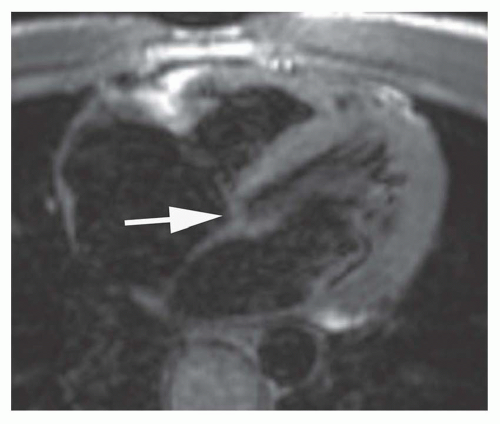 FIG. 36.15. Atrioventricular septum. Axial spin-echo image shows the small portion (arrow) of ventricular septum separating the left ventricle and the right atrium. Note the more ventral position of the tricuspid valve relative to the mitral valve. |
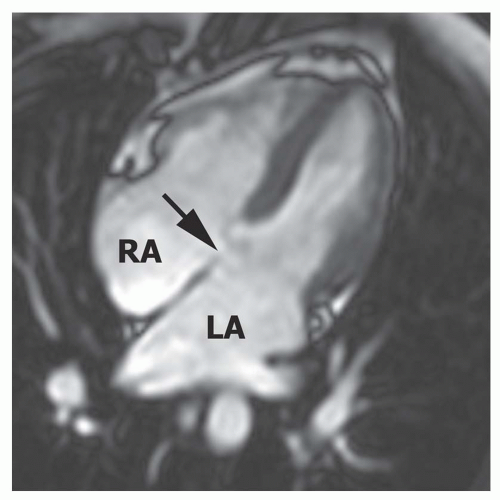 FIG. 36.16. Primum atrial septal defect. Cine MR image in the horizontal long-axis plane shows a defect at the level of the septum primum (arrow). RA, right atrium; LA, left atrium. |
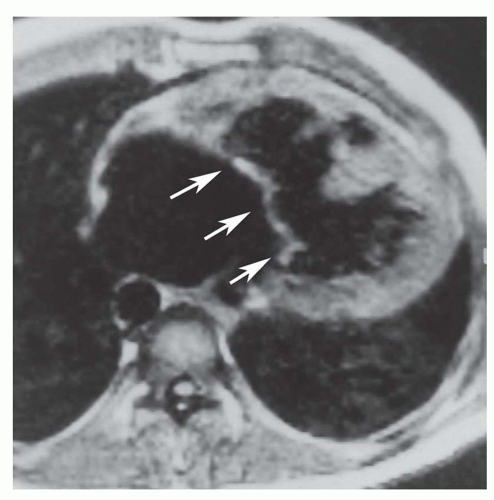 FIG. 36.17. Atrioventricular canal (endocardial cushion) defect. Axial spin-echo image shows a large defect in the inlet portion of the ventricular septum. A single atrioventricular valve (arrows) spans the inlet of both ventricles. |
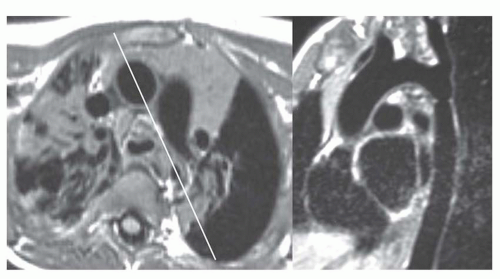 FIG. 36.18. Coarctation of aorta. Axial (left) and oblique sagittal (right) spin-echo images. A line bisecting the ascending and descending aorta at the coarctation prescribes the oblique sagittal plane (long-axis plane of thoracic aorta). This latter image displays the coarctation site along with the arch. |
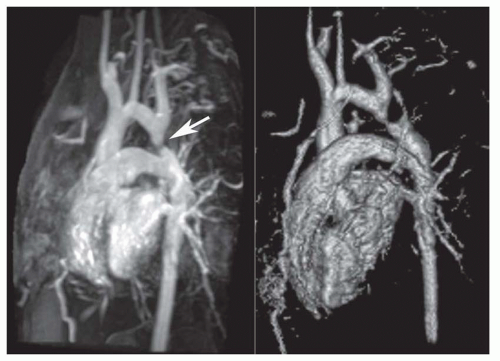 FIG. 36.19. Coarctation of aorta. Contrast-enhanced 3D MRA in the sagittal plane shows a discrete juxtaductal coarctation (arrow) on the maximum intensity projection (left) and the volume-rendered 3D reconstruction (right). |
The oblique sagittal images also display the dimension of aortic isthmus (region between the left subclavian artery and the ligamentum arteriosum) and the aortic arch. In some cases, a single 3-mm slice in this plane may not display the coarctation and arch because of tortuosity of the arch and proximal descending aorta, but the assessment can be done from adjacent images. Gadolinium-enhanced 3D MRA can display the entire thoracic aorta on a single image with the use of maximum intensity projection or volume-rendering reconstruction techniques (Fig. 36-19). Gadolinium-enhanced MRA is also effective for demonstrating collateral vessels (Fig. 36-20).
VEC cine MRI can be applied to demonstrate the presence of and estimate the volume of collateral circulation to the descending aorta below the coarctation site (Fig. 36-21). This is accomplished by using two imaging planes perpendicular to the aorta; one is about 2 cm beyond the coarctation and the other at the level of the diaphragm. In the normal
aorta, volume flow is greater (about 5% to 7% higher) at the proximal site. On the other hand, in a hemodynamically significant coarctation, volume flow is greater at the diaphragm because of retrograde flow through the intercostal and mammary arteries and other collaterals into the distal aorta. The presence of greater volume flow at the diaphragmatic level is considered a functional indicator of hemodynamic significance of the coarctation. There is a rough linear relationship between the percentage of stenosis and the volume of collateral circulation. After stenting of the coarctation, VEC cine MRI has demonstrated reversal of the collateral flow since volume flow at the proximal site becomes greater than at the distal one.
aorta, volume flow is greater (about 5% to 7% higher) at the proximal site. On the other hand, in a hemodynamically significant coarctation, volume flow is greater at the diaphragm because of retrograde flow through the intercostal and mammary arteries and other collaterals into the distal aorta. The presence of greater volume flow at the diaphragmatic level is considered a functional indicator of hemodynamic significance of the coarctation. There is a rough linear relationship between the percentage of stenosis and the volume of collateral circulation. After stenting of the coarctation, VEC cine MRI has demonstrated reversal of the collateral flow since volume flow at the proximal site becomes greater than at the distal one.
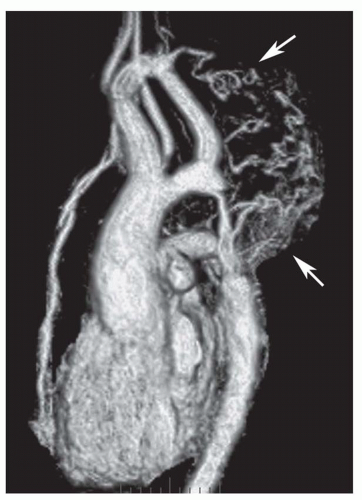 FIG. 36.20. Coarctation of aorta. Contrast-enhanced 3D MRA in the sagittal plane shows long-segment coarctation caused by Takayasu’s arteritis. Note the abundant collateral arterial connections (arrows). |
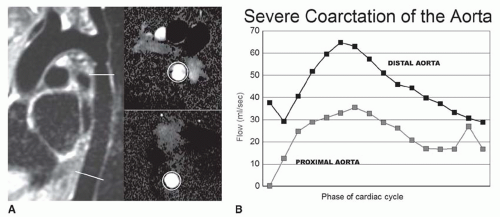 FIG. 36.21. A: Coarctation of the aorta. Sites of planes for magnitude and phase images in the proximal (top) and distal aorta (bottom) used to estimate the volume of collateral flow. B: Flow versus time curves for the proximal and distal descending aorta show a larger flow volume in the distal compared with the proximal aorta caused by retrograde flow in aortic branches below the coarctation. The volume of collateral flow is estimated as the difference in flow volumes (areas under the curves) at the two sites. |
Theoretically, VEC cine MRI can also be used to estimate the gradient across the coarctation. Using planes perpendicular and parallel to the coarctation, peak velocity of flow can be estimated. Applying the modified Bernoulli formula (peak pressure gradient = 4 × {peak velocity[2), the peak gradient is estimated. The voxel (s) with highest velocity in systole can be identified on phase images in both planes. The highest in either plan is considered the peak velocity (Fig. 36-22).
Arch Anomalies
There are numerous types of arch anomalies resulting from abnormal resorption of the anterior or posterior segments of the embryonic double-arch configuration. However, the only ones encountered with any frequency are complete (patent) double arch, double arch with atretic posterior component of the left arch (Fig. 36-23), right arch with aberrant (retroesophageal) left subclavian artery (Fig. 36-24), and left arch with aberrant right subclavian artery. The first three produce complete vascular rings that narrow the trachea and esophagus. Compression of the trachea is by the aortic component situated between the vertebral body and the esophagus. The vascular ring with right arch and aberrant left subclavian artery is completed by the posterior component that is tethered anteriorly by a left-sided ligamentum arteriosum. With mirror-image right aortic arch, the ligamentum courses between the left innominate artery and the proximal left pulmonary artery. On the other hand, with non-mirror-image right aortic arch, the ligamentum courses between the descending aorta and the proximal left pulmonary artery. At the site of attachment of the ligamentum, there is an enlargement or diverticulum of the descending aorta.
This localized dilatation tethered anteriorly by the posterior left-sided ligamentum is the structure that compresses the trachea and esophagus rather than the left subclavian artery itself. These anatomic arrangements can be readily discerned on MR images in the transaxial plane.
This localized dilatation tethered anteriorly by the posterior left-sided ligamentum is the structure that compresses the trachea and esophagus rather than the left subclavian artery itself. These anatomic arrangements can be readily discerned on MR images in the transaxial plane.
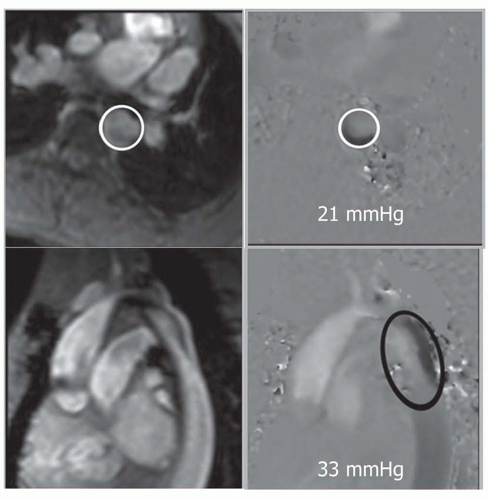 FIG. 36.22. Pressure gradient in aortic coarctation. Magnitude (top left) and phase (top right) images from VEC-MR acquisition perpendicular to the descending aorta in a level distal to the coarctation demonstrate an estimated pressure gradient of 21 mm Hg. Magnitude (bottom left) and phase (bottom right) images from an in-plane VEC-MR aligned to the descending aorta show an estimated pressure gradient of 33 mm Hg. |
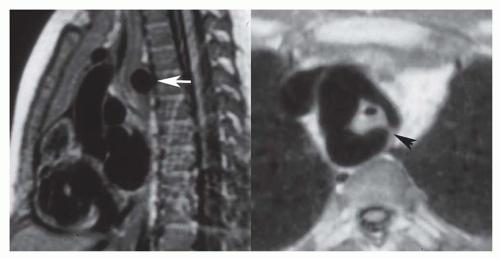 FIG. 36.23. Double aortic arch. Spin-echo images in sagittal (left) and axial (right) planes display posterior compression of the trachea by a retroesophageal component (arrow) of a double arch. The axial plane shows that the right arch is the larger of the two and also shows a short atretic posterior segment (arrowhead) of the left arch. |
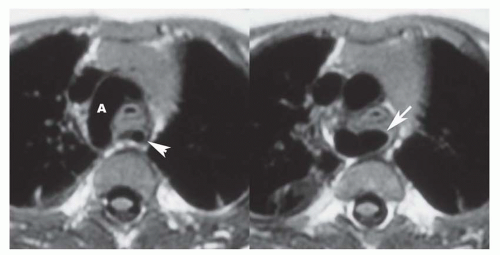 FIG. 36.24. Right aortic arch with aberrant left subclavian artery. Spin-echo axial images (left) show the right arch (A) and aberrant left subclavian artery (arrowhead). Another axial image shows the diverticulum (arrow) of the descending arch, which is the site of origin of the left subclavian artery. |
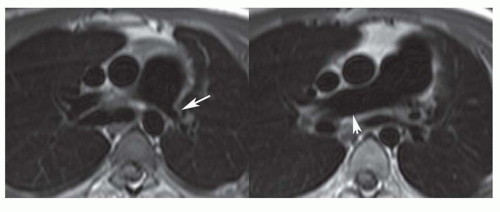 FIG. 36.25. Branch pulmonary artery stenoses. Transaxial spin-echo images display stenosis (arrow) of the left pulmonary artery. Note the size of the right pulmonary artery (arrowhead) for comparison. |
For the evaluation of arch anomalies, spin-echo images are acquired in sagittal (5-mm slice thickness) and transaxial (3-mm slice thickness) planes (see Fig. 36-23). These images display the aortic anomaly and verify that the anomalous component produces airway compression. Cine MR images may be used to display the pulsatile nature of the airway obstruction. In some cases, the site of maximal airway compression is at the carina or even involves a proximal bronchus.
Contrast-enhanced 3D MRA may be used to demonstrate the arch anomaly. The MRA acquisition is done in either the sagittal or coronal planes.
Pulmonary Arterial Anomalies
Pulmonary arterial anomalies are evaluated using spin-echo and cine MRI (Fig. 36-25) and contrast-enhanced 3D MRA (Fig. 36-26) for depicting morphology and VEC (phase contrast) MRI for measuring blood flow. Spin-echo and cine MR images are acquired in the transaxial plane followed by images along the long axis of the right (oblique coronal plane) and left (oblique sagittal plane) pulmonary arteries. Contrast-enhanced 3D MRA is usually acquired in the coronal plane; a short acquisition period is optimal to depict the pulmonary arteries before enhancement of the left heart and aorta. VEC cine sequences are obtained perpendicular to the long axis of the right, left, and main pulmonary arterial segments.
Related posts:
Stay updated, free articles. Join our Telegram channel

Full access? Get Clinical Tree


