KEY FACTS
 Most common tumors: squamous cell carcinoma (>80%), adenocarcinoma, minor salivary gland tumors, and lymphoma.
 It is not clear if tobacco and alcohol use are significant risk factors, but its incidence is increased in Chinese (500: 1,000,000) and African Americans (still rare: 7: 1,000,000), particularly males 30 to 60 years of age.
 Types: 1—localized and related to Epstein Barr virus infection, no nodes, poor response to radiation; 3—associated with EBV, disseminated, favorable prognosis; 2—between 1 and 3.
 Common symptoms: adenopathy (>50%), serous otitis media (due to obstruction of the eustachian tube orifice), nasal obstruction, epistaxis, and neurologic dysfunction secondary to base of the skull or cavernous sinus invasion.
 Tumors begin in the fossa of Rosenmuiler and have local extension with initial metastases to the lateral retropharyngeal nodes of Rouvierre, to the spinal accessory (level 5) nodes, and lastly to the internal jugular nodes (levels 2,3, and 4).
 Nodes are present in 50% of patients at diagnosis and decrease survival by half.
 Nasopharyngeal cancer has low signal on T2 images and apparent diffusion coefficient (ADC) maps due to its high cellularity
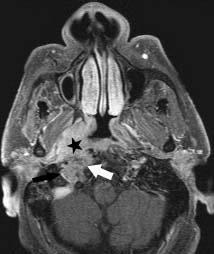
FIGURE 28-1. Axial fat-suppressed postcontrast T1 shows carcinoma (star) invading adjacent base of skull (arrows).
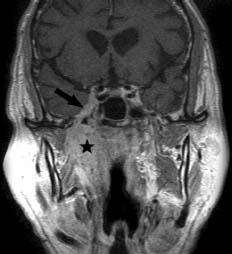
FIGURE 28-2. Coronal postcontrast T1, in the same patient, shows mass (star) and perineural tumor extension along the third division (arrow) of cranial nerve V and into cavernous sinus.
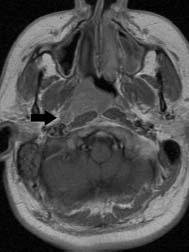
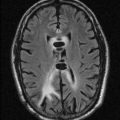
FIGURE 28-3. Axial postcontrast T1 in a patient with type 1 cancer shows localized tumor in the right posterior nasopharynx with enlarged retropharyngeal lymph node (arrow).
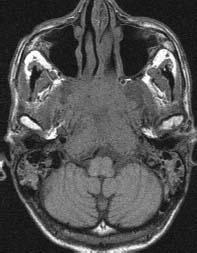
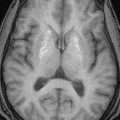
FIGURE 28-4. Axial noncontrast T1 in a patient with disseminated (type 3) carcinoma shows large mass with invasion of central skull base.
SUGGESTED READING
Chong VF, Khoo JB, Fan YF. Imaging of the nasopharynx and skull base. Magn Reson Imaging Clin N Am 2002;10:547–571.

KEY FACTS
 The normal parapharyngeal space contains fat, third division of trigeminal nerves, branches of internal maxillary artery, and ascending pharyngeal artery and veins.
 The parapharyngeal space is divided into a prestyloid compartment (80% of masses occur here and are mostly pleomorphic adenomas) and poststyloid compartment (20% of masses arise here and are mostly neurogenic tumors and paragangliomas).
 In children, consider second branchial cleft cysts, abscesses, and pleomorphic adenomas.
 Squamous cell carcinoma usually arises from the adjacent pharyngeal mucosal space and invades the parapharyngeal space secondarily.
 Clue: if the parapharyngeal space is not identified in the presence of a mass in that region, it is likely that the mass arises in the parapharyngeal space.
 Pleomorphic adenomas do not have restricted diffusion on ADC maps.
About 1% to 10% of pleomorphic adenomas will develop carcinomas in them (carcinoma ex pleomorphic adenoma); these show restricted diffusion. Postsurgical recurrence occurs in 20% to 40% and is seen as nodular T2 hyperintense lesions in the surgical bed.
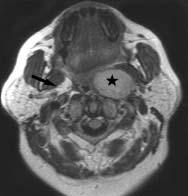
FIGURE 28-5. Axial postcontrast T1 shows an enhancing right pleomorphic adenoma (star). Note normal fat in opposite parapharyngeal space (arrow).
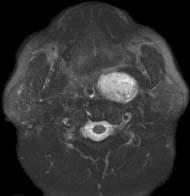
FIGURE 28-6. Corresponding fat-suppressed T2 shows that mass is homogeneously bright.
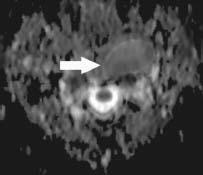
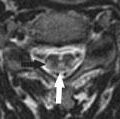
FIGURE 28-7. Axial ADC map, in a different patient, shows a left-sided pleomorphic adenoma (arrow) without any restricted diffusion.
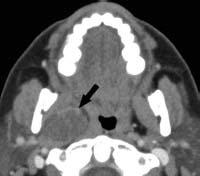
FIGURE 28-8. Axial postcontrast CT, in a different patient, shows a right-sided low-density schwannoma (arrow).
SUGGESTED READING
Kato H, Kanematsu M, Mizuta K, Ito Y, Hirose Y. Carcinoma ex pleomorphic adenoma of the parotid gland: radiologic-pathologic correlation with MR imaging including diffusion-weighted imaging. Am J Neuroradiol 2008;29:865–867.
Moonis G, Patel P, Koshkareva Y, Newman J, Loevner LA. Imaging characteristics of recurrent pleomorphic adenoma of the parotid gland. Am J Neuroradiol 2007;28:1532–1536.

KEY FACTS
 The normal parotid space contains the parotid gland, nodes, retromandibular vein (which arbitrarily divides the gland into deep and superficial portions in imaging studies), facial nerve (which anatomically divides the gland into deep and superficial portions), and external carotid artery.
 In a child with a parotid mass, consider hemangioma, lymphangioma, first branchial cleft cyst and pleomorphic adenoma.
 In AIDS patients with parotid masses, consider benign lymphoepithelial cysts, infection, and lymphoma.
 In adults, the most common tumors in this space are benign mixed tumor (pleomorphic adenoma) (>80%), Warthin tumor (especially in older males with bilateral parotid masses), mucoepidermoid carcinoma, adenoid cystic carcinoma (especially with multiple cranial nerve deficits secondary to perineural tumor spread), metastases, and lymphoma (especially in patients with multiple masses).
 Facial nerve palsy in the presence of a parotid mass implies malignancy and poor prognosis.
 Magnetic resonance imaging (MRI) reveals that benign tumors are hyperintense on T2, while malignant tumors are hypointense on T2. Diffusion-weighted imaging (DWI) shows malignant tumors to have restricted diffusion.
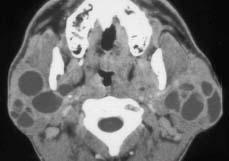
FIGURE 28-9. Axial computed tomography (CT) shows multiple intraparotid cysts in an AIDS patient.
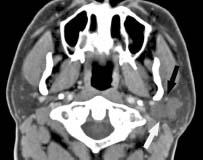
FIGURE 28-10. Axial contrast-enhanced CT, in a different patient, shows Warthin tumor (arrows) involving the left parotid gland.
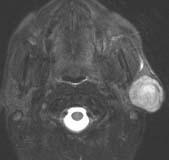
FIGURE 28-11. Axial T2e, in a different patient, shows well-defined hyperintense adenoma in the superficial lobe of the left parotid.
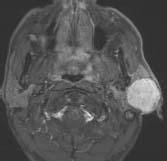
FIGURE 28-12. Corresponding postcontrast T1 shows the mass to have homogeneous enhancement.
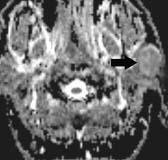
FIGURE 28-13. Axial ADC map in the same patient shows the adenoma (arrow) to have no restricted diffusion.
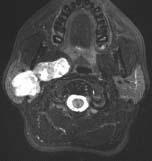
FIGURE 28-14. Axial T2, in a different patient, shows very large, mostly bright and well-defined, adenoma involving deep and superficial right parotid lobes.
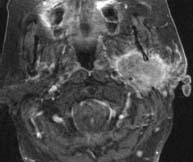
FIGURE 28-15. Axial postcontrast T1 in a patient with adenocarcinoma in the left parotid shows that mass involves both lobes, has in homogeneous enhancement, and has speculated margins with extension outside of tumor capsule.
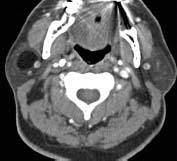
FIGURE 28-16. Axial CT, in a different patient, shows benign right parotid lipoma.
SUGGESTED READING
Shah GV, MR imaging of salivary glands. Magn Reson Imaging Clin N Am 2002;10:631–662.

KEY FACTS
 The retropharyngeal compartment (also called the “retrovisceraT compartment of the visceral space) is a potential space that contains fat and medial and lateral retropharyngeal nodes (between the prevertebral muscles and pharyngeal constrictor muscles) and extends from the base of the skull to T3. It is different from the “prevertebral” space that is limited posteriorly by the cervical vertebrae and anteriorly by the prevertebral fascia. The “danger” space is between the alar and prevertebral fascia and extends from the skull base to the posterior mediastinum.
 The most common lesions of the retropharyngeal space are inflammatory processes (especially in children), which include reactive adenopathy and abscesses. In children, calcific tenditis may produce swelling and pain.
 In adults, adenopathy at this level is suspicious for metastatic disease until proven otherwise.
 Other lesions include hemangioma, lipoma, lymphoma, and direct invasion by carcinoma. Occasionally, the internal carotid arteries (ICAs) (one or both) are in this location and may present as retropharyngeal pulsatile masses and cause dysphagia. In cases of inflammation, the corresponding ICA may be narrowed.
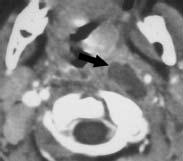
FIGURE 28-17. Axial CT shows left retropharyngeal abscess (arrow) probably from liquefaction of an infected lymph node.
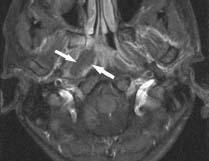
FIGURE 28-18. Axial fat-suppressed postcon-trast T1 image, in a different patient, shows non-enhancing necrosis (arrows) in a right abscess.
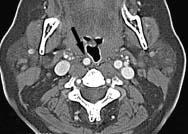
FIGURE 28-19. Axial postcontrast CT, in a different patient, shows retropharyngeal course of the right internal carotid artery (arrows).
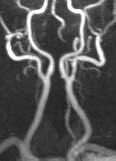
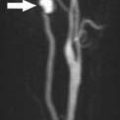
FIGURE 28-20. Frontal view from postcontrast neck magnetic resonance angiography (MRA), in a different patient, shows medialization of both proximal internal carotid arteries, which lie in a retropharyngeal location.
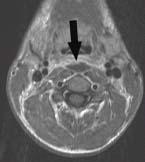
FIGURE 28-21. Axial postcontrast T1, in a different patient, shows midline retropharyngeal abscess (arrow).
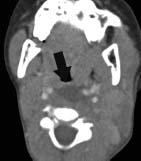
FIGURE 28-22. Axial postcontrast CT, in a different patient, shows retropharyngeal low-density fluid collection (arrow).
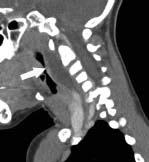
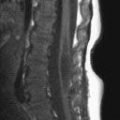
FIGURE 28-23. Sagittal CT reformation, in the same patient as 28-22, shows the fluid collection extending from C1-C5.
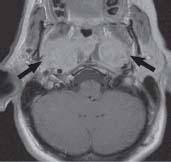
FIGURE 28-24. Axial postcontrast T1, in a different patient with lymphoma, shows massively enlarged retropharyngeal lymph nodes (arrow).
SUGGESTED READING
Chong VF, Fan YF. Radiology of the retropharyngeal space. Clin Radiol 2000;55:740–748.
Ide C, Trigaux J-P. Internal carotid artery narrowing in children with retropharyngeal lymphadenitis and abscess. Am J Neuroradiol 2000;21:233–234.
 ORAL CAVITY AND OROPHARYNGEAL SPACE MASSES
KEY FACTS
 Only 7% of masses in this area are malignant but >90% of malignancies are squamous cell carcinomas, followed by lymphoma, adenoid cystic carcinoma, mucoepidermoid carcinoma, and adenocarcinoma.
 In children, the most common lesions at this location are hemangioma, lymphangioma or cystic hygroma, and tonsillar abscesses.
 Common risk factors in adults include tobacco and alcohol use and HIV infection.
 Most masses in this region are found incidentally during routine physical examination, but pain in the external auditory canal is an important clinical symptom.
 Most tumors in this region arise in the floor of the mouth (divided by mylohyoid muscle into sub-mandibular [below] and sublingual [above] spaces), gingival folds, retromolar trigone, base of the tongue, and palate.
 Epidermoids and dermoids are distinct slow-growing lesions of the sublingual space that have a fatty appearance and may be identical to lipomas.
 Lingual thyroid should be included in the differential diagnosis of masses that enhance in the base of the tongue.
 Ranulas are retention cysts of salivary glands that may remain confined to sublingual space (simple) or cross the mylohyoid muscle (diving); diving ranulas have no true walls.
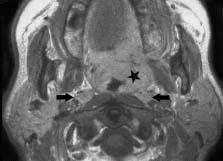
FIGURE 28-25. Axial postcontrast T1 shows carcinoma in the left palatine tonsil region (star) and bilaterally enlarged retropharyngeal lymph nodes (arrows).
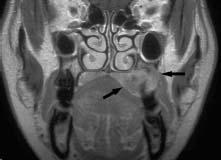
FIGURE 28-26. Coronal postcontrast T1, in a different patient, shows adenoid cystic cancer (arrows) involving the left maxilla and hard palate.
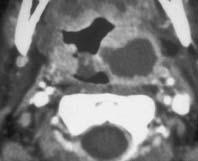
FIGURE 28-27. Axial postcontrast CT shows a left tonsillar abscess.
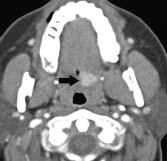
FIGURE 28-28. Axial postcontrast T1 in a patient with a mucoepidermoid cancer shows small, well-defined enhancing mass (arrows) in the soft palate.
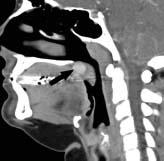
FIGURE 28-29. Midline postcontrast CT reformation in the same patient confirms that the mass (arrow) is in the soft palate.
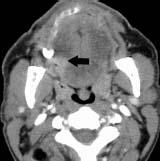
FIGURE 28-30. Axial postcontrast CT, in a different patient, shows tumor (arrow) in the right base of the tongue.
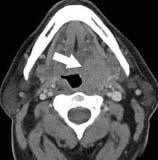
FIGURE 28-31. Axial postcontrast CT, in a different patient, shows bulky tumor (arrow) in the left tongue base extending posterior to tonsil via the glossotonsillar sulcus.
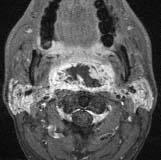
FIGURE 28-32. Axial postcontrast T1 in a patient with large necrotic undifferentiated sarcoma arising from the posterior wall of the oropharynx.
SUGGESTED READING
Yousem DM, Chalian AA. Oral cavity and pharynx. Radiol Clin N Am 1998;36:967–981.

KEY FACTS
 The masticator space normally contains the vertical mandibular ramus, masseter, temporalis, medial pterygoid and lateral pterygoid muscles, branches of the third division of the trigeminal nerve, and the inferior alveolar artery and vein and is enclosed by the superficial layer of the deep cervical fascia.
 Most common lesions occurring here include odontogenic infections (remember that infections may tract superiorly under the temporalis muscle), primary or secondary bone tumors, neurogenic tumors, lymphoma, leukemia, or invasion from squamous cell carcinoma originating in the retromolar triangle.
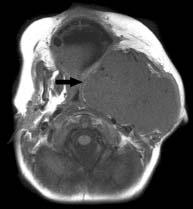
FIGURE 28-33. Axial noncontrast T1 shows large Ewing sarcoma arising from vertical mandibular ramus and involving all of the left masticator space. Note thin linear bright fat of parapharyngeal space (arrow) displaced medially.
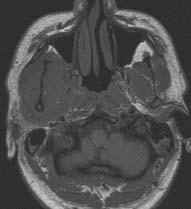
FIGURE 28-34. Axial noncontrast T1 in a patient with leukemia involving the right masticator space.
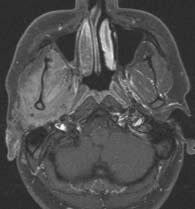
FIGURE 28-35. Corresponding postcontrast shows diffuse enhancement of the tumor.
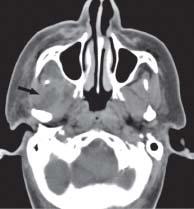
FIGURE 28-36. Axial postcontrast CT, in a different patient, shows inflammatory changes in the right masticator space with a deep low-density abscess (arrow).
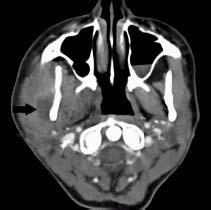
FIGURE 28-37. Axial postcontrast CT, in a different patient, shows an abscess (arrow) surrounded by significant swelling of masticator space structures. This abscess arose from dental disease.
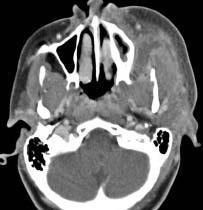
FIGURE 28-38. Axial postcontrast CT, in a different patient, shows phlegmonous changes in the left masticator space with an abscess in the ipsilateral buccal space.
SUGGESTED READING
Connor SE, Davitt SM. Masticator space masses and pseudomasses. Clin Radiol 2004;59:237–245.

KEY FACTS
 This space is located posterolateral to the lower maxilla and contains mostly fat but also carries the facial artery and vein and distal parotid duct; its lateral margin is the buccinator muscle.
 The processes affecting this space are similar to those involving the masticator space and in the majority of cases represent extension from the masticator space, maxilla, alveolar ridge, and maxillary sinus pathology.
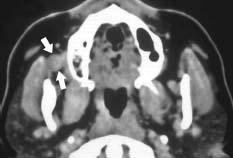
FIGURE 28-39. Axial CT shows pleomorphic adenoma (arrows) in the right buccal space.
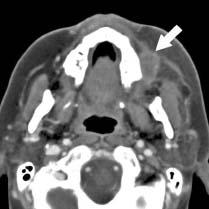
FIGURE 28-40. Axial CT in a different patient, shows an abscess (arrow) in the left buccal space. Note overlying stranding of fat due to inflammation.
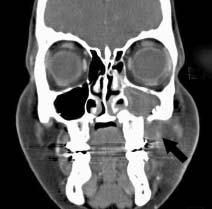
FIGURE 28-41. Coronal CT in the same patient shows the abscess (arrow), which is an extension of an ipsilateral maxillary sinus infection through a bone defect in the anterior wall of this sinus.
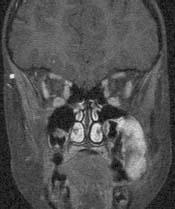
FIGURE 28-42. Coronal fat-suppressed postcontrast T1 in a patient with an osteosarcoma shows enhancing mass arising in the left maxilla extending laterally into the buccal space.
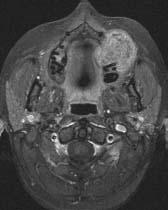
FIGURE 28-43. Axial fat-suppressed postcontrast T1 in a patient with a reparative granuloma arising in the left maxilla and presenting as a buccal space mass.
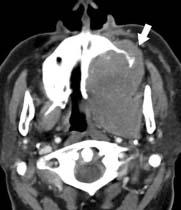
FIGURE 28-44. Axial CT, in a patient with a large carcinoma of the left maxillary sinus, showing extension into the buccal space (arrow).
SUGGESTED READING
Tart RP, Kotzur IM, Mancuso AA, Glantz MS, Mukherji SK. CT and MR imaging of the buccal space and buccal space masses. RadioGraphics 1995;15:531–550.
 SUBUNGUAL AND SUBMANDIBULAR SPACE MASSES
KEY FACTS
 The sublingual space is located superomedial to the mylohyoid muscle and mainly contains the tongue, lingual neurovascular plexus, sublingual glands and ducts, and Wharton ducts.
 Most common lesions: squamous cell carcinoma, tumors of the sublingual gland, cellulitis and abscesses, calculi, ranulas, lymphangioma, epi/dermoid, ectopic thyroid, and hemangioma (in children).
 The submandibular space is located inferolateral to the mylohyoid muscle, superior to the hyoid bone, and medial to the horizontal ramus of the mandible and contains most of the sumandibular gland, nodes, anterior belly of the digastric muscle, and facial vein and artery.
 Most common lesions: metastases, invasion by squamous cell cancer from the mouth, submandibular gland tumors, lipoma, epidermoid or dermoid, ranulas, infections, second branchial cleft cyst, and lymphangioma.
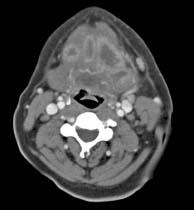
FIGURE 28-45. Axial postcontrast CT shows multiple sublingual abscesses in a patient with Ludwig angina.
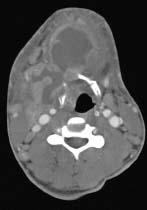
FIGURE 28-46. Axial postcontrast CT in a different patient with Ludwig angioma shows large abscesses in the submental and right submandibular regions with extensive surrounding inflammatory changes.
Related posts:
Stay updated, free articles. Join our Telegram channel

Full access? Get Clinical Tree


