Radiography of Acquired Heart Disease


Radiography of Acquired Heart Disease


Charles B. Higgins


The thoracic radiograph is one of the earliest points of departure in the evaluation of heart disease. It may provide the first indication that cardiac disease is present, but more frequently it is used to determine the severity of known or suspected disease. The severity of some cardiac diseases is readily reflected on the thoracic radiograph, while other significant diseases cause little or no alterations in the pulmonary vessels or cardiac silhouette. Consequently, the thoracic radiograph may have only limited value in the assessment of some diseases, while in others it may serve as one of the most sensitive and reliable gauges of the course of the disease. The propensity of various cardiac diseases to cause substantial cardiomegaly serves as the major dividing line in our system for cataloging acquired heart disease.


APPROACH TO THE CHEST X-RAY IN ACQUIRED HEART DISEASE

A systematic approach is directed toward discerning the pertinent findings from the radiograph and, for each finding, narrowing the array of diagnostic considerations. A free-floating approach places one into the unnecessary jeopardy of failing to examine salient features of the cardiovascular anatomy.

A five-step systematic approach permits the orderly examination of the thoracic radiograph, and at each step it is possible to narrow the diagnostic possibilities (Figs. 30-1 and 30-2). A radiographic classification of acquired heart disease is used in association with this five-step examination (see Fig. 30-2; Table 30-1).

The five steps in the examination of the thoracic radiograph in patients with suspected cardiac disease are (1) thoracic musculoskeletal structures, (2) pulmonary vascularity, (3) overall heart size, (4) specific chamber enlargement, and (5) great arteries (ascending aorta, aortic knob, main pulmonary arterial segment).


Thoracic Musculoskeletal Structures

Examination of the thoracic wall discloses evidence of prior operations, such as rib or sternal deformities or sternal wire sutures. Sternal deformities such as pectus may serve as a clue to cardiac lesions associated with it, such as Marfan’s syndrome and mitral valve prolapse; or perhaps the deformity is responsible for a cardiac murmur or even symptoms caused by cardiac compression. Narrow anteroposterior diameter of the thorax can be caused by a straight thoracic spine (straight-back syndrome) or pectus excavatum. A narrow anteroposterior diameter is defined as a distance between the sternum and the anterior border of the vertebral body that measures less than 8 cm and a ratio of the transverse diameter (determined by frontal view) to the anteroposterior diameter (determined by lateral view) exceeding 2.75. The anteroposterior diameter is the maximum diameter from the undersurface of the sternum to the anterior border of the vertebral body.


Pulmonary Vascularity (Pulmonary Edema)

There are three steps in assessing pulmonary vascularity: the type of abnormality (pulmonary arterial overcirculation vs. pulmonary venous hypertension [PVH]); the severity of the pulmonary vascular abnormality; and determination of the symmetry, asymmetry, or even focal nature of the abnormality. In patients with acquired heart disease, the type
of abnormality is usually PVH. The major signs of PVH are equalization or larger diameter of the upper compared to the lower lobe vessels; loss of prominence or clear visualization of the right lower lobe pulmonary artery; prominence of the interstitial markings, especially the appearance of Kerley A and B lines; indistinctness of the pulmonary vascular margins and/or hilar vessels; loss of the right hilar angle; and alveolar filling (Figs. 30-3,30-4,3-5 and 30-6). After repeated episodes of pulmonary edema in longstanding cases of mitral valve disease, permanent interstitial lines or ossific nodules may appear. Ossific nodules are small foci of bony metaplasia that appear in the lungs only after multiple episodes of edema and chronic PVH. Foci of hemosiderin may form fibrotic nodules in patients with multiple episodes of edema as well as after multiple episodes of pulmonary hemorrhage.


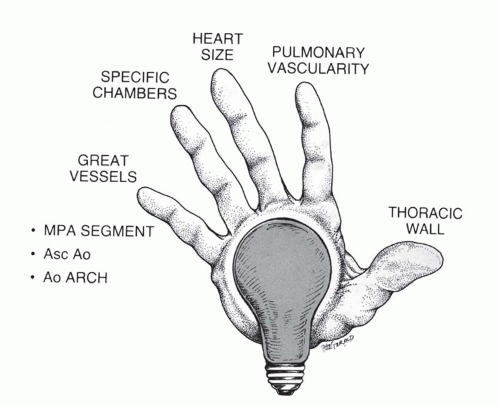
FIG. 30.1. Five-step approach to analysis of the thoracic radiograph in cardiac disease.


FIG. 30.2. Diagnostic pathway for the identification of the hemodynamically predominant cardiac lesion. Signposts gleaned from the thoracic radiograph guide the analysis.


TABLE 30.1 Radiographic Classification of Acquired Heart Disease


Small Heart (C/T < 0.55)


Large Heart (C/T > 0.55)


Aortic stenosis


Aortic regurgitation


Arterial hypertension


Mitral regurgitation


Mitral stenosis


Tricuspid regurgitation


Acute myocardial infarction


High-output states


Hypertrophic cardiomyopathy


Congestive cardiomyopathy


Restrictive cardiomyopathy


Ischemic cardiomyopathy


Constrictive pericarditis


Pericardial effusion


Paracardiac mass


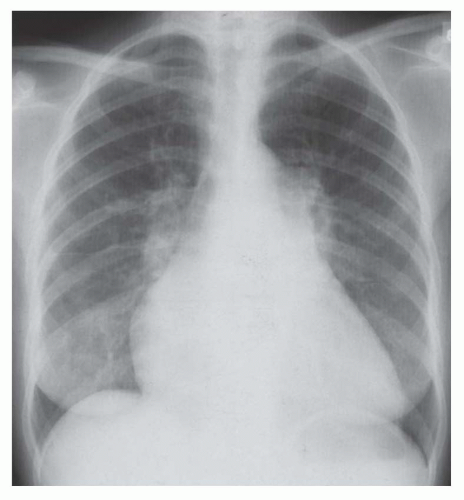
FIG. 30.3. Pulmonary venous hypertension in mitral valve disease. Radiograph demonstrates redistribution of pulmonary blood flow (upper lobe vessels larger than lower lobe vessels) indicating grade I pulmonary venous hypertension. There is cardiomegaly and straightening of the upper left cardiac border indicative of left atrial enlargement.

The severity of PVH can be gauged by the signs observed. The radiographic severity of PVH can be divided into three grades: grade I (redistribution of pulmonary blood volume); grade II (interstitial pulmonary edema); and grade III (alveolar
pulmonary edema; Table 30-2). The pulmonary venous pressure (or mean left atrial wedge pressure) associated with edema varies depending on whether the cardiac dysfunction is acute or chronic (Table 30-3). The venous pressure in chronic disease is approximately 5 mm Hg greater for each grade of PVH compared to that in acute disease.


FIG. 30.4. Interstitial pulmonary edema after acute myocardial infarction. Radiograph demonstrates interstitial pulmonary edema with Kerley B lines, indistinct vascular margins, and peribronchial cuffing.


FIG. 30.5. Noncardiac pulmonary edema. Alveolar pulmonary edema with normal heart size in a child after drowning.


Asymmetric PVH

Asymmetric distribution of PVH or pulmonary edema raises a number of diagnostic possibilities (Table 30-4, Fig. 30-7). The most frequent cause of such asymmetry is probably gravitational; patients with heart disease frequently sleep lying on their right side because of consciousness of the prominent left-sided pulsation (prominent point of maximum impulse in the presence of cardiomegaly). The next most frequent cause is underlying lung disease such as chronic obstructive pulmonary disease, which obliterates portions of the pulmonary vascular bed. Edema or pulmonary venous distention appears in the normal or less severely abnormal portions of the lungs. Unilateral pulmonary edema may occur contralateral to an occluded or severely stenotic pulmonary artery. Such unilateral edema might appear contralateral to a pulmonary embolism, or a pulmonary artery stenosis caused by congenital anomalies (branch pulmonary arterial stenosis, proximal interruption or agenesis of a pulmonary artery) or acquired diseases (bronchogenic carcinoma, Takayasu’s arteritis, fibrosing mediastinitis, mediastinal tumors). Unilateral edema is infrequently used by unilateral obstruction of pulmonary veins caused by mediastinal or lung tumors, primary and
secondary tumors of the heart and pericardium, mediastinal fibrosis, and complications of the Mustard procedure and other procedures used in congenital heart disease. Finally, pulmonary edema induced by reinflation of a collapsed lung or after thoracentesis must be considered.


FIG. 30.6. Alveolar pulmonary edema with normal heart size in a patient with left atrial myxoma obstructing the mitral valve.


TABLE 30.2 Signs of Pulmonary Ventricular Hypertension by Grade of Severity


Grade I: vascular redistribution


Equal upper and lower lobe vessels


Larger upper lobe vessels


Grade II: interstitial edema


Kerley A or B lines


Increased prominence of “interstitial markings”


Peribronchial cuffing


Loss of the hilar angle


Enlargement and indistinctness of hila


Subpleural edema (increased thickness of pleura)


Loss of visibility of much of the descending branch of the right pulmonary artery


Grade III


Confluent acinar shadows (pulmonary alveolar edema)


Perihilar alveolar filling


Lower lobe or more generalized alveolar filling


TABLE 30.3 Correlates of Left Atrial Pressure (Mean)a and Pulmonary Vascular Hypertension Grade


Left Atrial Pressure


Acute Disease (Myocardial Infarction)


Chronic Disease (Mitral Stenosis)


Grade I


12-19 mm Hg


15-25 mm Hg


Grade II


20-25 mm Hg


25-30 mm Hg


Grade III


25 mm Hg


30 mm Hg


aLeft atrial mean pressure is usually inferred from the mean pulmonary wedge pressure. Correlation between left atrial pressure and radiographic signs of pulmonary edema is only fair because of phase lag between rapid pressure changes and slower changes inradiographic alterations.


TABLE 30.4 Unilateral Pulmonary Edema


Gravitational


Chronic lung disease (emphysema)


Unilateral pulmonary arterial obstruction


Thromboembolic disease


Extrinsic obstruction of pulmonary artery


Lung cancer, thoracic aortic aneurysm, mediastinal fibrosis


Unilateral pulmonary venous obstruction


Left atrial tumor


Mediastinal tumor encasing pulmonary veins


Mediastinal fibrosis


Reexpansion pulmonary edema


Postpneumothorax, postthoracentesis


Pulmonary edema may occur in the absence of underlying cardiac disease. Such noncardiogenic edema is usually due to damage to the alveolar-capillary membrane, causing a leak of fluid into the lung at normal or near-normal pulmonary venous pressure and capillary oncotic pressure. A partial list of the many settings in which this occurs is shown in Table 30-5.


Overall Heart Size

Acquired heart disease can be divided into two groups, depending on the presence or absence of substantial cardiomegaly. “Small heart” heart disease is associated with a normal heart size or only mild cardiomegaly. For the sake of our discussion, we will set a cardiothoracic (CT) ratio of less than 0.55 as consistent with this group of lesions. The choice of 0.55 is obviously somewhat arbitrary. The CT ratio is calculated using the convention of measuring the thoracic diameter as the distance from the inner margin of the ribs at the level of the dome of the right hemidiaphragm and the cardiac diameter as the horizontal distance between the most rightward and most leftward margins of the cardiac shadow. The second group, called “big heart” heart disease, is characterized by substantial cardiomegaly (CT ratio greater than 0.55).


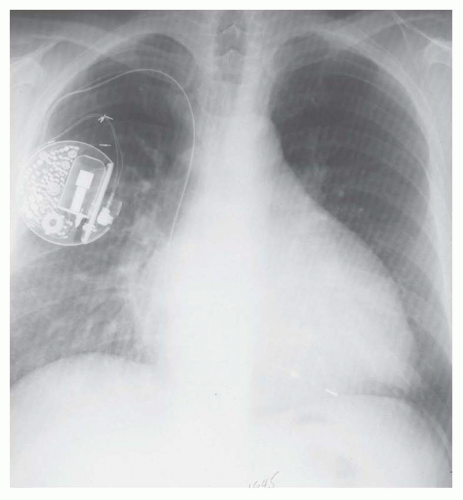
FIG. 30.7. Asymmetric pulmonary edema. Unilateral pulmonary edema in a patient with a metastatic tumor selectively obstructing the right pulmonary veins. Note the increased density of the right lower lung field.


TABLE 30.5 Noncardiogenic Pulmonary Edema


Drowning


Asphyxia


Upper airway obstruction


High altitude


Increased intracranial pressure


Reexpansion pulmonary edema


Noxious gases


Smoke inhalation


Nitrous dioxide (silo filler’s disease)


Sulfur dioxide


Others


Drugs


Aspirin


Valium, librium, barbiturates, heroin, cocaine, methadone


Poisons—parathion


Blood transfusion reaction


Contrast media reaction


Adult respiratory distress syndrome


The pathophysiologic factors associated with “small heart” heart disease are pressure overload and reduced ventricular compliance. The pathophysiologic factors associated with “big heart” heart disease are volume overload and myocardial failure. Pericardial effusion also is included in this group.

The cardiac lesions included in the two groups are listed in Table 30-1. The major pressure overload types of acquired lesions are aortic and mitral stenosis and hypertension. The major volume overload types of acquired lesions are aortic, mitral, and tricuspid regurgitation and high output states. Cardiac diseases that cause reduced left ventricular (LV) compliance or resistance to full expansion of the ventricles are acute myocardial infarction (MI), hypertrophic cardiomyopathy, restrictive cardiomyopathy, and constrictive pericardial disease.


Specific Chamber Enlargement

It is not until the fourth step in the examination of the chest x-ray that attention should be directed to determining specific chamber enlargement. A critical observation is the identification of left atrial enlargement. It is also useful to determine which ventricle is enlarged or if both
ventricles are enlarged. It is sometimes not possible to clearly determine the type of ventricular enlargement on the thoracic radiograph. The radiographic signs observed with enlargement of each of the cardiac chambers are given below.


Left Atrial Enlargement


  • Right retrocardiac double density. Distance from the middle of the double density (lateral border of left atrium) to the middle of the left bronchus is less than 7 cm in greater than 90% of normal subjects and greater than 7 cm in 90% of patients with left atrial enlargement, proven by echocardiography (Figs. 30-8 and 30-9). In cases of severe left atrial enlargement, the right atrial border may extend further to the right than the right atrial border (Fig. 30-10).


  • Enlargement of the left atrial appendage. This is seen as a bulge along the left cardiac border just beneath the main pulmonary artery segment (see Figs. 30-8,30-9 and 30-10). Using the left bronchus as an orientation point, the bulge above it is the main pulmonary artery segment, while the bulge at the level of and/or just below the left bronchus is the left atrial appendage.


  • Splaying of the carina and/or elevation of the left bronchus (see Figs. 30-10 and 30-11)


  • Horizontal orientation of the distal portion of the left bronchus


  • Posterior displacement of the left upper lobe bronchus (see Fig. 30-11). On the lateral radiograph, the circular shadow of the right upper lobe and left bronchi is located within the tracheal air column. Left atrial enlargement causes displacement of the left bronchus posterior to this level and beyond the plane of the trachea.


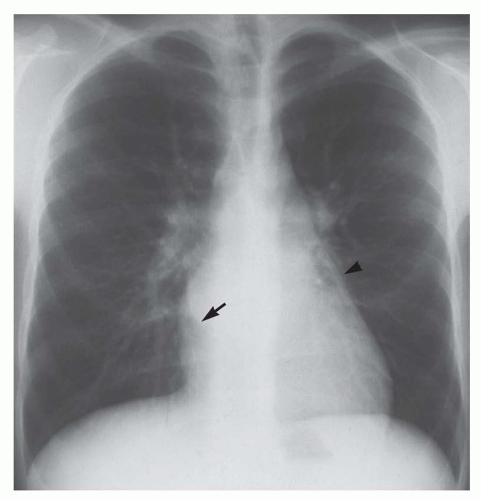
FIG. 30.8. Mitral stenosis causing left atrial enlargement. Subtle convexity along the upper left cardiac border is caused by enlargement of the left atrial appendage (arrowhead). Note right retrocardiac double density (arrow) caused by enlargement of the left atrial chamber.


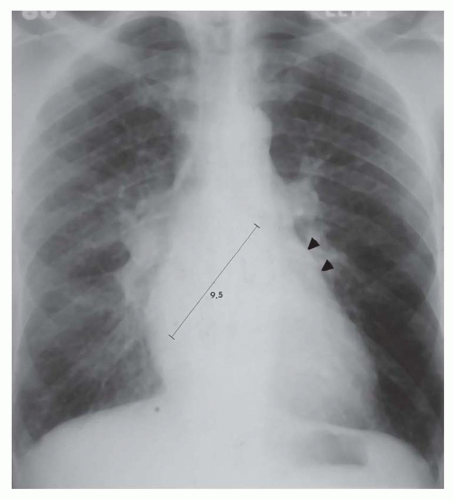
FIG. 30.9. Left atrial double intensity in mitral regurgitation. The left atrial dimension is the length of a line from the middle of the double density to the medial border of the left bronchus. A value greater than 7 cm indicates left atrial enlargement. Note also enlargement of the left atrial appendage (arrowheads).


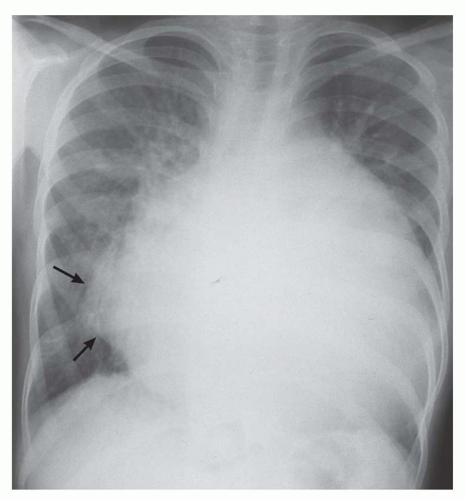
FIG. 30.10. Mitral regurgitation. There is cardiomegaly and marked left atrial enlargement with pulmonary ventricular hypertension. The left atrium is enlarged to the extent that it forms the right heart border on the frontal view (arrows).


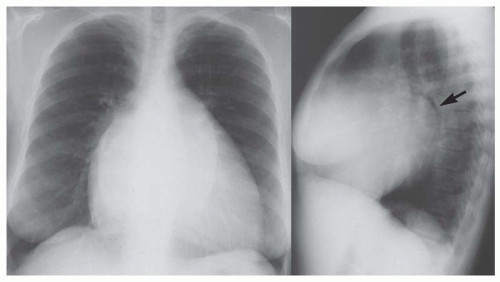
FIG. 30.11. Mitral and tricuspid regurgitation. Frontal (left) and lateral (right) radiographs show prominent double densities on both sides of the spine due to marked left atrial enlargement. Right atrial enlargement is shown by the elongation of the right-sided convexity on the front view. Prominent upper left cardiac border on frontal view is caused by dilatation of the right ventricular outflow region. Lateral view shows posterior displacement of the left bronchus (arrow) by the enlarged left atrium and obliteration of the retrocardiac space by right ventricular enlargement.


Right Atrial Enlargement


  • Lateral bulging of the right heart border on the posteroanterior radiograph (see Fig. 30-11)


  • Elongation of the right heart border on the posteroanterior view. A rough rule is that a right atrial border exceeding 60% in length of the mediastinal cardiovascular shadow is a sign of substantial right atrial enlargement (Fig. 30-12).


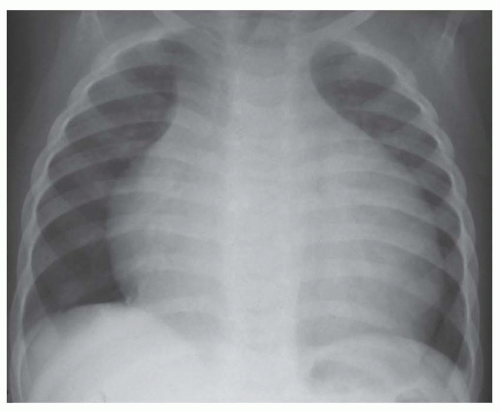
FIG. 30.12. Tricuspid regurgitation. Severe right atrial enlargement is evident by the elongation of the right atrial shadow. The length of the right atrial border exceeds 60% of the height of the mediastinal cardiovascular structures.


Left Ventricular Enlargement


  • On the posteroanterior view, leftward and downward displacement of the cardiac apex. The vector of enlargement of the LV is leftward and downward compared with the vector of right ventricular enlargement, which is leftward only or perhaps leftward plus upward (Figs. 30-13 and 30-14).


  • On the lateral view, the posterior border of the heart is displaced posteriorly. The Hoffman-Rigler sign is measured 2.0 cm above the intersection of the diaphragm and the inferior vena cava. A positive measurement for LV enlargement is a posterior border of the heart extending more than 1.8 cm behind the inferior vena caval shadow at this level.


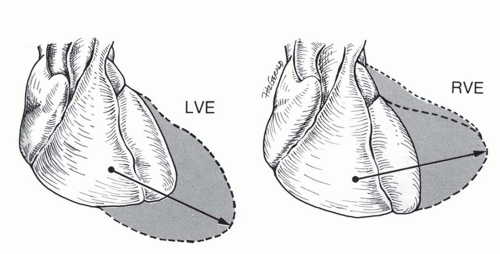
FIG. 30.13. “Vectors of enlargement” for the left and right ventricles. For left ventricular enlargement (LVE), the vector is directed leftward and caudal. For right ventricular enlargement (RVE), the vector is directed leftward or leftward and slightly cranial.


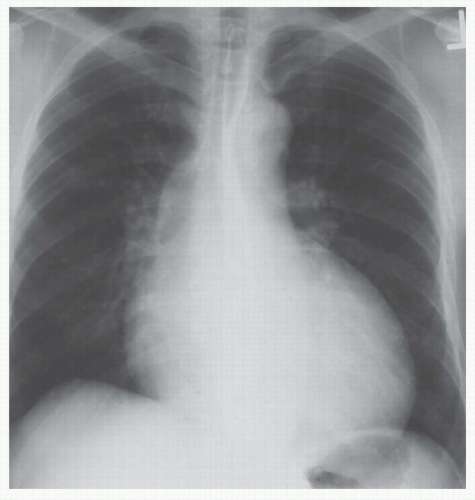
FIG. 30.14. Aortic regurgitation. The ventricular contour is enlarged along a left inferolateral vector, causing the apex to droop over the left hemidiaphragm. Concavity along the upper left cardiac border indicates that the right ventricle is not enlarged. There is enlargement of the thoracic aorta.


Right Ventricular Enlargement


  • On the posteroanterior view, the left border of the heart is enlarged directly laterally or laterally and slightly superiorly (see Fig. 30-13). In some instances, this causes the apex to be displaced superiorly (“upward tipped apex”; Fig. 30-15); in the extreme form this causes a “boot shape” (Fig. 30-16).


  • On the lateral view, the retrosternal space is encroached upon by the enlarged right ventricle. Right ventricular enlargement is inferred by contact of the right heart border over greater than one third of the sternal length. A prominent convexity to the anterior border rather than the usual straight surface is an early sign of right ventricular enlargement.


Signposts for Cardiac Valvular Lesions

There are three signposts on the thoracic radiograph that direct attention to a certain cardiac valve:


  • Left atrial enlargement


  • Ascending aortic enlargement


  • Right atrial enlargement

These signs point specifically to the following:


  • Mitral valve (left atrium)


  • Aortic valve (ascending aorta)


  • Tricuspid valve (right atrium)


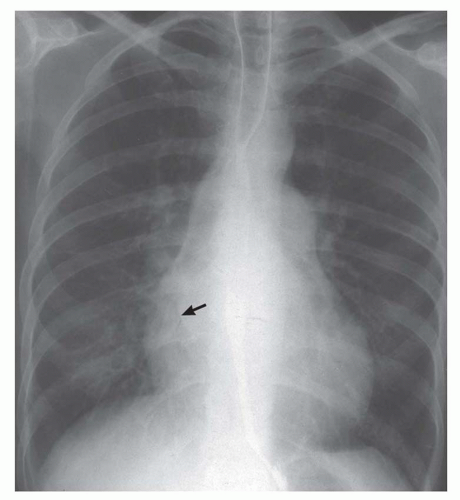
FIG. 30.15. Mitral stenosis with pulmonary arterial hypertension and interstitial pulmonary edema. Cardiomegaly is caused by right ventricular enlargement. The vector of enlargement of the ventricle is directly lateral, indicating right ventricular enlargement. The most lateral portion of the apex is located above the diaphragm. Left atrial enlargement is indicated by double density (arrow). Pulmonary arterial hypertension is indicated by pulmonary arterial enlargement.

Using our classification system (“big heart” vs. “small heart” heart disease) and applying the signpost, we can analyze the thoracic radiograph in accordance with the flow diagram shown in Figure 30-2. This schema obviously works well
for diseases causing typical alterations in the chest x-ray. Of course, a specific cardiac lesion does not always cause typical features because of other associated abnormalities or because the lesion is very mild or has been present for insufficient time to alter the cardiac morphology to a degree discernible on the thoracic radiograph.


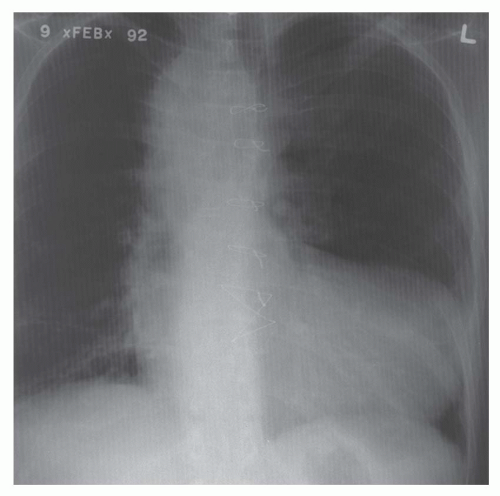
FIG. 30.16. Tetralogy of Fallot after total correction with severe pulmonary regurgitation. Substantial right ventricular enlargement is evident. The vector of enlargement of the ventricle is leftward and cranial, causing uplifting of the apex in relation to the diaphragm. Note the right aortic arch.


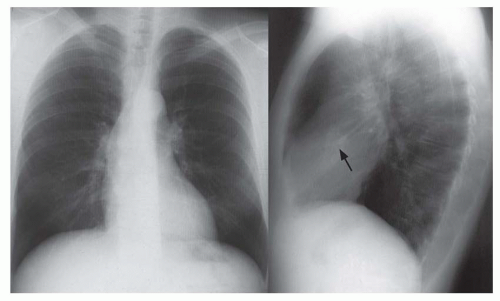
FIG. 30.17. Aortic stenosis with calcification in 43-year-old man. Frontal radiograph (left) shows a nearly normal appearance except for enlargement of the ascending aorta. Lateral view (right) demonstrates heavy calcification (arrow) of the aortic valve.

The schema can be briefly described by considering the chest x-ray that shows a normal heart size or mild cardiomegaly in a patient with significant heart disease. This means that the lesion likely causes pressure overload (hypertension, aortic stenosis, or mitral stenosis) or reduced LV compliance. If the left atrial signpost is present, then attention is directed to the mitral valve (see Fig. 30-8). The diagnosis should be either mitral valvular stenosis or resistance to left atrial emptying. Diseases that significantly reduce LV compliance (and increase LV diastolic pressure) cause resistance to left atrial emptying and thereby induce left atrial enlargement. Diseases that may reduce LV compliance are hypertrophic cardiomyopathy, restrictive cardiomyopathy, and constrictive pericardial disease. Acute MI may also reduce LV compliance, but usually this has not been present for a sufficient time to cause left atrial enlargement. LV hypertrophy from any cause can reduce LV compliance if it is sufficiently severe.

If the ascending aorta is enlarged, then this signpost points to the aortic valve, indicating aortic stenosis (Fig. 30-17). Systemic hypertension can produce a similar appearance, although it usually causes enlargement of the entire thoracic aorta rather than the ascending aorta alone. If no signposts are present, then the diagnosis is unlikely to be a valvular lesion. The absence of signposts should direct attention to a disease directly afflicting the myocardium or pericardium, such as acute MI, hypertrophic cardiomyopathy, restrictive cardiomyopathy, and constrictive pericardial disease. However, even these latter diseases sometimes induce left atrial enlargement, as stated above.

The schema for a patient with substantial cardiomegaly proceeds along the following path. The big heart suggests that there is either a volume overload lesion (valvular regurgitation) or myocardial failure or pericardial effusion. High output states are certainly a volume overload and can cause substantial cardiomegaly, but sometimes they cause only mild cardiomegaly. If left atrial enlargement is noted, then the signpost points to mitral regurgitation (Figs. 30-18 and 30-19). If the ascending aorta is enlarged in “big heart” heart
disease, then this signpost points to aortic regurgitation (see Fig. 30-14). If the right atrium is enlarged, then this signpost points to tricuspid regurgitation (see Fig. 30-11). Acquired pulmonic regurgitation is rare, except as a consequence of operation for right ventricular outflow obstruction, and is not considered in this schema. If no signposts are present, then the favored diagnostic considerations are congestive (dilated) cardiomyopathy or pericardial effusion.


FIG. 30.18. Mitral regurgitation with pulmonary arterial hypertension. There is cardiomegaly and left ventricular and left atrial enlargement. The pulmonary arterial enlargement indicates pulmonary arterial hypertension. There is also right lower lobe pneumonia.


FIG. 30.19. Mitral regurgitation causing cardiomegaly and left ventricular and left atrial enlargement. Note the enlarged left atrial appendage (arrowheads). Left atrial dimension is 9.5 cm.


RADIOGRAPHIC FEATURES OF SPECIFIC CARDIAC LESIONS


Aortic Stenosis

Aortic stenosis is a pressure overload lesion for which the compensatory mechanism is concentric LV hypertrophy (Table 30-6). Concentric LV hypertrophy causes a slight reduction in the volume of the LV but little increase in the overall cardiac size. Consequently, aortic stenosis, for much of its natural history, is a disease that is clearly “small heart” heart disease. There is little or no cardiac enlargement. The characteristic radiographic feature is enlargement of the ascending aorta (see Figs. 30-17, 30-20, and 30-21). The pulmonary vascularity is also generally normal for much of the course of aortic stenosis. However, in the decompensated phase of aortic stenosis, there may be evidence of PVH due to LV failure. Occasionally, when LV hypertrophy has reduced LV compliance considerably, there may also be signs of PVH even in the absence of LV enlargement.

Only gold members can continue reading. Log In or Register to continue

Stay updated, free articles. Join our Telegram channel

Oct 10, 2016 | Posted by in CARDIOVASCULAR IMAGING | Comments Off on Radiography of Acquired Heart Disease

Full access? Get Clinical Tree

Get Clinical Tree app for offline access