I ACUTE (<24 HOURS) MIDDLE CEREBRAL ARTERY INFARCT, COMPUTED TOMOGRAPHY
KEY FACTS
 Cerebral strokes are third most common cause of death in the United States; mortality with each episode varies between 15% and 35%.
 75% of all cerebral infarctions involve the territory of middle cerebral artery (MCA).
 Emboli originating from atherosclerosis of the common and internal carotid arteries are the most common cause of MCA occlusion.
 60% of patients show computed tomography (CT) abnormalities between 3 and 6 hours (earlier with perfusion imaging); all show abnormalities by 24 hours.
 10% of “strokes” are not caused by ischemia.
 The importance of CT is in establishing the presence of absence of hemorrhage and therefore prescribing thrombolytic or conservative treatment.
 Findings that preclude thrombolysis: hemorrhage, involvement of more than one third of the MCA territory hypodensity over 4.5 hours, and mass effect.
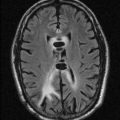
 Early signs (0 to 24 hours) include hyperdense MCA on plain CT (25% to 50%), “disappearing” lenti-form nucleus, and loss of the insular cortex (may require use of narrow or “stroke” windows).
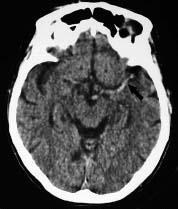
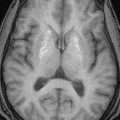
FIGURE 9-1. Axial noncontrast CT shows hyperdense left middle cerebral artery (MCA) (arrow).
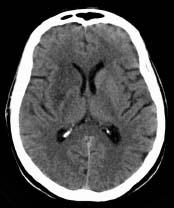
FIGURE 9-2. Axial CT, In a different patient, shows low density In right basal ganglia and head of caudate nucleus compatible with an acute right MCA Infarction.
 CT and MR perfusion detect areas of impaired blood flow immediately.
 Computed tomography angiography (CTA) and magnetic resonance angiography (MRA) may be used to detect occlusion at Ml segment that allows patient to be treated with intra-arterial thrombolysis or “clot retrieval.”
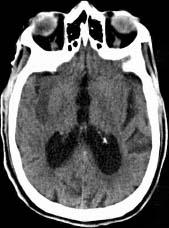
FIGURE 9-3. Axial CT, in a different patient, demonstrates low density in the right insular cortex in a patient with a right MCA stroke.
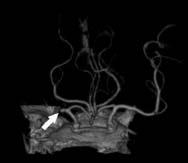
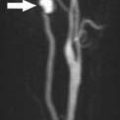
FIGURE 9-4. Frontal view from CTA, in a different patient, shows an occluded right MCA (arrow) (See color insert)
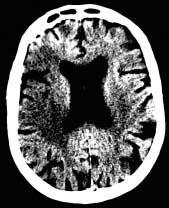
FIGURE 9-5. Axial CT, in a different patient, with narrow windows accentuates the right MCA nfarction.
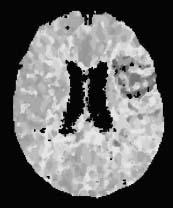
FIGURE 9-6. Axial CT perfusion study, in a different patient, shows prolonged mean transit time (MTT) corresponding to a left MCA infarct (rea and yellow). (See color insert).
SUGGESTED READING
Eastwood JD, Lev MH, Wintermark M, Fitzek C, Barboriak DP, Delong DM, et al. Correlation of early dynamic CT perfusion imaging with whole-brain MR diffusion and perfusion imaging in acute hemispheric stroke. AJNR Am J Neuroradiol 2003;24:1869-1875.
Symons SP, Cullen SR Buonanno F, Gonzalez GR, Lev MH. Noncontrast conventional computed tomography in the evaluation of acute stroke. Semin Roentgenol 2002:37:185-191.
 I ACUTE (<24 HOURS) MIDDLE CEREBRAL ARTERY INFARCT, MAGNETIC RESONANCE IMAGING
KEY FACTS
 Conventional magnetic resonance imaging (MBI)
 Earliest abnormality is “intravascular enhancement sign,” which may be seen 2 hours after ictus and probably is cause by slow bright intra-arterial blood flow.
 Meningeal enhancement overlying the infarcted territory is seen in 30% of cases during the first 3 days.
 Cortical edema (hyperintensity, increase thickness and a blurry gray-white junction) may be seen as early as 3 hours after a stroke, particularly on FLAIR.
 Occluded arteries may appear bright on FLAIR and of low signal on T2 * images. Dilated veins on SWI may be the first sign of infarction. MRA shows lack of flow-related enhancement in occluded arteries.
 Diffusion weighted imaging (DWI)
 AH infarcts seen between 10 and 60 minutes.
 May miss small infarcts nearbaseof skull.
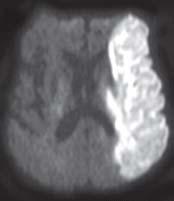
FIGURE 9-7. Axial DWI shows a bright left MCA acute infarction.
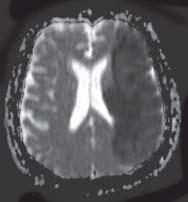
FIGURE 9-8. Corresponding ADC maps show low signal in the same location confirming presence of restricted diffusion.
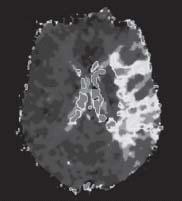
FIGURE 9-9. TTP MR perfusion map, in a different patient, shows prolonged time in the territory of a left MCA infarction. (See color insert)
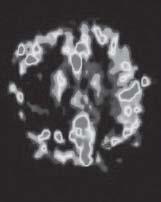
FIGURE 9-10. MR arterial spin labeled CBF map, in a different patient, shows low flow in the right MCA territory infarction. (See color insert)
 Area of restricted diffusion on apparent diffusion coefficient (ADC) map needs to be compared to perfusion defect; difference between them is the penumbra (area at risk).
 Perfusion
 Use time-to-peak (TTP), MTT, and relative cerebral blood flow (rCBF) maps to judge hypoper-fused area (rCBV may be falsely normal due to “luxury” and collateral perfusion).
 Eventual size of infarct will be in between that as seen on ADC and on perfusion studies.
 Patients with large penumbras require more aggressive therapy to save these regions.
 SWI
SWI
 May show dilated veins in the region of infarction as early as DWI.
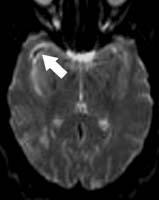
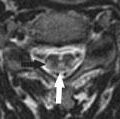
FIGURE 9-11. AxialT2 GRE, in a different patient, shows low signal (arrow) from the right MCA clot.
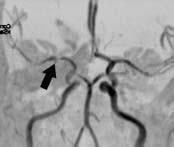
FIGURE 9-12. Frontal MRA, in a different patient with a right MCA infarction, shows arterial stenosis (arrow).
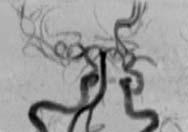
FIGURE 9-13. Oblique MRA, in a different patient, shows an occluded proximal left MCA.
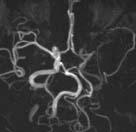
FIGURE 9-14. Base view from MRA, in a different patient with left internal carotid artery (ICA) dissection, shows very low flow-related signal in the ipsilateral MCA.
SUGGESTED READING
Schaefer PW, Romero JM, Grant PE, Wu O, Sorensen G, Koroshetz W, et al. Diffusion magnetic resonance imaging of acute ischémie stroke. Semin Roentgenol 2002;37:219-229.
Schaefer PW, Romero JM, Grant PE, Wu O, Sorensen G, Koroshetz W, et al. Perfusion magnetic resonance imaging of acute ischémie stroke. Semin Roentgenol 2002;37:230-236.
 SUBACUTE (2 TO 21 DAYS) MIDDLE CEREBRAL ARTERY INFARCT, COMPUTED TOMOGRAPHY
KEY FACTS
 Hemorrhage (especially in basal ganglia and cortex) occurs spontaneously in approximately 15% of all patients with MCA strokes (most common cause currently of hemorrhagic infarction is previous administration of thrombolytic drugs).
 Hemorrhagic transformation may occur 1 to 4 days after onset of infarction.
 Mass effect increases during the first 3 days, and CT shows a wedge-shaped area of low density, which involves both gray and white matter.
 CT has a sensitivity of over 90% in detection of subacute infarcts of the MCA
 Gyral enhancement (which may reflect luxury perfusion) begins between 3 and 7 days after ictus and may correlate with a better prognosis than infarcts with no gyral enhancement.
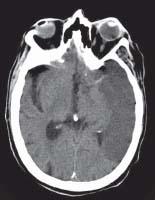
FIGURE 9-15. Axial CT shows low density in the territory of the left MCA. Note that the ipsilateral MCA remains hyperdense.
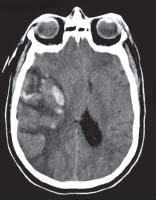
FIGURE 9-16. In a different patient, CT shows hemorrhagic transformation of the right MCA infarct after systemic administration of the thrombolytic agent.
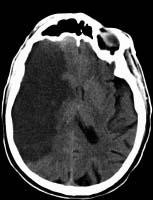
FIGURE 9-17 Axial non-contrast CT 10 days post MCA infarction in a different patient shows wel defined low density and mass effect.
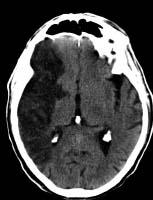
FIGURE 9-18. Axial non-contrast CT in same patient as 9-17 one month later shows decreased size of low density and absence of mass effect with structures returning to midline
SUGGESTED READING
Marks ME CT in ischemie stroke. Neuroimaging Clin North Am 1998;8:515-523.
 SUBACUTE INFARCTION, MAGNETIC RESONANCE IMAGING
KEY FACTS
 Conventional MRI
 Intravascular and meningeal enhancement disappear and are followed by parenchymal (especially cortex) enhancement beginning 3 to 7 days after ictus and may persist from 1 week to 6 months.
 75% of all subacute infarctions show parenchymal contrast enhancement.
 Infarct becomes hyperintense on FLAIR and T2; adjacent cerebrospinal fluid may be also bright on FLAIR (due to protein extravasation?). At about 14 days, infarct may become less obvious on T2 (‘fogging’ effect, same may occur with CT).
 T2 hypointensity in tissues surrounding infarct may represent impaired axonal transport of iron.
 DWI:
DWI:
 DWI signal begins to fade by 7 to 10 days and nearly normalizes by 14 days (“pseudonormalization”). Restricted ADC persists longer.
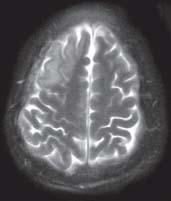
FIGURE 9-19. Axial T2 shows right frontal white/ gray matter edema of a subacute infarction.
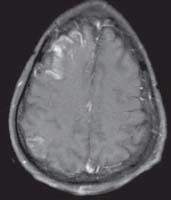
FIGURE 9-20. Corresponding T1 with contrast demonstrates cortical enhancement in the right frontal infarction and a second enhancing infarct in the right parietal region.
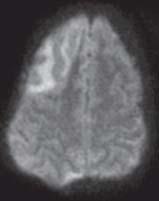
FIGURE 9-21. On the corresponding DWI, the frontal subacute infarction in only faintly bright and the posterior one is not seen.
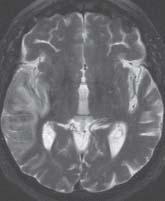
FIGURE 9-22. Axial T2, in a different patient, shows the right MCA subacute infarct not as bright as expected for an acute one.
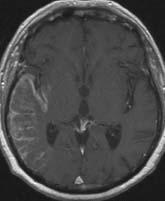
FIGURE 9-23. Corresponding postcontrast T1 shows cortical and pial enhancement.
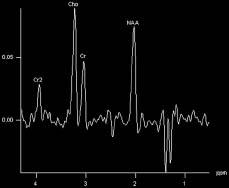
FIGURE 9-24. Magnetic resonance spectros-copy (MRS), longTE, shows high choline presumably due to inflammation, low A/-acetyl-aspartate (NAA) due to neuronal damage, and inverted lactate peak due to ischemia.
SUGGESTED READING
Romero J, Schaefer P, McDonal C, Schwamm, Gonzalez RG. Conventional magnetic resonance imaging of acute stroke. Semin Roentgenol 2002;37:206-211.
 ACUTE ANTERIOR (ACA) AND POSTERIOR (PCA) CEREBRAL ARTERY INFARCTS
KEY FACTS
 ACA infarcts
 Most occur in combination with ICA occlusion; isolated ACA infarctions are rare (< 1%).
 Most result from primary vessel disease and not emboli.
 May be secondary to subfalcine herniation and “clipping” of the ACA under the falx cerebri.
 By imaging the most common sign is hypodensity (CT) or hyperintensity (MR T2/FLAIR) along the medial cerebral convexity.
 PCA infarctions
 Are most common after internal and MCA ones; may also be seen with downward transtento-rial herniation secondary to compression of PCA between temporal lobe and edge of tentorium.
 Involvement of the medial occipital lobe causes homonymous hemianopsia.
 General rule: In all young patients with stroke consider trauma; drug abuse (cocaine, amphetamines); coagulopathy (sickle cell disease, antiphospholipid syndrome); vasculitides (lupus, granulomatous angiitis); oral contraceptives; and steroids.
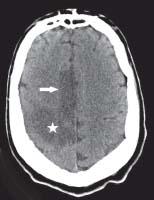
FIGURE 9-25. Axial CT shows low density in the territory of the right ACA (arrow) and also in the posterior territory of the ipsilateral MCA (star).
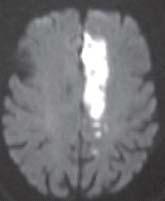
FIGURE 9-26. Axial DWI, in a different patient, shows typical distribution of the left ACA infarction.
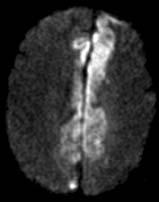
FIGURE 9-27. Axial DWI, in a different patient, shows bilateral acute ACAs infarctions.
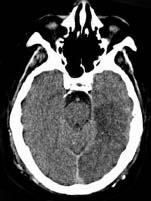
FIGURE 9-28. Axial CT, in a different patient, showing a low-density infarction in the maximum region supplied by the left PCA.
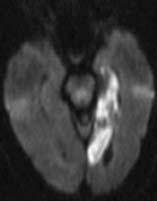
FIGURE 9-29. Axial DWI, in a different patient, shows bright signal in the left PCA infarction (note nvolvement of all mesial temporal lobe).
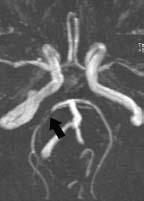
FIGURE 9-30. Base MRA view, in a different patient with right PCA infarction, shows stenosis (arrow) of the proximal ipsilateral artery.
SUGGESTED READING
Naidich TP, Firestone MI, Blum JT, Abrams KJ, Zimmerman RD. Zonal frequency analysis of infarct extent. Part II: anterior and posterior cerebral artery infarctions. Neuroradiology 2003;45:601-610,

KEY FACTS
 Probably the most common type of cerebral infarction, but many are clinically silent
 Associated with increasing age and hypertension, generally due to primary vessel disease (hyalinization) leading to thrombosis and not to emboli.
 Commonly affect small perforating and deep arteries (lenticulostriate and thalamoperforators); thus, basal ganglia, internal capsule, and thalamus are typically involved.
 Brain stem is also a common location, due to occlusion of perforators arising from circumflex branches of the basilar artery
 Not hemorrhagic, generally about 1 cm in diameter.
 Best imaging technique: DWI (bright acutely); by CT, it is generally not possible to age them.
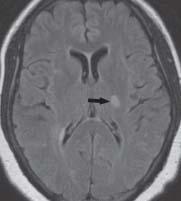
FIGURE 9-31. Axial FLAIR image shows lacunar infarction (arrow) in the left thalamus.
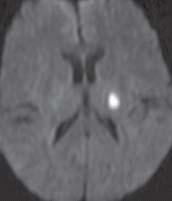
FIGURE 9-32. Corresponding DWI confirms the presence of the infarction.
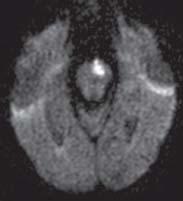
FIGURE 9-33. Axial DWI, in a different patient, shows a bright acute infarction in the left paramedian pons.
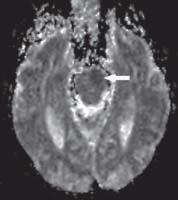
FIGURE 9-34. Corresponding ADC map confirms restricted diffusion (arrow) in the infarction.
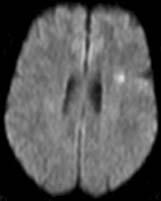
FIGURE 9-35. Axial DWI, in a different patient shows the left frontal acute lacunar infarction.
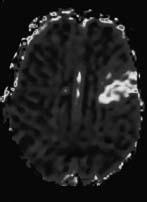
FIGURE 9-36. Corresponding MTT perfusion map shows a larger defect corresponding to penumbra in the left frontal lobe. (See color insert)
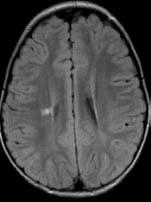
FIGURE 9-37 Axial FLAIR in a child with congenital hemiplegia shows a bright right-sided periven-tricular infarction with some loss of volume of the psilateral hemisphere
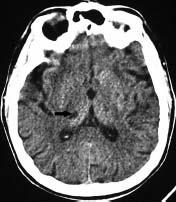
FIGURE 9-38. Axial CT, in a different patient, shows an infarct of indeterminate age in the right thalamus (arrow). By CT, aging of lacunar infarctions is very difficult
SUGGESTED READING
Gass A, Ay H, Szabo K, Koroshetz WJ. Diffusion-weighted MRI for the “small stuff”: the details of acute cerebral ischaemia. Lancet Neurol 2004;3:39-45.
 WATERSHED CEREBRAL INFARCTIONS
KEY FACTS
 Also called “border zone” or “hypotensive” infarctions.
 Most cause by hypotension, but paradoxically, some may be embolie in nature; may also be the result in ICA occlusion.
 Sites: between ACA and MCA territories, between PCA and MCA territories, parasagittal white matter, deep cerebellum, and corpus callosum.
 May result in laminar necrosis.
 Best imaging technique: DWI.
 Perfusion studies show <rCBF, <rCBY >MTT, and >TTP in the affected areas or throughout the affected hemisphere.
 Remember that fat emboli look exactly like deep white matter watershed infarctions.
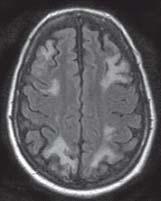
FIGURE 9-39. Axial FLAIR image shows high-signal infarctions bilaterally in between the territories of the ACAs and MCAs as well as the MCAs and PCAs.
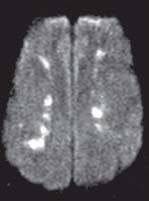
FIGURE 9-40. In a different patient, DWI shows bright infarctions in deep parasagittal watershed regions bilaterally.
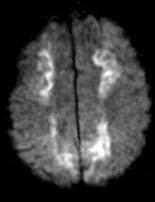
FIGURE 9-41. Axial DWI, in a different patient, shows deep infarcts in periventricular regions extending anteriorly and posteriorly to periphera watershed regions.
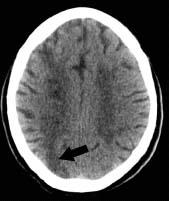
FIGURE 9-42. Axial CT, in a different patient, shows a right posterior watershed infarct (arrow)
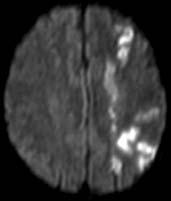
FIGURE 9-43. Axial DWI, in a different patient, showing left-sided watershed infarctions.
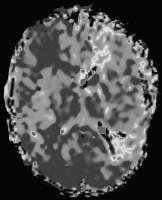
FIGURE 9-44. Corresponding MR perfusion MTT map, in the same patient shows a large penumbra with increased transit time. (See color insert)
SUGGESTED READING
Derdeyn CP, Khosla A, Videen TO, Fritsch SM, Carpenter DL, Grubb RLJr, et al. Severe hemodynamic impairment and border zone-region infarction. Radiology 2001;220:195-201.
 HEMORRHAGIC INFARCT AND HEMORRHAGIC TRANSFORMATION
KEY FACTS
 A hemorrhagic infarction is considered as such if blood is identified within 24 hours of the ictus; hemorrhagic transformation of an infarction occurs when blood is identified 2 to 14 days after the ictus.
Related posts:
Stay updated, free articles. Join our Telegram channel

Full access? Get Clinical Tree


