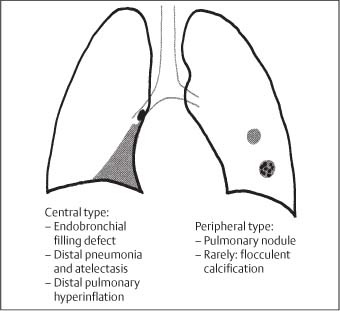
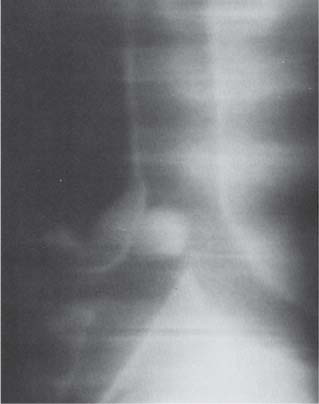
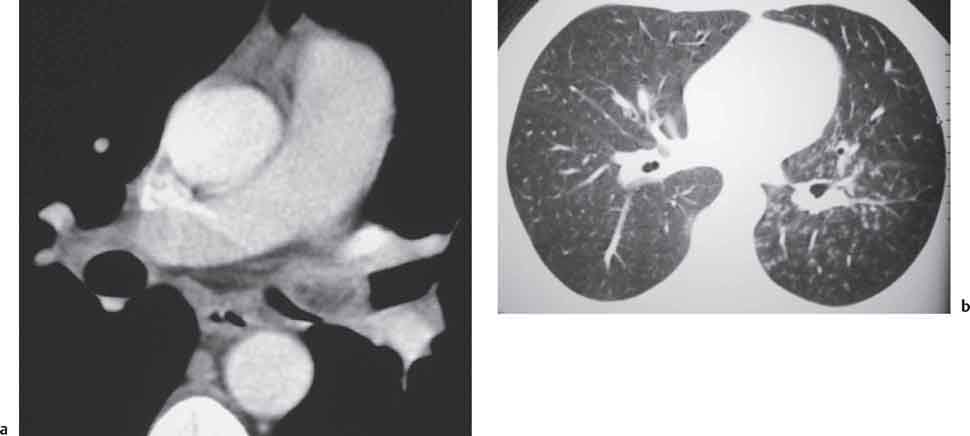
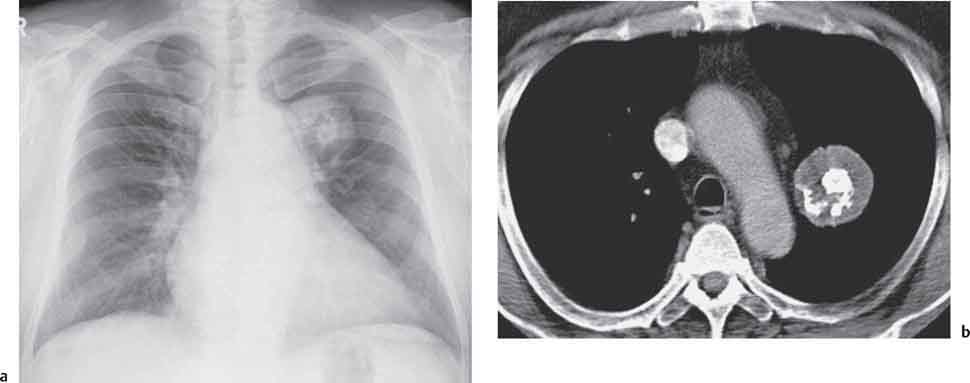
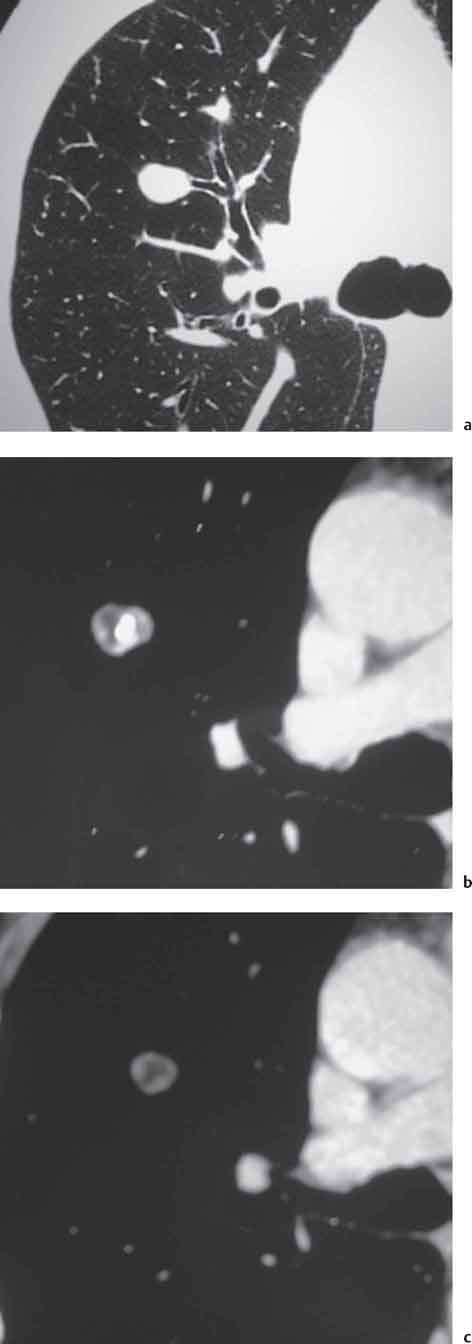
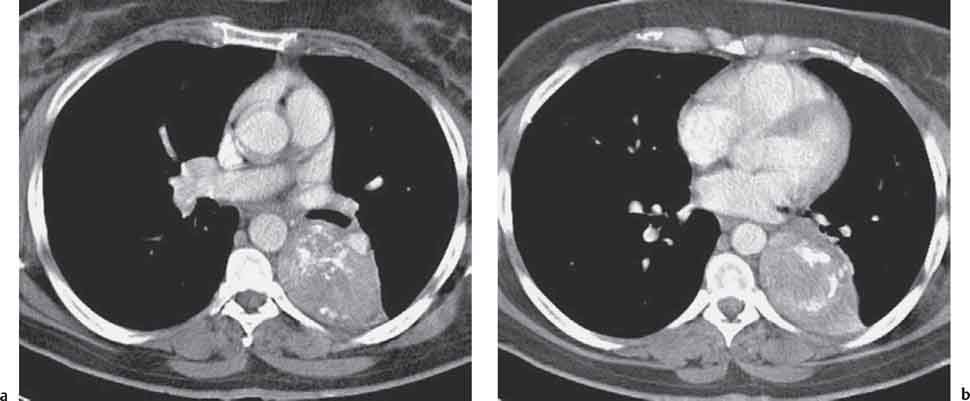
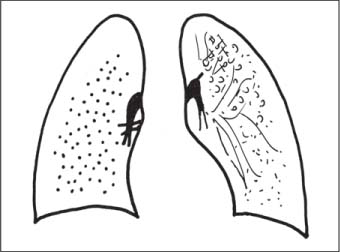
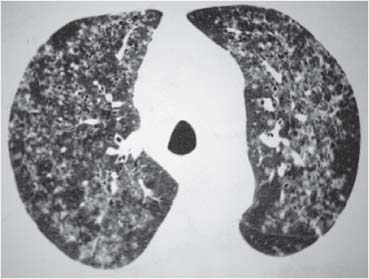
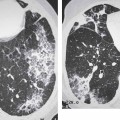
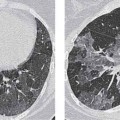
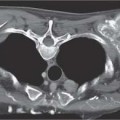
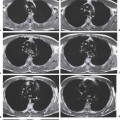
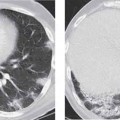
6 Tumors and Tumor-Like Lesions of the Lung A solitary pulmonary nodule is defined as a round or oval opacity less than 3 cm in diameter which is surrounded completely by pulmonary parenchyma and is not associated with lymph node enlargement, atelectasis, or pneumonia (Midthun et al. 1993). Cytologic and/or histological evaluation is usually required to differentiate benign from malignant lesions. However, the following may also be helpful in evaluation of SPNs: In the past decade, detection of small pulmonary nodules has become routine on thin collimation helical volumetric CT. Data from multi-detector CT (MDCT) studies at 5 mm collimation indicate that approximately 50% of smokers over 50 years of age will have at least one visible nodule and another 10% will develop a new nodule over a 12-month period (Swenson et al. 2002). The clinical importance of these nodules appears to be very different from those detected on chest radiographs and the vast majority are benign (MacMahon et al. 2005). Studies suggest that less than 1% of nodules which are less than 5 mm in diameter found in patients without a history of neoplasia will demonstrate malignant behavior (Henschke et al. 2004, Swenson et al. 2003, Henschke et al. 1999). Therefore, regular CT follow-up of these lesions may reflect poor use of resources, unnecessary patient anxiety, and impose a significant radiation dose particularly in young patients. On evaluation of Early Lung Cancer Action Project (ELCAP) data, Henschke et al. found no lung cancers in patients in whom the largest noncalcified nodule was less than 5 mm in diameter on initial CT. Therefore, there appears to be little point in short-term interval follow-up for nodules less than 5 mm even in high risk patients. Bearing in mind these considerations, the Fleischner Society has recently issued the following recommendations for nodules detected incidentally at nonscreening CT in persons aged 35 years or older (MacMahon et al. 2005): Longer follow-up intervals may be appropriate for non-solid and partly solid lesions given their slower growth rates and longer tumor doubling times. Benign tumors account for just 2% of pulmonary neoplasms. They may grow slowly or remain unchanged for several years (Table 6.1). Clinical manifestations and radiographic findings are determined by their location (Fig. 6.1). Table 6.1 WHO Classification of lung tumors (modified from Scholman et al. 1991) Hamartomata account for 55% of benign and approximately 8% of all pulmonary neoplasms. These tumors contain cartilage, connective tissue, fat, and muscle. Approximately 80% are peripheral pulmonary nodules while the remainder are central endobronchial lesions. Endobronchial lesions typically contain more fat than peripheral lesions (Gaerte et al. 2002) but frequently are inflamed and may be indistinguishable from bronchial carcinoma at bronchoscopy (Ahn et al. 1994, Fig. 6.3a, b). Fig. 6.1 Benign tumors. Fig. 6.2 Fibroma appears as a round filling defect within the tracheobronchial air column. The chest radiograph typically shows a well-circumscribed, homogeneous nodule which usually is less than 4 cm in diameter. Flocculent or popcorn calcification is visible in up to 15 % of cases (Figs. 6.4, 6.5). The presence of intralesional fat is also considered diagnostic. Fig. 6.3a, b Endobronchial hamartoma. CT shows low density lesion possibly containing some foci of fat density with the left main bronchus (a). There are features of a cellular bronchiolitis within the left lower lobe distal to this lesion (b). Histology of resected specimen was consistent with a hamartoma. Fig. 6.4a, b Pulmonary hamartoma appears as a well-defined round lesion and contains foci of calcification. Because of the superior contrast resolution of CT, fat and calcium within hamartomata are identified more easily. The prevalence of fat at CT has been reported to be from 5 to 50% (Erasmus et al. 2000). Fat is found in up to 50% of lesions and may be localized or generalized within the lesion (Siegelman et al. 1986, Erasmus et al. 2000, Fig. 6.6a–c). The term “bronchial adenoma” in the past has been used to describe a group of lesions that included carcinoid tumor, mucoepidermoid carcinoma, and adenoid cystic carcinoma. The 1977 histologic classification considers carcinoid to be a separate entity while cylindroma or adenoid cystic carcinoma is classified with carcinoma of the tracheal wall glands (Tables 6.1, 6.2). Bronchial carcinoid encompasses a spectrum of histology ranging from slow growing, locally infiltrative tumors to metastasizing lesions. Carcinoids may be typical (Kulchitsky cell carcinoma [KCC] type 1) or atypical (KCC type 2); the latter has cellular and clinical features intermediate between those of typical carcinoid and small cell carcinoma (KCC type 3). Approximately 15 % of typical and 50% of atypical carcinoids ultimately will metastasize (Armstrong et al. 1995). Fig. 6.5 Pulmonary chondroma appears as a well-defined nodule with flocculent calcification. Fig. 6.6a–c Peripheral lung hamartoma. CT shows right upper lobe lesion with smooth contour (a), central nidus of calcification and surrounding rim of fat attenuation(b and c) Fig. 6.7a, b Carcinoid tumor left lower lobe – CT images show left lower lobe lesion which contains multiple foci of calcification. There is distal left lower lobe atelectasis. Histology of resected specimen was consistent with a typical carcinoid. Lesions distal to the level of the segmental bronchi are defined as peripheral carcinoids. Typical carcinoids characteristically are centrally located vascular tumors and may present with hemoptysis. Conversely, atypical carcinoids tend to have a peripheral location and presentation with hemoptysis is unusual. Most bronchial carcinoids are found within the major bronchi. The chest radiograph may be normal in 10% of cases and then the diagnosis is established at bronchoscopy or following surgical resection of tumors initially detected at CT (Armstrong et al. 1995). In those cases with an abnormal chest radiograph, the tumor may be visible as a well-defined hilar or perihilar mass. Partial or complete bronchial obstruction leads to distal atelectasis or pneumonic consolidation. Occasionally, collateral air drift maintains distal aeration even in the presence of total airway obstruction. Tumors in segmental bronchi may cause obstruction with mucus retention in the distal airway; branching bronchoceles then may be the dominant radiographic finding. Ten to twenty percent of carcinoids present as peripheral pulmonary nodules or masses. CT characteristically shows a spherical or ovoid nodule with a well-defined lobulated contour. Calcification is not often visible on the plain radiograph but is seen on CT in up to 30% of lesions. It is seen more commonly in central than in peripheral lesions and may be diffuse or punctate in type (Chong et al. 2006, Fig. 6.7a, b). Langerhans cell histiocytosis comprises three disorders that show histologic similarities. These are: Isolated pulmonary involvement was first reported in 1951. Pulmonary Langerhans cell histiocytosis (PLCH) is today seen predominantly in young adults and has a smoking prevalence of 80–100%. A much less common association with neoplasia including bronchial carcinoma and Hodgkin’s lymphoma has been described. The etiology of this condition remains poorly understood but it has been suggested that it may reflect an uncontrolled immune response to an unknown exogenous antigen in which Langerhans cells may serve as accessory cells in the activation of T lymphocytes. Pathologically, multifocal peribronchiolar collections of Langerhans cells together with macrophages, lymphocytes, plasma cells, and eosinophils are seen. These cellular infiltrates are then replaced in a centripetal fashion by a fibroblastic proliferation which results in the classic stellate lesions. Over time, the cellular infiltrate disappears leaving behind fibrotic scars that are surrounded by enlarged and distorted air spaces. Temporal heterogeneity is commonly seen both within the pathologic specimen and within individual lesions (Abbott et al. 2004). Patients may present clinically with a nonproductive cough and dyspnea. Less commonly, presentation may be with systemic symptoms of malaise and weight loss. Up to 25 % of cases of PLCH may be asymptomatic and in these cases, the diagnosis may be due to incidentally discovered radiologic abnormalities. Radiographs during the early granulomatous stage may show multiple small nodules (1–10 mm in diameter). These are bilateral and symmetrical in distribution and show a predilection for the upper to mid zones (Figs. 6.8, 6.9). They give way to a coarse reticular pattern, honeycomb shadowing, and cystic change as the disease progresses. The presence of extensive cystic change may mimic bullous emphysema on the chest radiograph (Fig. 6.10a). High-resolution CT (HRCT) in early-stage disease shows peribronchial or peribronchiolar nodularity with an upper to midzone predominance and with relative sparing of the lung bases. A combination of nodules and cystic lesions has been described as the commonest pattern (Brauner et al. 1989, Fig. 6.11) and the probable progression of change on CT has been postulated to be from nodules through to cavitary nodules, thick-walled cysts, then thin-walled cysts, and finally confluent cysts. Given this progression of change, it has been suggested that HRCT may be useful in evaluating the histopathologic activity of PLCH (Soler et al. 2000). Cystic lesions are frequently round or ovoid in shape but may exhibit rather bizarre configurations with bilobed, branching, and cloverleaf shapes (Fig. 6.10b–d). Fig. 6.8 Langerhans cell histiocytosis presents initially with interstitial nodularity and may progress to cystic change and fibrosis. Fig. 6.9 Langerhans cell histiocytosis—early-stage disease with extensive pulmonary nodularity. Fig. 6.10a–d Advanced stage Langerhans cell histiocytosis. There is extensive pulmonary “cyst” formation with fibrosis most advanced in the upper zones with moderate midzone change and with relative sparing of the lung bases. The differential diagnosis is from lymphangiomyomatosis but this affects females and shows diffuse pulmonary involvement. Cystic change in pneumocystis pneumonia (see p. 87) may occasionally be indistinguishable from cystic change in PLCH (Webb et al. 2001). Fig. 6.11 Pulmonary Langerhans cell histiocytosis. Histologically proven pulmonary Langerhans cell histiocytosis with areas of poorly defined nodular opacification and early cyst formation. Bronchial carcinoma arises from the bronchial epithelium, grows by local expansion, and infiltrates local lymphatic channels and vessels to give rise to local and regional lymph node and distant metastases, respectively. Its incidence in industrialized countries has increased 10-fold since 1930 (Müller 1983) and in Germany bronchial carcinoma is now second only to gastrointestinal malignancy as the most common organ tumor. Since the mid 1980s, the incidence appears to have plateaued in males but continues to rise in females. In the U.S. in 1988, the incidence of bronchial carcinoma surpassed that of breast carcinoma for the first time (Bragg 1994). It is estimated that approximately 85% of lung cancer may be attributable to cigarette smoking. The “rule of 20” states that in individuals who smoke 20 cigarettes per day for 20 years, the risk of bronchogenic carcinoma is increased 20-fold (Wynder et al. 1977). Bronchial carcinoma is a particularly aggressive neoplasm with ahigh mortality. The reported 5-year survival rate in Germany in 1976 was only 2% (Heilmann and Doppelfeld 1976), and it remains a major cause of cancer deaths (27%) in both men and women over the age of 35 in the industrialized world. Current overall survival remains poor with a 10-year survival of just 7% in the U.S. National Cancer Database report (Fry et al. 1999). The early diagnosis and treatment of resectable nonsmall cell tumors offers some chance of cure with 5-year survival rates of 62–82% (Fry et al. 1999, Mountain 1997). Large prospective studies on radiographic screening have been conducted in the U.S. (Fontana 1977). The Mayo Foundation reported very favorable results in 10 000 subjects: In the screened group who underwent sputum analysis and chest radiography at 4-month intervals, 62% of detected carcinomas were still operable and the calculated 5-year survival rate was 45%. This compares with resectable tumors in 28% of the control group and a 5-year survival rate of just 19%. This study found chest radiographs were rewarding much more frequently than sputum cytology. Most other trial screening programs using chest radiographs and sputum cytology have failed to demonstrate improved survival in the screened group and they have emphasized the difficulties in detection of early lung cancer on plain radiographs (Bragg 1994). A number of studies on CT screening for lung cancer have reported in the past decade: Henschke and colleagues reported the results of the Early Lung Cancer Action Project in 1999 (Henschke et al. 1999). This two-center study enrolled 1000 patients more than 60 years of age with a smoking history of greater than 10 pack-years. Initial screening CT was performed at 10 mm collimation. The initial prevalence screen showed 1–6 noncalcified nodules in 233 (23%) of participants. In 27 (2.7 %) of all participants, lung cancer was detected (cancer prevalence rate of 2.7%) and 23 (84%) of these neoplasms represented stage 1 disease. The initial incidence screen showed 26 new nodules, 10 of which were malignant and nine of which were primary bronchial carcinoma giving a cancer incidence rate of 0.9 %.
The Solitary Pulmonary Nodule (SPN)
Lesion Size and Morphology
“Functional” Assessment
Evaluation of CT-Detected Small Pulmonary Nodules
Benign Tumors of the Lung
Benign
Malignant
I. Epithelial tumors
II. Non-epithelial (soft-tissue) tumors
III. Mesothelial tumors
(Benign) mesothelioma
Malignant mesothelioma
IV. Miscellaneous tumors
V. Metastases
VI. Unclassified tumors
VII. Tumor-like lesions
Pulmonary Hamartoma
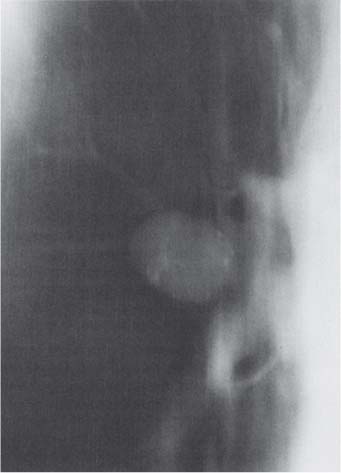
Radiologic Findings
Computed Tomography
Carcinoid, Mucoepidermoid, and Adenoid Cystic Carcinoma
TX
Positive cytology
T1
≤ 3 cm in greatest dimension
T2
> 3 cm in greatest dimension, or extension to the hilar region, or invasion of visceral pleura, or a tumor that has caused partial atelectasis
T3
Extension to the chest wall, diaphragm, mediastinal pleura, or pericardium, etc., or a tumor that has caused complete atelectasis
T4
Invasion of the mediastinum, heart, great vessels, trachea, esophagus, etc., or the presence of malignant pleural effusion
N1
Metastasis to peribronchial or ipsilateral hilar lymph nodes
N2
Metastasis to ipsilateral mediastinal lymph nodes
N3
Metastasis to contralateral mediastinal lymph nodes, scalene lymph nodes, or supraclavicular lymph nodes
Radiologic Findings
Langerhans Cell Histiocytosis (LCH)
Radiologic Findings
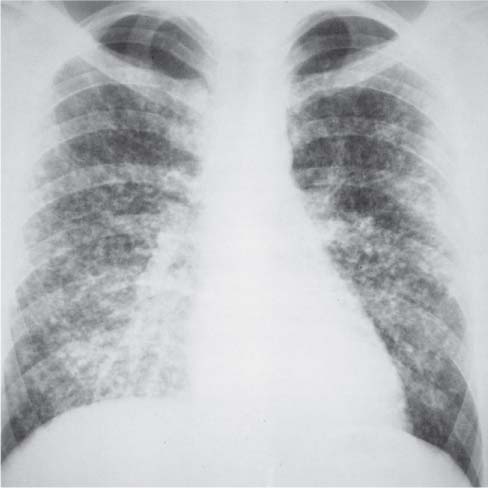
Chest Radiograph
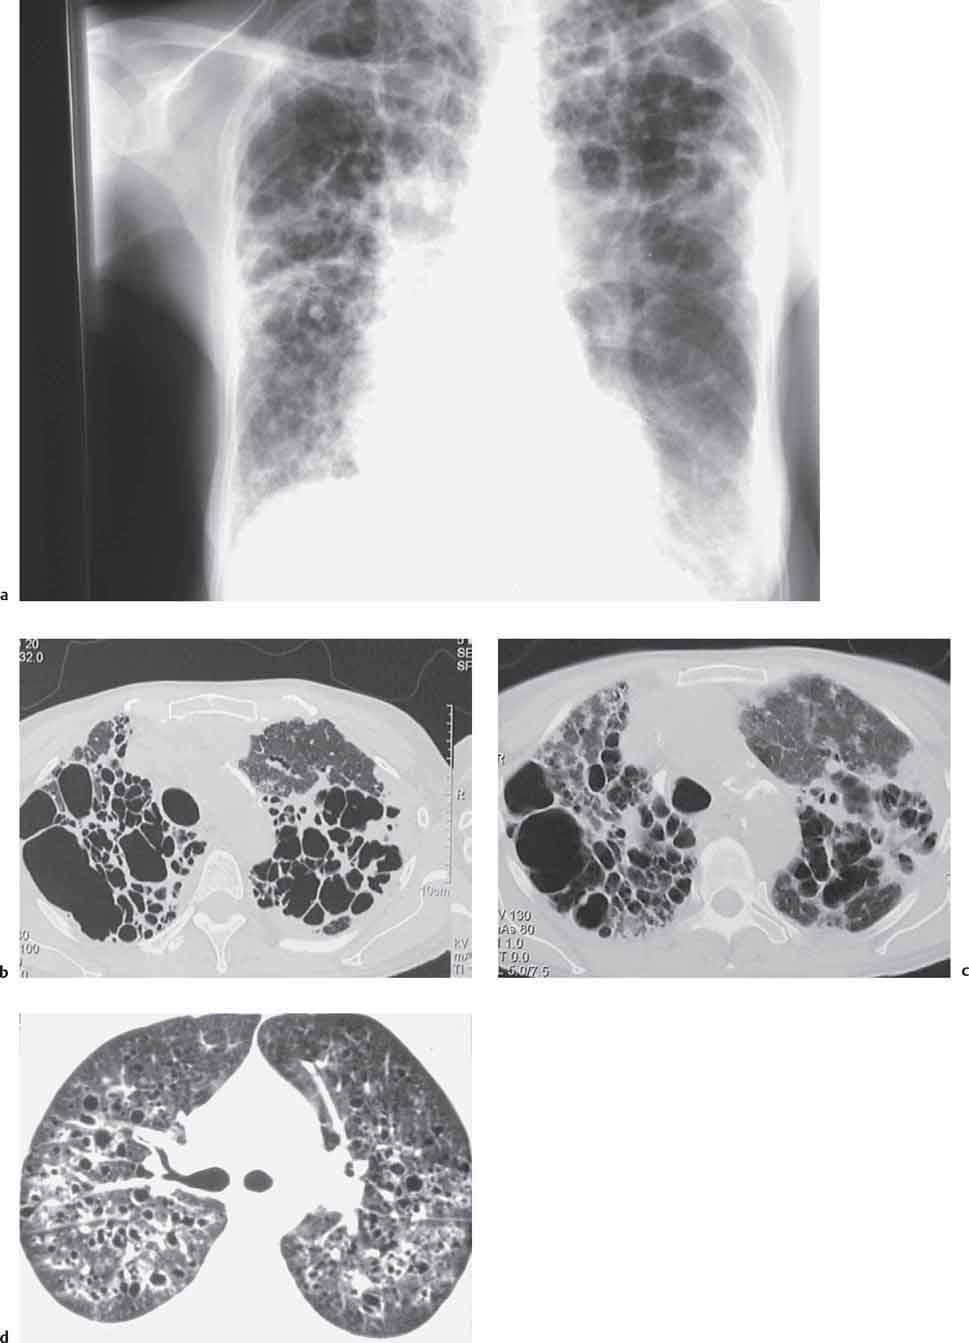
Computed Tomography
Bronchial Carcinoma
Screening for Lung Cancer
Related posts:
Stay updated, free articles. Join our Telegram channel

Full access? Get Clinical Tree


