Fig. 1.1
Bone marrow vasculature: schematic representation.
Note the anastomoses between radial branches of the nutrient artery and branches derived from periosteal arteries. Also note the sinusoids formed from the above branches. Hematopoiesis occurs in the intersinusoidal tissue spaces (Reprinted with permission from Travlos [10])
Differences between red and yellow marrow extend to their vascularization. This has very important implications regarding localization of bone marrow diseases, both malignant and nonmalignant. Red marrow has a rich vascular supply with a dense sinusoidal network, whereas yellow marrow vascularization is markedly decreased. During the physiologic conversion of red to yellow marrow, significant changes occur regarding the marrow vasculature. The nutrient artery decreases in size, and the dense network of sinusoids is gradually replaced by sparsely arranged capillaries, venules, and veins [11]. The accumulating adipocytes of yellow marrow are derived from the adventitial reticular cells that form the outer lining of the sinusoidal wall. The large adipocytes that replace the reticular cells compress the sinus wall, causing collapse of the sinusoid. Thus, sinusoids running among fat cells in yellow marrow are excluded from blood flow [5]. Conversely, when reconversion of yellow to red marrow occurs, the nutrient artery enlarges and space between sinusoids is reformed through lipolysis. Thus, pressure upon the sinus wall is lifted, previously collapsed sinusoids dilate, and blood flow resumes through their lumen [5, 11].
Key Points
Red to yellow marrow conversion is associated with a decrease in intramedullary blood flow
Reconversion of yellow to red marrow is associated with an increase in intramedullary blood flow
1.1.3 Cellular Organization
Bone marrow has traditionally been considered to consist of two distinct lineages: the hematopoietic tissue proper and the supporting marrow stroma [12, 13]. Hematopoietic cells and stromal cells are organized in solid cords, separated by sinusoids [14]. The barrier between the sinusoids and the cords is the trilaminar sinus wall which consists of a luminal layer of endothelial cells, a thin basement membrane, and an incomplete outer lining of adventitial reticular cells covering approximately 60 % of the sinusoidal abluminal surface [5]. Bone marrow stromal cells include macrophages, lymphocytes, endothelial cells, and reticular cells [14]. Endothelial cells completely line the luminal surface of the sinusoids. They display overlapping or interdigitating unions which allow changes in the luminal size of the sinus [15]. Adventitial reticular cells are the direct progenitors of bone marrow adipocytes. Long, thin processes project from their cell body into the adjacent tissue, providing a scaffold for stromal and hematopoietic cells [14]. Bone marrow adipocytes develop by lipogenesis from the adventitial reticular cells. Any reduction of hematopoietic cell mass, either age related or not, is followed by rapid accumulation of lipid within reticular cells, which then convert into adipocytes [5]. The hematopoietic cells are not randomly arranged but demonstrate a particular organization within bone marrow tissue [16]. The erythroblastic islands are mainly located close to the sinusoidal wall, as are megakaryocytes. Granulocyte precursors are positioned deeper, in the subcortical regions of the cords [14]. Following maturation, the hematopoietic cells traverse the wall of the sinusoids and enter the blood circulation (Fig. 1.2).
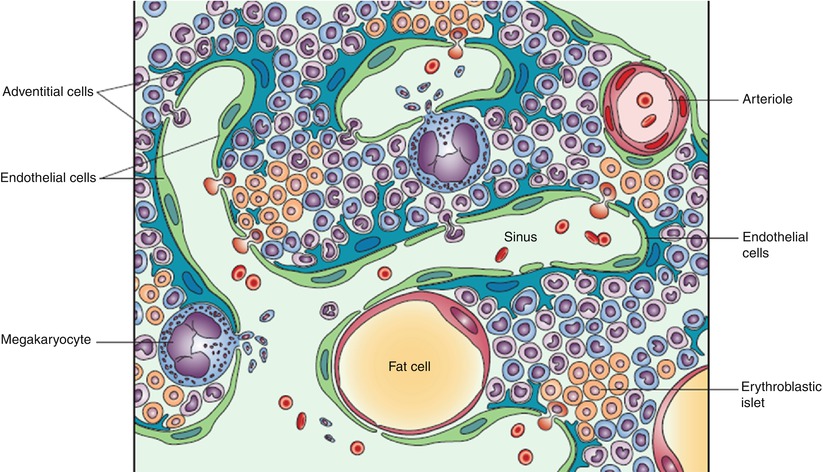
Fig. 1.2
Bone marrow structure: schematic representation.
Note the structured organization of hematopoietic cells, the sinusoidal wall consisting of endothelial and adventitial cells, and the sinusoidal lumen where mature hematopoietic cells are released to enter the blood circulation (Reprinted with permission from Valdez et al. [14])
1.2 Normal Bone Marrow: Function
The role of the bone marrow in blood cell production was not recognized until the second half of the nineteenth century. In 1868, Ernst Neumann and Giulio Bizzozero independently published reports that eventually led to the recognition of bone marrow as the site of definite hematopoiesis [17, 18]. Neumann, in a preliminary report published in October of that year, described the presence of nucleated red blood cells in the bone marrow sap of humans and rabbits by squeezing bone. Two communications by Bizzozero with similar observations soon followed. In subsequent papers, Neumann, a pathologist with a persistent interest in bone marrow research, postulated a common stem cell origin for all hematopoietic cells [19]. Moreover, he discriminated between hematopoietically active red marrow and inactive yellow marrow and, in 1882, was the first to describe the process by which red marrow progressively converts to yellow marrow from the peripheral towards the axial skeleton (which is why red to yellow marrow conversion is sometimes referred to as “Neumann’s law”) [20].
Hematopoiesis occurs in several waves during embryonic and fetal development and arises from multiple shifting anatomical sites, bone marrow being the last of them [21]. Hematopoiesis begins in the blood islands of the extraembryonic yolk sac at the end of gastrulation. This so-called “primitive” hematopoiesis is largely erythropoietic, although macrophages and megakaryocytes are also produced [22]. A second hematopoietic wave also arises in the yolk sac and consists of “definitive” erythroid progenitors that enter the bloodstream and seed the fetal liver. The third wave of hematopoiesis arises from hematopoietic stem cells (HSCs) produced within a number of intraembryonic sites, including the aorta-gonad-mesonephros (AGM) region. The HSCs that form in these tissues consecutively seed the fetal liver, spleen, and bone marrow, producing all hematopoietic lineages [21]. The fetal liver is the main site of hematopoiesis during mid-gestation. Hematopoiesis in fetal long bones begins by gestational week 10–11 (before initiation of hematopoiesis in the vertebrae) and remains confined to the diaphyseal region until week 15 [23]. From week 16 onward, hematopoietic cells are also found at the diametaphyseal junction and in the metaphysis itself [24]. The bone marrow takes over from the liver as the major site of hematopoiesis after the 24th week of gestation.
1.3 Age-Related Changes in Bone Marrow Composition: Red to Yellow Marrow Conversion
Fetal bone marrow is entirely red. At birth, possibly triggered by changes in temperature, vascular supply, and oxygen tension, the process of red to yellow marrow conversion starts. This process continues through life and follows a predictable pattern which was first described by Ernst Neumann in 1882 and has since been extensively studied and mapped [1, 11, 20, 25, 26].
Red to yellow marrow conversion follows an orderly pattern from the peripheral towards the central skeleton [1]. It begins in the terminal phalanges of the feet and probably the hands at birth, when all marrow is hematopoietic [27]. Although the causes and mechanisms of this centripetal regression of active hematopoietic tissue have been the subject of investigation for many years, they are still not completely understood. The predilection of red marrow for the central skeleton was initially explained by the higher tissue temperature and increased vascularity of the central skeleton compared to the distal extremities. These observations date back to the 1930s [28, 29]. Today, these hypotheses have been questioned, and there is a continuous search for other triggering factors for the red to yellow marrow conversion process (cytokines, hormones) [15, 30, 31].
It has also been suggested that the far larger number of mesenchymal stem cells (MSCs) lining the trabeculae of the cancellous bones of the central skeleton (extensively developed trabecular system, thin cortex) compared with the tubular bones of the extremities (few trabeculae, thick cortex) may also play a role in the red to yellow marrow conversion process. MSCs are precursors of both bone-forming cells and hematopoietic microenvironment cells. According to this hypothesis, the MSC population in tubular bones becomes exhausted rather early, whereas in centrally located cancellous bones, the relatively large number of MSCs continues to provide newly differentiated hematopoietic microenvironment, thus maintaining red bone marrow throughout life [32].
Within each individual bone, red to yellow marrow conversion follows an orderly, well-defined sequence: yellow marrow first appears in the epiphyses, then in the diaphysis, and lastly in the metaphyses, distal followed by proximal. The pattern of marrow conversion is similar in distal and proximal long bones, except that the rate of conversion is more rapid in the distal long bones [11].
Key Points
Red to yellow marrow conversion patterns
Skeleton: peripheral → central
Long bones: epiphysis → diaphysis → distal metaphysis → proximal metaphysis
The cartilaginous epiphysis lacks marrow until it begins to ossify by means of endochondral ossification. The newly formed secondary ossification center initially contains red marrow but within months undergoes transformation to yellow marrow [33]. Adipose conversion thereafter proceeds to the diaphysis, distal metaphysis, and proximal metaphysis. The proximal metaphyses of the humeri and femora are, therefore, the last parts of the appendicular skeleton to undergo fatty transformation. Although variations exist, by the age of 25 years, the adult pattern of red/yellow marrow distribution has been reached. At that time hematopoietically active red marrow is found in the spine, ribs, sternum, pelvis, skull, and to a lesser degree, in the proximal metaphyseal regions of the femora and humeri [1, 25].
Key Points
The adult pattern of red/yellow marrow distribution
Red marrow is restricted to the axial skeleton (spine, sternum, ribs, pelvis, skull) and to the proximal metaphyses of the femora and humeri
The pattern is reached around the age of 25 years
It must be noted that, in the axial skeleton, yellow marrow conversion does not stop after the adult pattern of bone marrow distribution is reached. With aging there is a slow and steady increase of marrow fat content in the spine. Data obtained from histologic studies have shown a decrease of red marrow volume in vertebral bodies from a mean of 58 % in the first decade of life to 29 % by the eighth decade, with a concomitant increase in the percentage of adipose cells [34]. More recently, MR spectroscopy has been used as a reliable noninvasive tool for quantification of marrow fat content in different age groups [35, 36]. Results have shown that the relative proportion of fat in the vertebral bone marrow increases with age from 24 % in the age group of 11–20 years to 54 % in the group of >61 years [35]. Moreover, it has been shown that, although males show a gradual, steady rise in marrow fat content throughout life, in females there is a sharp increase in vertebral marrow fat content between 55 and 65 years of age, following menopause [37]. As a result of this, from 65 to at least 85 years, marrow fat content is higher in females than males, which is a reversal of the pattern seen in subjects younger than 60 years when males tend to have more marrow fat.
Related posts:

Stay updated, free articles. Join our Telegram channel

Full access? Get Clinical Tree


