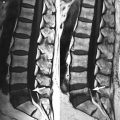
Fig. 2.1
Yellow marrow, high T1 signal intensity.
Sagittal T1-weighted image of the lumbosacral spine of a 65-year-old woman shows high-signal-intensity vertebrae due to predominance of yellow marrow
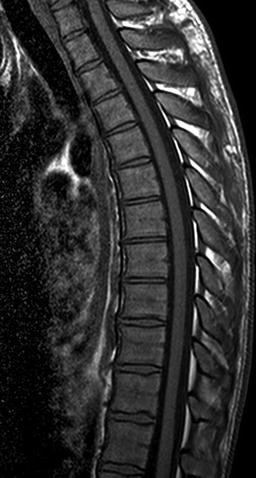
Fig. 2.2
Red marrow, low T1 signal intensity.
Sagittal T1-weighted image of the thoracic spine of a 25-year-old man shows low-signal-intensity vertebrae due to predominance of red marrow
Diseased bone marrow typically has lower signal intensity than fatty marrow on T1-weighted images because it is more cellular and contains greater amounts of water and lesser amounts of fat (Fig. 2.3). An abnormal process may, therefore, have comparable signal intensity to red marrow on T1-weighted images making difficult the distinction between pathology and normal hematopoietic marrow (Fig. 2.4). Several attempts have been made to differentiate bone marrow involvement from normal red marrow by comparing marrow signal intensity to various structures in the body. A hypointense to intervertebral disc bone marrow (hyperintense disc sign) was one of the first signs that was described as suggestive of diseased bone marrow [2] (Fig. 2.5). Both nondegenerated intervertebral discs and muscles have since then been employed as potential internal standards for the assessment of bone marrow status (Fig. 2.6). Carroll et al. concluded that bone marrow signal intensity equal to or lower than that of disc or muscle on T1-weighted images at 1.5 T is abnormal with a 98 % (disc) and 94 % (muscle) accuracy [3]. Corresponding accuracy values at 3 T were higher when bone marrow was compared to muscle (89 %) than when it was compared to disc (78 %) [4]. It should be noted, though, that in the first year of life, normal red marrow may be hypointense to disc due to its hypercellularity (Fig. 2.7). After age 5, in approximately 90 % of children, bone marrow signal intensity is higher than that of disc [5].
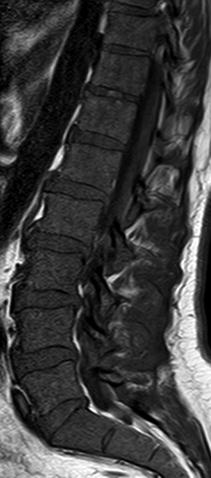
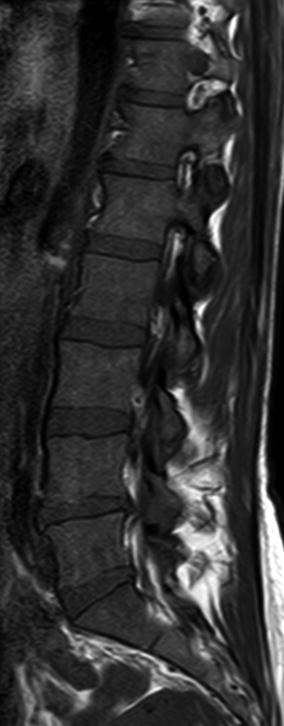
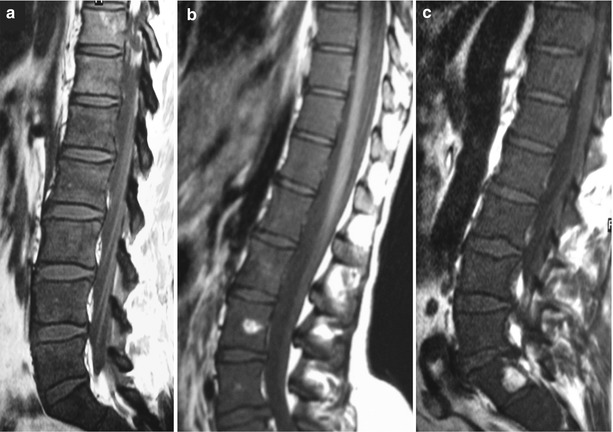
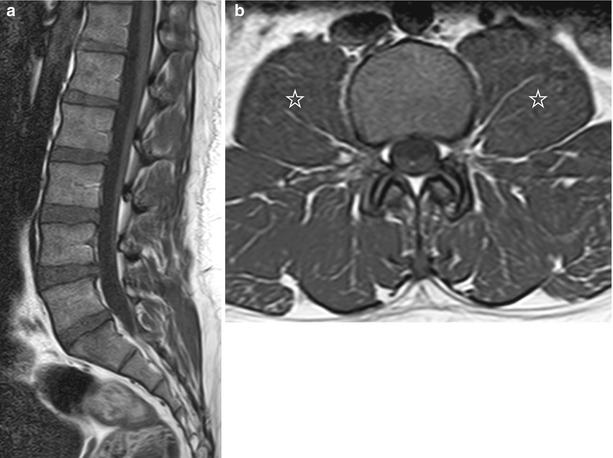
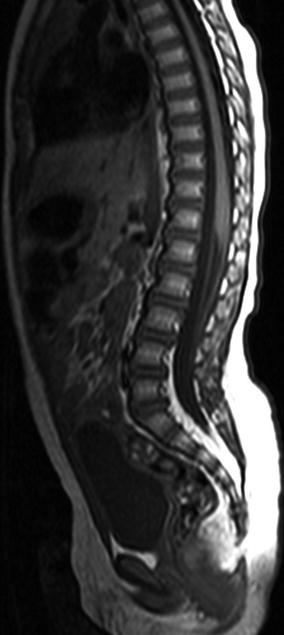
Fig. 2.3
Low T1 signal intensity, malignant bone marrow.
Sagittal T1-weighted image of the lumbosacral spine of a 59-year-old man with multiple myeloma and 67 % bone marrow plasmacytosis shows low-signal-intensity marrow due to diffuse malignant infiltration
Fig. 2.4
Low T1 signal intensity, normal red marrow.
Sagittal T1-weighted image of the lumbosacral spine of a 35-year-old woman shows low-signal-intensity vertebrae due to age-related predominance of red marrow
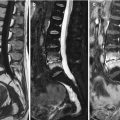
Fig. 2.5
Hyperintense disc sign.
Sagittal T1-weighted images of the spine in three different patients with bone marrow metastases from breast cancer (a), neuroblastoma (b), and small cell lung cancer (c) show diffuse, low-signal-intensity bone marrow. In all three cases, the intervertebral discs are hyperintense to the abnormal marrow
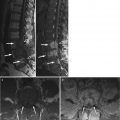
Fig. 2.6
Normal bone marrow, internal standards.
(a) Sagittal T1-weighted image of the lumbosacral spine of a 25-year-old man with predominantly red marrow: although spinal marrow has relatively low signal intensity, it is still hyperintense to the intervertebral discs. (b) Axial T1-weighted image of the same individual at the level of L3 shows that normal marrow is also hyperintense to adjacent psoas muscles (asterisks)
Fig. 2.7
Normal bone marrow, child.
Sagittal T1-weighted image of the lumbosacral spine of a 2-year-old boy shows that spinal marrow is hyperintense to the intervertebral discs (Image courtesy of Ioannis Nikas, M.D., Children’s Hospital “Aghia Sophia”, Athens, Greece)
Key Points
Red marrow signal intensity lower than that of nondegenerated disc or muscle on T1-weighted images is abnormal
Exception: infants
2.2 T2-Weighted Imaging
Fat protons have a long T2 relaxation time, less however than that of water protons. Therefore, on T2-weighted spin-echo (SE) images, the signal intensity of fat is lower than that of rich in water proton structures, i.e., nondegenerated disc, muscle, and most disease entities affecting the bone marrow [6]. Fatty marrow signal intensity is similar to or slightly lower than that of subcutaneous fat. Red marrow has an intermediate signal intensity on T2-weighted SE images, which is lower than that of most abnormal bone marrow processes. Differentiation of red and yellow marrow is not as easy as on T1-weighted images.
On fast spin-echo (FSE) sequences, the signal intensity of fat remains relatively high unless fat suppression techniques are employed, rendering these sequences not useful for the study of bone marrow as both normal fat-containing marrow and water-rich lesions will manifest with increased signal intensity. Lesion conspicuity is, therefore, greatly increased on fat-suppressed T2-weighted sequences (Figs. 2.8 and 2.9). On T2-weighted images with fat saturation, foci composed almost entirely of fat cells, such as focal fatty marrow or Modic II degenerative endplate changes, will be of lower signal intensity compared to those which contain red marrow alone or both red and yellow marrow (Figs. 2.10 and 2.11).
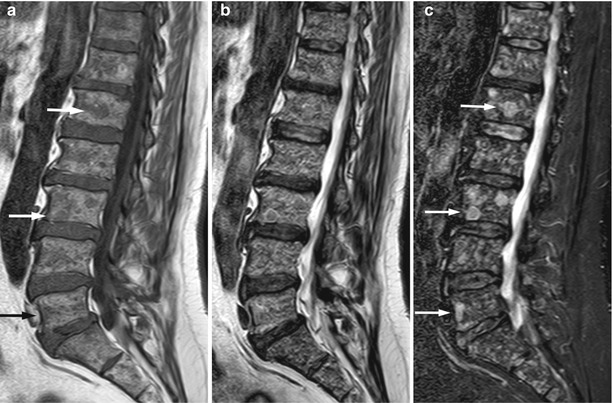
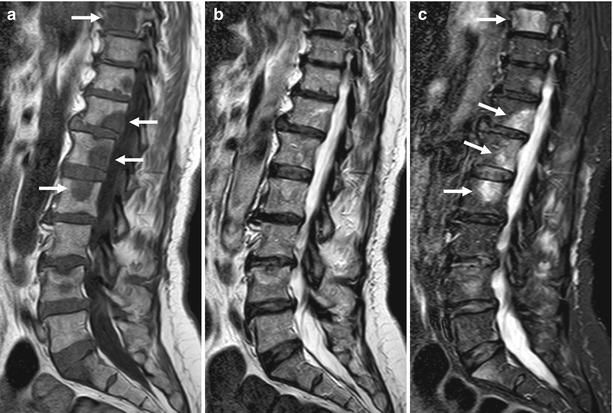
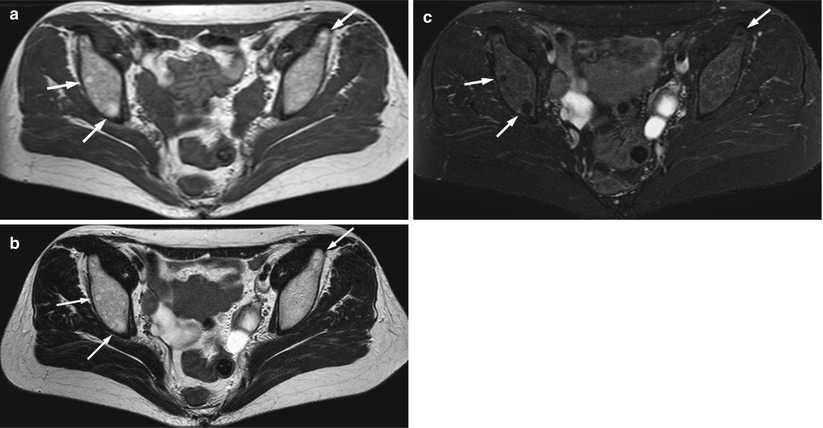
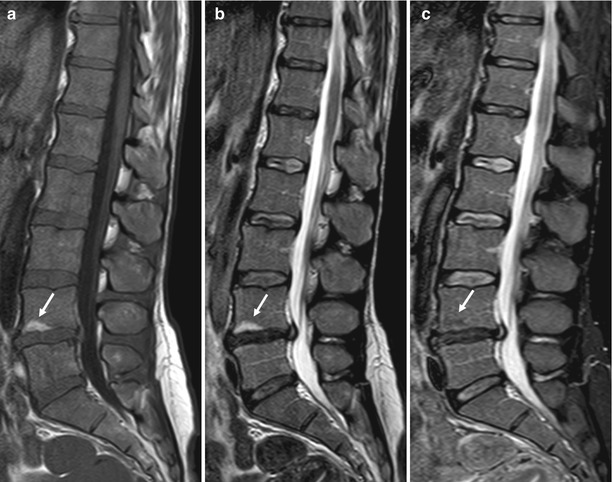
Fig. 2.8
Multiple myeloma, variegated pattern.
Comparison of T2-weighted images with and without fat suppression (a) Sagittal T1-weighted image of the lumbosacral spine of a 58-year-old man with multiple myeloma shows innumerable small, focal, hypointense lesions. Arrows point to representative lesions. (b) On corresponding T2-weighted FSE image, the myeloma lesions are hyperintense and imperceptible from the high signal intensity background marrow. (c) On corresponding STIR image, the myeloma lesions are hyperintense and easily recognized on a background of suppressed marrow signal (arrows)
Fig. 2.9
Bone metastases, lung cancer.
Comparison of T2-weighted images with and without fat suppression(a) Sagittal T1-weighted image of the lumbosacral spine of a 61-year-old woman shows multiple, hypointense focal lesions. Arrows point to representative lesions. (b) On corresponding T2-weighted FSE image, the metastatic foci are imperceptible from the high signal intensity background marrow. (c) On corresponding STIR image, metastatic lesions are hyperintense and easily recognized on a background of suppressed marrow signal (arrows)
Fig. 2.10
T2-weighted images with fat suppression, focal fatty marrow.
(a) Axial T1-weighted image of the pelvis of a 50-year-old woman shows foci of fatty marrow in the iliac bones (arrows). (b) On corresponding axial T2-weighted FSE image without fat suppression, foci of fatty marrow are still visible (arrows). (c) On corresponding axial T2-weighted fat-suppressed image, the signal intensity of the fatty marrow foci (arrows) is lower than that of background marrow
Fig. 2.11
T2-weighted images with fat suppression, Modic II degenerative endplate change.
(a) Sagittal T1-weighted image of the lumbosacral spine of a 40-year-old woman shows hyperintense Modic II degenerative endplate change at L4, presenting as focal fat (arrow). (b) On corresponding sagittal T2-weighted image without fat suppression, the Modic II endplate change remains hyperintense (arrow). (c) On sagittal STIR image, the signal intensity of the Modic II change is slightly hypointense to bone marrow (arrow)
Fat suppression may be achieved with application of either a chemically selective fat-saturation technique or an inversion recovery technique [1]. The chemically selective fat-saturation technique consists of application of a radiofrequency pulse which selectively suppresses the signal of fat protons. The smaller the chemical shift between fat and water protons (i.e., the lower the magnetic field applied), the more difficult it is to selectively suppress fat. Field inhomogeneity (presence of metal, interfaces of tissues with pronounced differences in proton density such as air and bone, off isocenter imaging, large field of view) will cause insufficient suppression of fat; increasing the bandwidth or setting the frequency direction parallel to a metallic prosthesis may render the susceptibility artifact less pronounced. On T2-weighted images with chemically selective fat saturation, yellow marrow signal intensity will be lower than that of muscle, red marrow will have approximately the same signal intensity with muscle, and most pathologic lesions tend to be hyperintense to muscle [1].
Short inversion time inversion recovery (STIR) techniques apply a 180° pulse to invert magnetization of all tissues being imaged. When the inverted longitudinal magnetization of fat has reached the null point after a delay time called inversion time (TI), a 90° RF pulse is applied generating signal from all, other than fat, tissues. Optimal TI for fat suppression is 130–170 ms for 1.5 T scanners. Because nonfatty tissues recover their longitudinal magnetization more slowly than fat, the signal-to-noise ratio (SNR) of this sequence is less than that of the chemically selective fat-saturation techniques. Contrast resolution is, however, very good because tissues with long T1 and T2 relaxation times appear very bright [7]. Although with this sequence fat suppression is more homogeneous, signal from tissues with similar relaxation times to fat (blood, paramagnetic contrast, mucoid or proteinaceous material, melanin) may be suppressed.
Key Points
T2-weighted fast spin-echo sequences should not be used for imaging of the bone marrow without fat suppression
Fat suppression of T2-weighted images can be achieved with chemically selective fat saturation or with an inversion recovery (STIR) technique
2.3 Chemical-Shift Imaging
Many diagnostic dilemmas with MR imaging of the bone marrow arise in the presence of red marrow; red marrow signal intensity may be close to that of abnormal lesions on both T1- and T2-weighted sequences. Chemical-shift (in-phase and opposed-phase) imaging may help establish the presence or absence of red marrow by exploiting the fact that water protons precess slightly faster than fat protons [1, 8].
Inside the MR scanner, spins precess at frequencies determined by the strength of the net magnetic field (Bnet). The main component of Bnet is the scanner’s static magnetic field (B0), but the electronic environment in tissues under study may also contribute to Bnet by producing local magnetic fields. The difference in precessional frequency conferred by the environment is known as the chemical shift [9]. The chemical shift most relevant to clinical imaging is the one between fat protons and water protons [10]. The additional local field generated by the electron clouds of fat molecules causes spins within adipose tissue to precess slightly slower than spins within water. This small difference in resonant frequency between protons in fat and protons in water is 3.5 ppm (parts per million), and it corresponds to 224 Hz at a magnetic field strength of 1.5 T and to 447 Hz for 3 T units [9]. Because water precesses faster, there will be times after excitation when fat and water spins will be in-phase (i.e., their transverse magnetization vectors will point to the same direction) and times when they will be 180° out-of-phase (i.e., their transverse magnetization vectors will point to opposite directions). At 1.5 T, fat and water protons are in-phase and out-of-phase every 2.25 ms. In other words, they will be out-of-phase 2.25 ms after excitation, in-phase at 4.5 ms, out-of-phase at 6.75 ms, and so forth. On out-of-phase images, in voxels which contain both water and fat, there is a cancellation of signal because their respective transverse magnetizations are in opposed phase. Conversely, on in-phase images, the transverse magnetization vectors of water and fat protons add together to produce a strong signal.
One of the major clinical applications of chemical shift is in bone marrow imaging. Since normal red marrow is composed of almost equal amounts of water and fat (about 40 % each, see Sect. 1.1), it will suffer significant signal loss on out-of-phase images (Fig. 2.12). This is helpful in distinguishing between red marrow and infiltrated marrow since the latter does not contain fat and will, therefore, not demonstrate signal loss (Figs. 2.13 and 2.14). Caution is warranted in older individuals, in whom, because of abundant, age-related fatty marrow, there may be no obvious signal loss on visual inspection of opposed-phase images (although signal loss is noted when regions of interest (ROIs) are placed and signal intensity measurements are obtained) (Fig. 2.15). Opposed-phase images must always be interpreted in conjunction with other sequences (T1, STIR), since a lesion that does not show signal loss may simply represent a focal area of fatty marrow (Fig. 2.16).
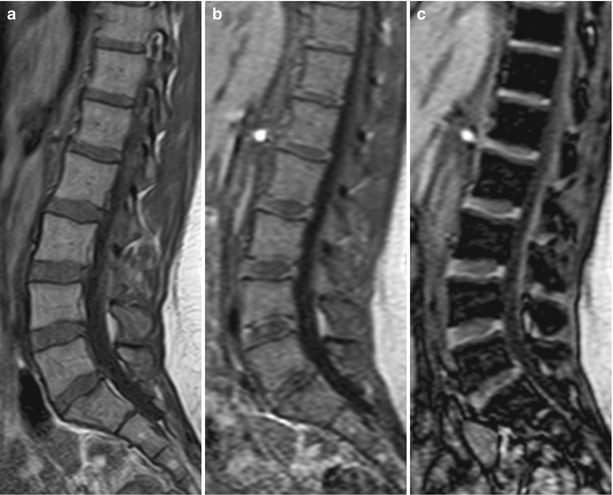
Fig. 2.12


Chemical-shift imaging, normal red marrow.
(a) Sagittal T1-weighted image of the lumbosacral spine of a 29-year-old healthy woman shows intermediate (higher than intervertebral disc) signal intensity of predominantly red marrow. (b, c) Sagittal in-phase (b) and out-of-phase (c) images of the lumbosacral spine in the same patient. There is homogeneous signal loss on the out-of-phase image in keeping with normal marrow
Related posts:


Stay updated, free articles. Join our Telegram channel
Full access? Get Clinical Tree
