Fig. 5.1
Vertebral hemangioma, CT.
Axial CT image (a) of T12 of a 60-year-old man with a vertebral hemangioma shows the typical polka dot sign representing reinforced trabeculae (arrow). Reconstructed sagittal CT image (b) nicely displays the vertically oriented, sparsely arranged trabeculae
Compressive VHs have a wide spectrum of appearances at CT, and it may be difficult to make a specific diagnosis based on imaging findings. CT may reveal aggressive features, such as lytic areas, expanded borders, indistinct cortex, and extraosseous soft-tissue extension [10]. On selective arteriography, most compressive hemangiomas demonstrate intense and extensive hypervascularity, whereas asymptomatic hemangiomas show few or no abnormal vessels [10, 11].
5.1.3 Magnetic Resonance Imaging
As with most bone marrow lesions, relative fat and water composition is responsible for the imaging appearance of vertebral hemangioma at MRI. Linear signal-void areas representing reinforced trabeculae, when present, are an additional distinguishing feature.
Most hemangiomas (asymptomatic, typical) display the following MRI features: intermediate to high signal intensity on T1W images (i.e., equivalent or superior to that of adjacent normal marrow) and intermediate to high signal intensity on T2W images (i.e., slightly or markedly superior to that of adjacent normal marrow) (Figs. 5.2 and 5.3). Pathologic studies have shown that the high T1 signal of vertebral hemangiomas is related to the presence of fatty stroma, whereas the vascular component of the lesion is mostly responsible for the high T2 signal [12]. The relation between high T1 signal and increased fat content has also been observed in studies comparing MRI findings with CT attenuation measurements [7]. On T2 fat-suppressed/STIR images, typical hemangiomas retain some high signal due to their vascular component (Figs. 5.2 and 5.3). This is in contradistinction to foci of fatty marrow, which exhibit marked signal dropout on such sequences (Fig. 5.4). Other than high T1 signal intensity, the more specific additional feature of hemangioma at MRI is the presence of linear and/or punctate signal-void areas representing the reinforced trabeculae. Although specific, this sign is not as frequently seen as its CT equivalent, the polka dot sign. The signal-void areas, when present against a background of high T1 and high T2 signal, give vertebral hemangiomas a characteristic “mottled” appearance, highly suggestive of VH [15]. On post-contrast T1-weighted images, most typical hemangiomas demonstrate some enhancement, ranging from not perceptible/minimal to moderate. This enhancement is more conspicuous on fat-suppressed sequences.
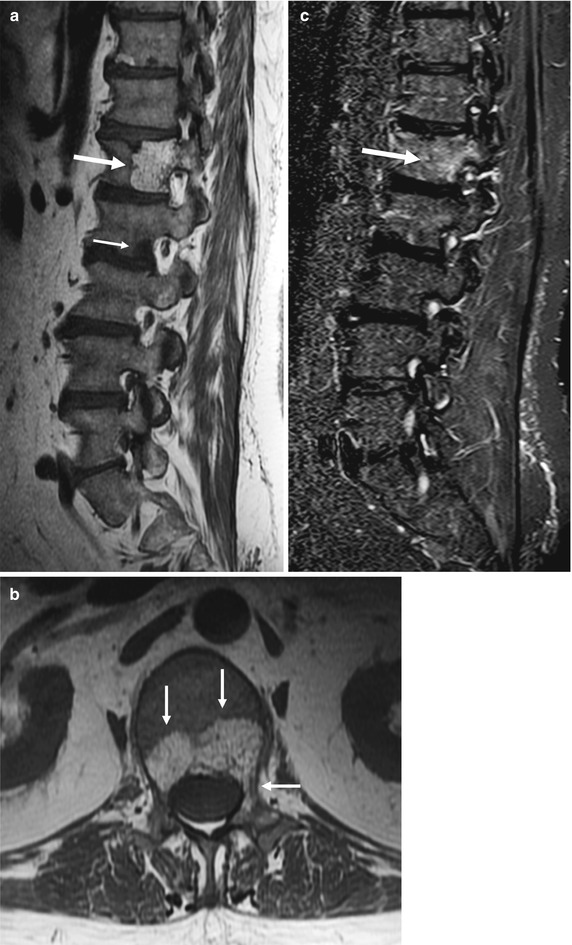
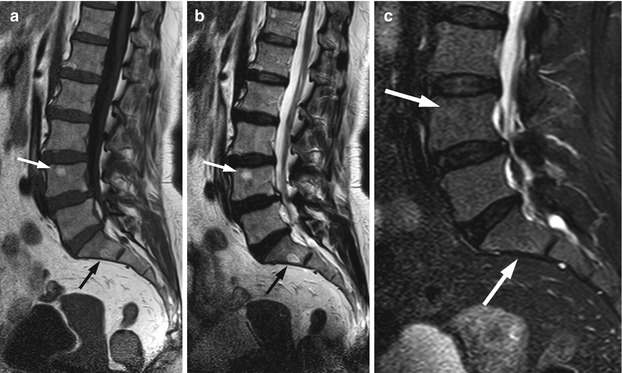
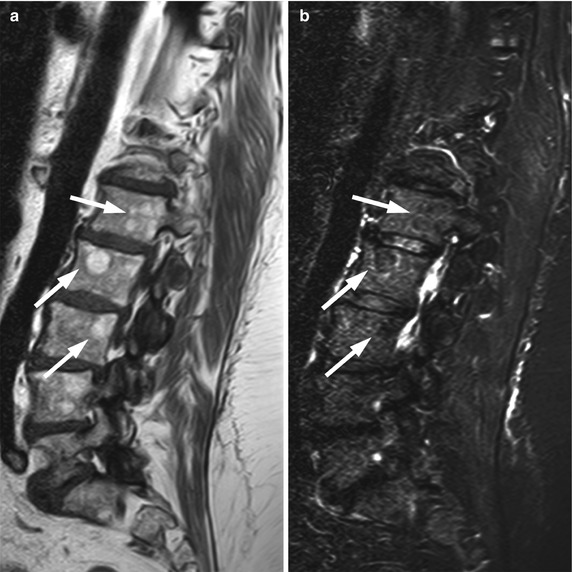
Fig. 5.2
Vertebral hemangioma, T1 hyperintense.
Sagittal (a) and axial (b) T1-weighted images of the lumbosacral spine of a 55-year-old man with prostate cancer show typical hemangioma (long arrow in a, arrows in b) with hyperintense fatty stroma and hypointense reinforced bony trabeculae involving the body and left pedicle of L1. Also noted is a hypointense bone metastasis at L2 (short arrow in a). On the corresponding sagittal STIR image (c), the hemangioma is partly hyperintense (arrow)
Fig. 5.3
Vertebral hemangioma, T1 isointense.
Sagittal (a) T1-weighted image of the lumbosacral spine of a 63-year-old woman shows hemangioma, isointense to normal marrow at S1 (black arrow). Hyperintense hemangioma is also noted at L3 (white arrow). Both lesions are hyperintense on the T2-weighted image (b, arrows) and retain some high signal on the STIR image (c, arrows)
Fig. 5.4
Focal fat, signal dropout on STIR.
Sagittal T1-weighted (a) image of the lumbosacral spine of a 58-year-old woman shows several hyperintense foci (arrows) corresponding to focal fat. On the sagittal STIR image (b), these foci exhibit signal dropout and become hypointense to surrounding marrow (arrows)
Key Points
Typical vertebral hemangiomas demonstrate high T1 signal
On STIR, vertebral hemangiomas retain some high signal, unlike areas of focal fatty marrow which exhibit signal dropout
Thickened trabeculae may be seen as linear/punctate signal-void areas
Occasionally, hemangiomas with no signs of aggressiveness (e.g., expansion, soft-tissue mass, compression) may appear hypointense to marrow on T1W images (Fig. 5.5). This appearance, which may mimic a malignant lesion, is due to a significantly low proportion of adipocytes and an abundance of vessels and interstitial edema. Signal-void areas, if present, may point to the correct diagnosis and should be sought carefully in lesions that are T1 hypointense [8]. When dealing with such atypical lesions, correlation with CT and/or close imaging follow-up is warranted, especially in patients with a known malignancy (Fig. 5.6).
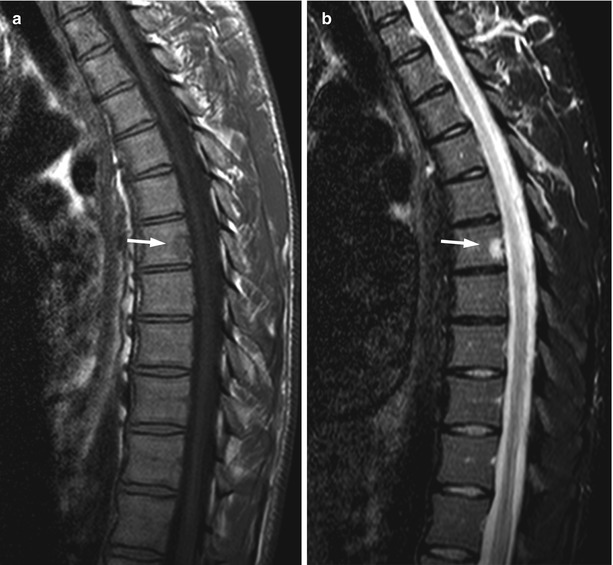
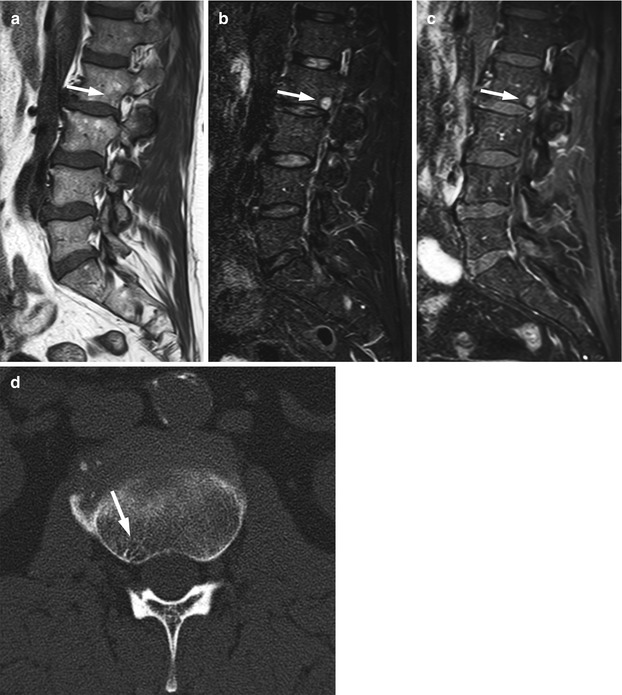
Fig. 5.5
Atypical hemangioma, T1 hypointense.
Sagittal T1-weighted image (a) of the thoracic spine of a 25-year-old man shows small, atypical hypointense hemangioma at the vertebral body of T7 (arrow). On the STIR image (b), the lesion is markedly hyperintense (arrow)
Fig. 5.6
Atypical hemangioma, value of CT.
Sagittal T1-weighted image (a) of the lumbosacral spine of a 60-year-old man shows a predominantly hypointense lesion at L2 (arrow). The lesion is markedly hyperintense on the STIR image (b, arrow) and enhances avidly on the T1-weighted post-contrast fat-saturated image (c, arrow). Axial CT image (d) at the level of the lesion shows typical end-on reinforced trabeculae (polka dot sign) of osseous hemangioma (arrow)
Low signal intensity on T1-weighted images is very commonly seen in compressive hemangiomas. In a review article, low T1 signal intensity was found to be present in 48 % of 25 cases of compressive lesions, and in smaller-sample series, this percentage is often even higher [8]. In the same article reviewing the imaging findings of compressive vertebral hemangiomas, the polka dot sign was found at CT in 80 % of 41 cases. It is, indeed, generally accepted that CT allows a specific diagnosis to be made in a larger percentage of patients with compressive lesions than MRI. Compressive lesions with atypical features that are initially imaged with MRI should, therefore, be further evaluated with CT. Other MRI characteristics of compressive hemangiomas include markedly high signal on T2 and avid contrast enhancement, both nonspecific. MRI is the best method to demonstrate the aggressive characteristics of compressive hemangiomas, namely the presence and extent of extraosseous soft tissue, the compression of spinal cord and/or nerve roots and the presence of epidural hematoma (Fig. 5.7).
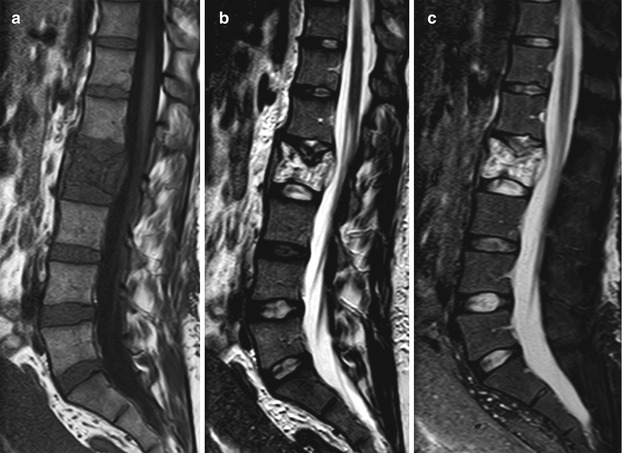
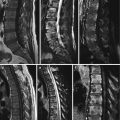
Fig. 5.7
Compressive hemangioma, MR images.
Sagittal T1-weighted (a), T2-weighted (b) and STIR (c) images of the lumbosacral spine of a 31-year-old woman who presented with acute onset low back pain at the immediate post-partum period. L2 is collapsed with low T1 and high T2 signal intensity. Reinforced vertical trabeculae, better seen on the T2W image, are suggestive of hemangioma. Note soft-tissue mass in the anterior epidural space causing thecal sac compression
Key Points
A minority of vertebral hemangiomas demonstrate atypical MRI features: low T1 signal, very intense contrast enhancement, and in some cases extraosseous soft-tissue extension
These atypical hemangiomas may be indistinguishable from a malignant lesion on MRI
Correlation with CT may aid diagnosis
MRI is the best exam to demonstrate the aggressive features of compressive hemangiomas (soft-tissue mass, neural compression)
5.2 Metastases: Focal Pattern
5.2.1 Clinical Background
The majority of cancer patients with solid primary tumors will ultimately develop metastatic disease to the bones, most of them via hematogenous spread. Only few of the circulating tumor cells survive the host’s defense mechanisms and manage to reach the bone marrow vasculature. An even smaller fraction of tumor cells will escape the marrow vasculature by destroying the vascular basement membrane. Once in the bone marrow, they interact with hematopoietic and stromal cells, initiating a vicious cycle of tumor growth and bone destruction (seed and soil theory) [16]. Osteoclast activation resulting in bone resorption is achieved through the release of various tumor-derived factors. In turn, bone resorption leads to the release of growth factors which promote tumor proliferation. It, therefore, seems that the interaction between specific tumor cells and the bone marrow microenvironment determines the development of bone metastases [17].
The skeleton is one of the most frequent sites of metastatic disease, and bone metastases are associated with increased morbidity [18]. The vast majority of patients with bone metastases have primary tumors of the breast, prostate, thyroid, lung, kidney, and pancreas. Lung, breast, and prostate cancers, which are the most common human cancers, display increased avidity for the skeletal system. Bone metastases are characterized as osteolytic or osteoblastic depending on whether there is bone resorption or bone formation, respectively. Actually, at any metastatic site there is a spectrum of bone tumor activity, ranging from pure lysis to pure sclerosis. It is the predominant feature which determines the characterization of a bone metastasis as osteolytic or osteoblastic.
5.2.2 Imaging
Conventional radiographs, computed tomography (CT), skeletal scintigraphy, [(18)F]-fluoro-2-D-glucose positron emitting tomography (FDG-PET), and MRI may all be employed in the work-up of skeletal metastases, each with specific indications. Conventional radiographs, CT, and skeletal scintigraphy depend on changes in bone turnover for lesion detection, and FDG-PET assesses metabolic activity. MRI is the only imaging modality which directly visualizes the bone marrow. It does not require bone loss or a perilesional reaction to identify bone metastases but may depict lesions which are confined to the marrow, before they affect the bony substrate.
MRI may detect lytic bone metastases in patients with negative radiographs, CT or bone scans. This is explained by the fact that over 30 % of bone loss must occur before a lesion becomes apparent on CT images and a much higher percentage of bone loss (about 50 %) is required for osteolysis to become evident on plain radiographs. CT will adequately depict cortical destruction by a metastatic lesion, but it may miss lesions confined to the marrow of spongious bones (vertebrae, iliac bones) unless marked trabecular destruction has occurred [19]. Osteoporosis and degenerative osteoarthropathy may, at times, be difficult to distinguish from bone metastases [20]. Caution is required, particularly with the increasing use of whole-body CT (WBCT) for skeletal assessment, not to diagnose small intracortical hypodense foci as bone metastases when, in fact, they may represent normal structures such as vessels. As with MRI, we should refrain from characterizing lesions smaller than 5 mm.
Bone scans detect bone metastases with increased sensitivity and much earlier than plain radiographs. However, aggressive bone metastases with rapid bone destruction or bone metastases at an early stage lack the osteoblastic reaction which is responsible for the radiotracer uptake and may, therefore, not show on a bone scan [21]. Small intramedullary metastases may fail to incite sufficient bone remodeling, and a mild increase in uptake may be obscured by the more intense uptake of normal cortical bone. The vertebrae and the long bones are bones with large marrow cavities, and consequently involvement of the cortex by bone metastases that lodge in the bone marrow will occur later in the course of the disease [22]. This explains why in a study comparing bone scintigraphy to MRI in patients with disseminated metastatic disease, bone scans identified the majority of spinal metastatic lesions involving the vertebral cortex but only a third of those in a subcortical location and none of the purely intramedullary lesions [23]. Bone scans, on the other hand, may fare better than MRI in the assessment of bones with limited marrow cavities such as the ribs or in the depiction of small intracortical metastases. False-positive bone scans are common, for example, in cases of degenerative disc disease and fractures, quite frequent findings in the elderly population which is also the age group more likely to harbor bone metastases [24, 25].
There is still ongoing discussion regarding the value of whole-body MRI (WBMRI) versus FDG-PET/CT for the detection of skeletal metastases. Both modalities are more accurate than bone scans in detecting bone metastases, and both offer the advantage of complete TNM staging. Most authors conclude that both WBMRI and FDG-PET/CT are robust imaging modalities for screening for osseous metastases provided that, in the case of FDG-PET/CT, investigated primary tumors are FDG-avid [26–29]. Indeed, a relative drawback of FDG-PET/CT in this setting is the poor FDG avidity of certain tumors such as prostate cancer, myxoid gastrointestinal tumors, low-grade sarcomas, and renal cell carcinoma [30]. On the other hand, FDG-PET/CT may be used as a problem-solving tool for indeterminate MRI lesions. Although MRI is extremely sensitive in detecting marrow lesions its specificity is relatively poor. For example, an atypical hemangioma, which may simulate a bone metastasis on MRI, will show no metabolic activity on FDG-PET. Recently, whole-body FDG-PET/MRI combining the metabolic and morphologic information of PET and MRI has emerged as a promising new technique for the evaluation of malignant bone lesions, including metastases [31].
Key Points
Plain radiography and, to a lesser degree, CT require significant bone loss before a lytic bone metastasis becomes evident
Scintigraphy detects bone remodeling associated with a bone metastasis
MRI can depict metastases confined to the bone marrow before any bone destruction occurs
FDG-PET/CT and WBMRI are both robust modalities for screening of skeletal metastases
5.2.3 Magnetic Resonance Imaging
The spine is the most common site for bone metastases because of the abundance of red marrow. The thoracic spine is more often affected, followed by the lumbar and, lastly, the cervical spine. Spinal metastases initially involve the vertebral body. The past belief that bone metastases show a predilection for the pedicles was due to the fact that destruction of the pedicles was more easily detected on conventional radiographs in comparison to destruction of the vertebral body [22, 32]. The increase in the fatty component of the bone marrow which occurs with age, central skeleton included, facilitates the diagnosis of metastases even of very small size, with MRI (Fig. 5.8). In older adults, hypointense metastases are easily recognized against a background of hyperintense fatty marrow on T1-weighted MR images. In children and young adults, red marrow predominates in the central skeleton and the sensitivity of MRI for the detection of vertebral metastases may be somewhat lower. For example, it has been found that metastases from neuroblastoma are detected with greater accuracy after the first year of life, because at that age some amount of fatty marrow has appeared in the spine [33].
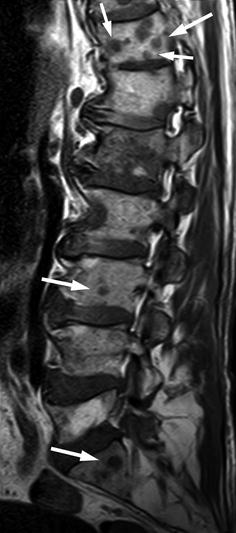
Fig. 5.8
Bone metastases, high sensitivity of MRI.
Sagittal T1-weighted image of the lumbosacral spine of a 73-year-old man with metastatic lung cancer shows multiple metastases, including several of a few mm size (arrows). The very small lesions are easily seen against a background of hyperintense fatty marrow
Key Points
Location of vertebral metastases
Thoracic > lumbar > cervical
Vertebral body > posterolateral elements
In the large majority of patients, osseous metastases manifest with a focal rather than a diffuse MR pattern. The most important sequence for determining the presence and pattern of bone metastases is the T1-weighted sequence. On T1-weighted images, osteolytic metastases appear as well-defined, round- or oval-shaped foci which are hypointense and, less often, isointense to muscle or intervertebral discs (Fig. 5.9). Hyperintense bone metastases are extremely rare and have been reported only in association with melanoma (Fig. 5.10) [34]. The signal intensity of metastatic lesions is homogeneous because they destroy bony trabeculae and replace normal bone marrow in contiguity, rather than intermingle with it. This may be a useful sign in differentiating bone metastases from bone marrow edema on T1-weighted images; bone marrow edema shows heterogeneous signal intensity due to coexistence of hyperintense foci of normal fatty marrow with hypointense foci of bone marrow edema (Figs. 5.11 and 5.12). Low-signal-intensity focal lesions on a T1-weighted sequence may also represent red marrow rests. The signal intensity of red marrow rests is usually higher than that of disc or muscle (Fig. 5.13). A centrally located hyperintense focus (bull’s eye sign), if present, is an indicator of hematopoietic marrow. However, additional sequences (STIR, chemical-shift imaging, post-contrast T1-weighted) may be required to confidently differentiate between the two. Osteoblastic metastases are very hypointense because of paucity of moving protons. Their signal intensity may approximate that of cortical bone (signal-void focal pattern) (Fig. 5.14). An enostosis (bone island) may appear quite similar to an osteoblastic metastasis on T1-weighted images, but it displays homogeneous, very low signal intensity on all pulse sequences. Radiating bony streaks (thorny border) when present are also characteristic of an enostosis (Fig. 5.15).
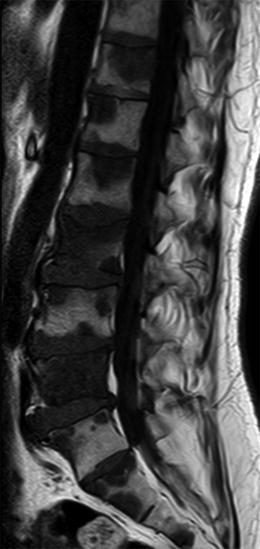
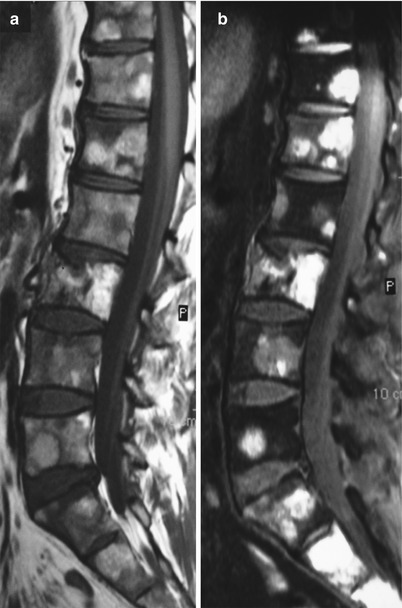
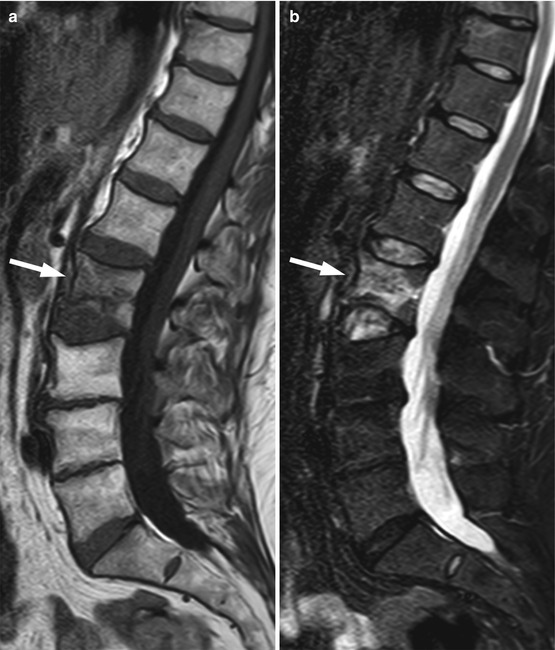
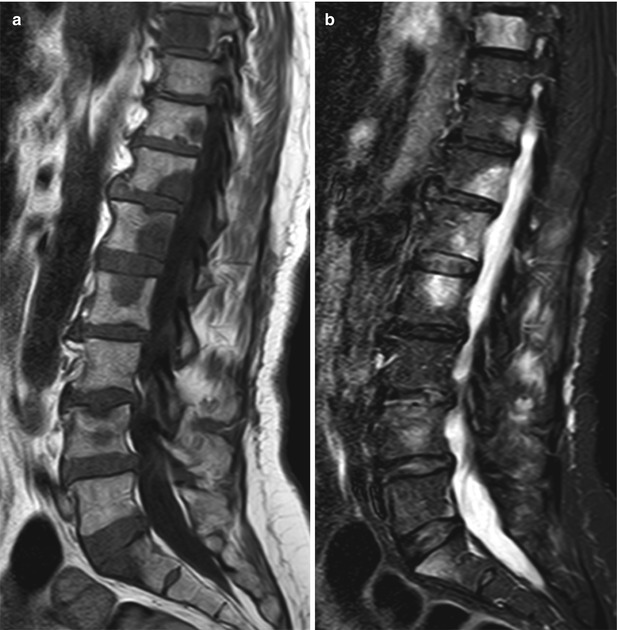
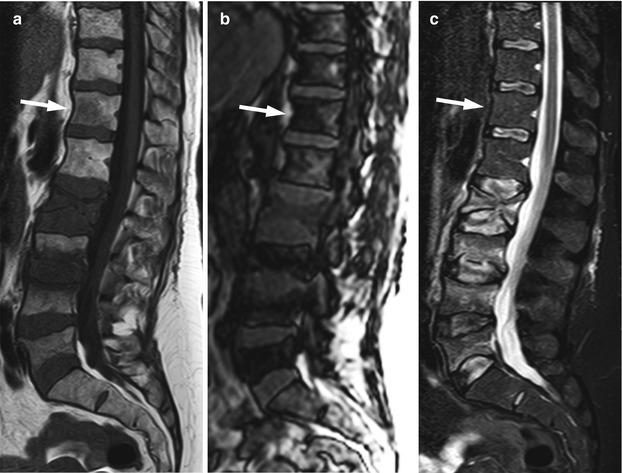
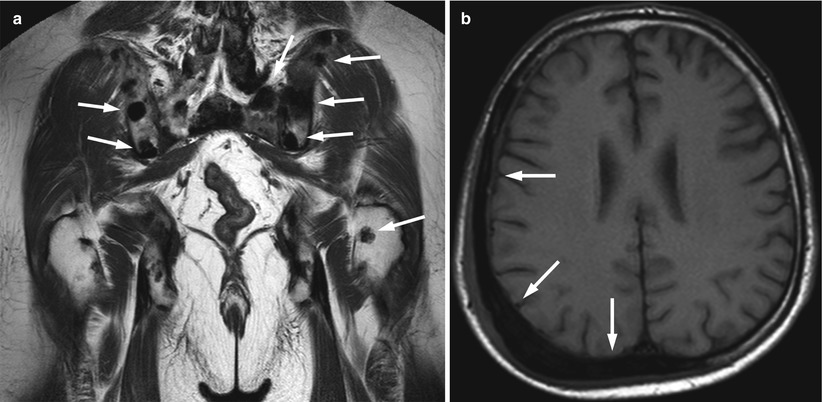
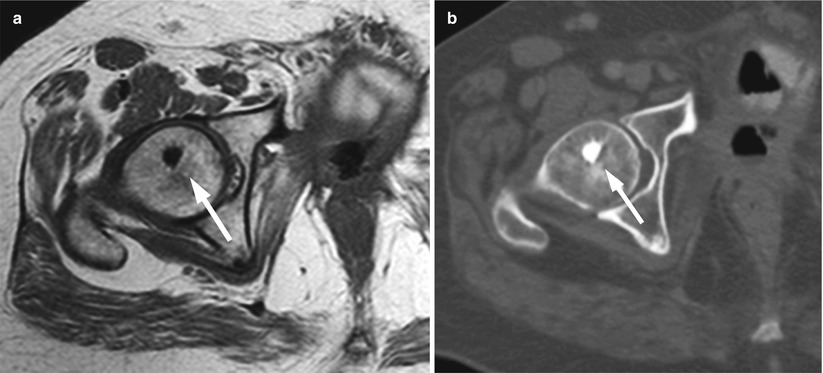
Fig. 5.9
Bone metastases, hypointense focal pattern.
Sagittal T1-weighted image of the lumbosacral spine of a 53-year-old man with metastatic colon cancer shows multiple focal bone metastases, hypointense relative to the intervertebral discs
Fig. 5.10
Bone metastases, rare hyperintense appearance.
Sagittal T1-weighted image (a) of the lumbosacral spine of a 43-year-old man with metastatic melanoma shows multiple hyperintense metastases. T1-weighted image with fat saturation (b) shows very high signal intensity of metastatic lesions in keeping with melanin or hemorrhage
Fig. 5.11
Heterogeneous low T1 signal, bone marrow edema.
Sagittal T1-weighted image (a) of the lumbosacral spine of a 50-year-old woman with a compressive fracture of L2 following heavy weight lifting. There is heterogeneous signal intensity of most of the vertebral body due to hypointense edema intermingling with hyperintense normal fatty marrow (arrow). A low-signal-intensity fracture line is seen adjacent to the inferior endplate. On sagittal STIR (b), marrow edema appears hyperintense (arrow)
Fig. 5.12
Homogeneous low T1 signal, bone metastases.
Sagittal T1-weighted image (a) of the lumbosacral spine of a 62-year-old woman with lytic bone metastases from lung cancer shows multiple metastatic foci with homogeneous low signal intensity. On sagittal STIR (b), metastases are hyperintense
Fig. 5.13
Red marrow rest, hyperintense to intervertebral discs.
Sagittal T1-weighted image (a) of the lumbosacral spine of a 51-year-old woman shows multiple osteoporotic compression fractures of different ages at L2–L5. There is a hypointense focus at T12 (arrow) which has higher signal intensity than the intervertebral discs. On the out-of-phase image (b), the lesion shows signal dropout, and on STIR (c) there is no signal hyperintensity. The findings are consistent with a red marrow rest
Fig. 5.14
Bone metastases, signal-void focal pattern.
(a) Coronal T1-weighted image of the pelvis of a 58-year-old man with prostate cancer shows multiple very low-signal-intensity (signal void) skeletal metastases (arrows). (b) Axial T1-weighted image of the skull of a 62-year-old man with transitional cell carcinoma (TCC) of the bladder shows expansile, very low-signal-intensity osteoblastic bone metastasis (arrows)
Fig. 5.15
Enostosis (bone island), signal-void focal pattern.
Axial T1-weighted image (a) of the pelvis of a 59-year-old man shows very low-signal-intensity bone island at the right femoral head (arrow) with typical radiating streaks also shown on corresponding CT image (b)
On STIR images, bone metastases of an osteolytic nature become hyperintense. Red marrow rests, either become imperceptible or appear mildly hyperintense to background marrow; occasionally a focus of red marrow may appear moderately hyperintense on STIR images. Osteoblastic metastases show either no or mild heterogeneous increase in signal intensity (Fig. 5.16). The T2 halo sign which consists of a hyperintense rim surrounding a very low-signal-intensity lesion on STIR images, when present, is a very specific additional feature of an osteoblastic metastasis (Fig. 5.17). The hyperintense rim is believed to be caused by fluid, filling the area of destroyed bony trabeculae around the metastatic focus [35].
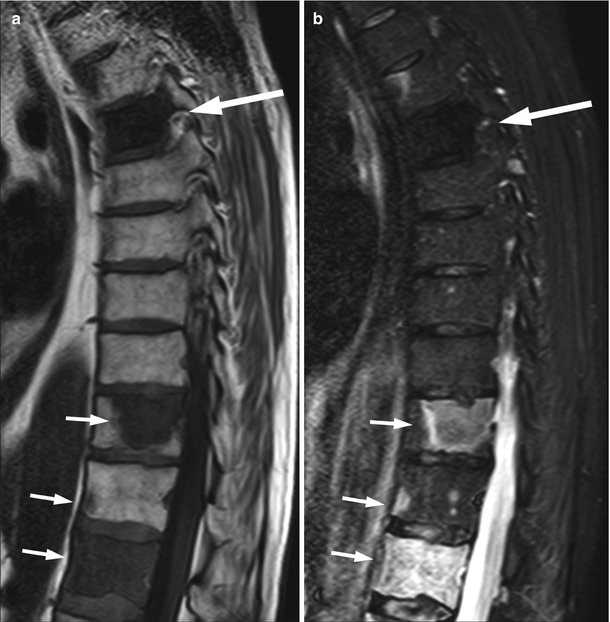
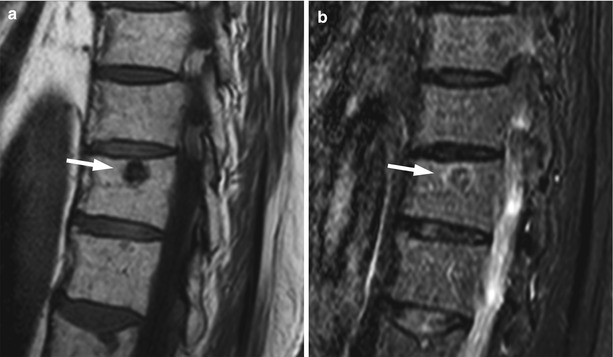
Fig. 5.16
Lytic and blastic bone metastases, appearance on STIR.
Sagittal T1-weighted (a) and STIR (b) images of the thoracic spine of a 65-year-old man with prostate cancer and both lytic and blastic bone metastases. Osteoblastic metastasis (long arrow) shows low signal intensity on STIR. Osteolytic metastases (short arrows) appear markedly hyperintense on STIR
Fig. 5.17
Osteoblastic metastasis, T2 halo sign.
Magnified sagittal T1-weighted image (a) of the thoracic spine of a 72-year-old man with prostate cancer shows a very low-signal-intensity osteoblastic metastasis at T11 (arrow). (b) On STIR, there is a rim of high signal intensity (T2 halo sign) surrounding the predominantly low-signal-intensity metastasis (arrow)
With chemical-shift imaging, most bone metastases show no or less than 20 % signal loss on out-of-phase images [36]. In fact, osteolytic metastases may even show a small increase in signal intensity and appear hyperintense on the out-of-phase compared to the in-phase images (Fig. 5.18). This is in contradistinction to red marrow rests which usually show a more than 20 % signal dropout on opposed-phase imaging. Chemical-shift imaging is not helpful for the evaluation of osteoblastic metastases.
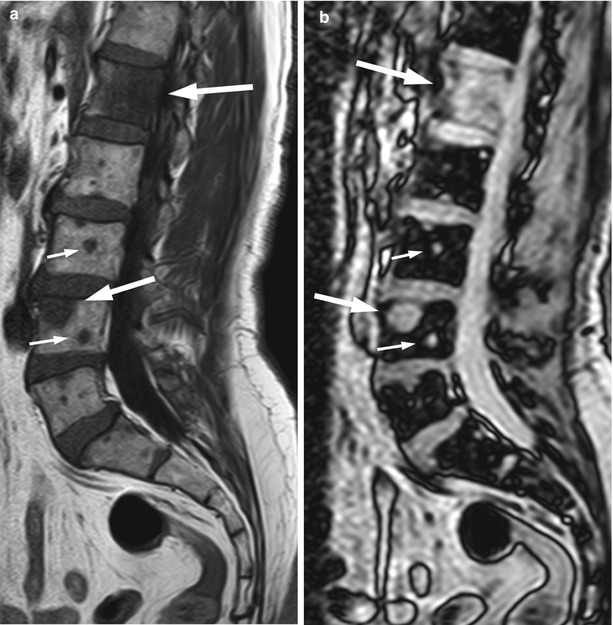
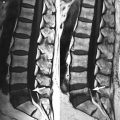
Fig. 5.18
Osteolytic metastases: chemical-shift imaging.
Sagittal T1-weighted (a) and out-of-phase (b) images of the lumbosacral spine of a 64-year-old man with prostate cancer and lytic bone lesions. Metastatic lesions (arrows) appear hypointense on the T1-weighted image. On the out-of-phase image, they do not show signal loss, appearing hyperintense to normal marrow (arrows)
On contrast-enhanced T1-weighted images without fat saturation, untreated osteolytic lesions become iso- or hyperintense to normal marrow. A more than 40 % enhancement on post-contrast T1-weighted images is characteristic of malignancy [37]. Osteolytic metastases may not be discernible on the enhanced images unless careful comparison with the pre-contrast images is made or fat suppression is applied (Fig. 5.19). Unlike osteolytic metastases, osteoblastic deposits usually show mild or no obvious contrast uptake (Fig. 5.20).
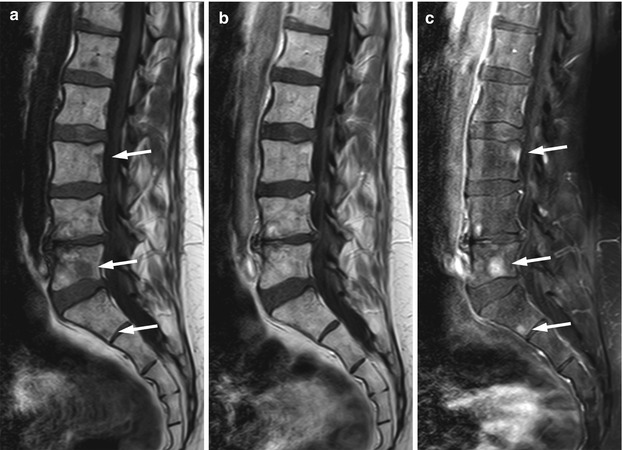
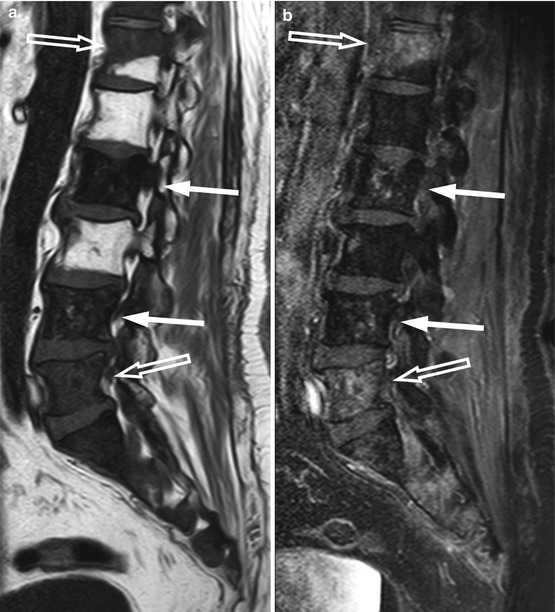
Fig. 5.19
Osteolytic metastases: increased lesion conspicuity on post-contrast fat-suppressed T1-weighted images.
Sagittal T1-weighted (a), post-contrast T1-weighted (b), and post-contrast fat-suppressed T1-weighted (c) images of the lumbosacral spine of a 55-year-old woman with breast cancer. Several small hypointense skeletal metastases are observed on the T1-weighted image (arrows). On the post-contrast T1-weighted image, they are indistinguishable from normal marrow, but they are clearly seen on the contrast-enhanced image with fat suppression (arrows)
Fig. 5.20
Blastic versus lytic metastases: differences in contrast enhancement.
Sagittal T1-weighted (a) and post-contrast fat-suppressed T1-weighted (b) images of the lumbosacral spine of a 74-year-old man with prostate cancer and mixed skeletal metastases. There is minimal increase in the signal intensity of the predominantly blastic lesions at L2 and L4 on the post-contrast image (solid arrows). Predominantly lytic lesions at T12 and L5 show more pronounced enhancement (open arrows)
On diffusion-weighted images with high b-values, lytic bone metastases are hyperintense and easily recognized. Their ADC values are high, often higher than 1.0 × 10⁻³ mm2/s, because they exhibit increased diffusivity relative to the very restricted diffusion of normal fat-containing marrow (Fig. 5.21) [38]. Osteoblastic metastases are generally characterized by more pronounced diffusion restriction (i.e., lower ADC values) than osteolytic lesions because of new bone formation; occasionally their ADC values overlap with those of normal marrow.
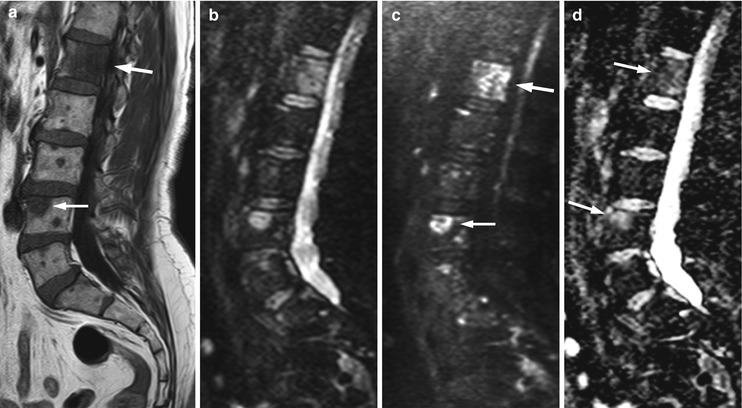
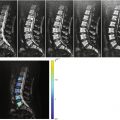
Fig. 5.21
Osteolytic metastases, diffusion-weighted imaging.
Sagittal T1-weighted image (a), diffusion-weighted images with b-value 0 (b) and b-value 750 (c) and ADC map (d) of a 64-year-old man with prostate cancer and multiple osteolytic metastases (same patient as in Fig. 5.18). The arrows point to the two larger lesions. The metastases are very hyperintense on the high b-value DW image. ADC values of the L1 and L4 lesions are 0.910 × 10⁻³ and 1.180 × 10⁻³ mm2/s, respectively (d)
Key Points
Osteolytic Metastases: typical MRI appearance (Fig. 5.22)
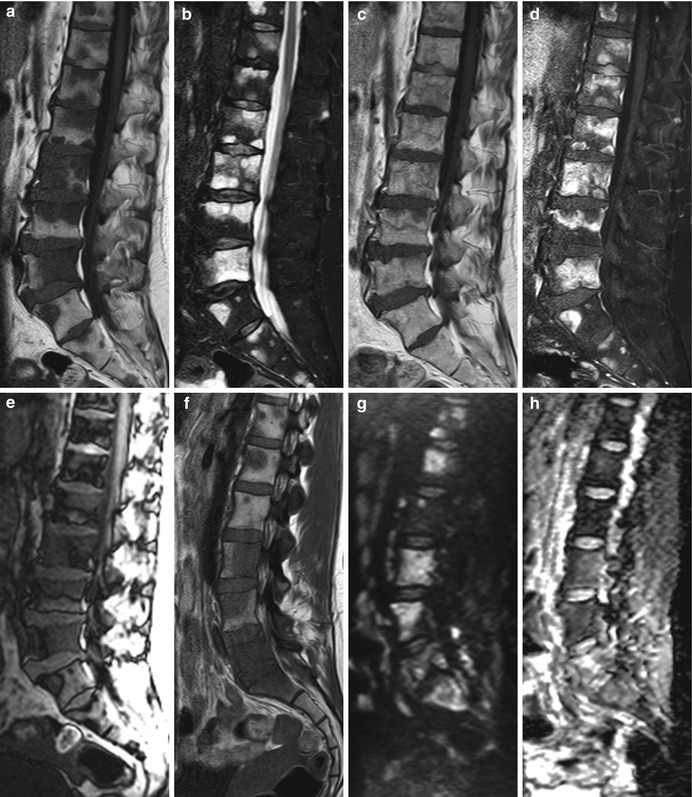
Fig. 5.22
Osteolytic metastases, typical MRI appearance.
(a–e) Sagittal T1-weighted image (a) of the lumbosacral spine of a 53-year-old man with skeletal metastases from colon cancer shows several focal lesions which are hypointense to the intervertebral discs. On STIR (b), the lesions become markedly hyperintense. On the post-contrast T1-weighted image (c), they enhance and become almost isointense to normal marrow; lesion conspicuity increases on the fat-suppressed, contrast-enhanced image (d). On the out-of-phase image (e), there is no significant signal loss of the lesions. (f–h) Sagittal T1-weighted image (f) of the lumbosacral spine of a 29-year-old woman with breast cancer shows multiple low-intensity (iso- or hypointense to the discs) bone metastases. On the diffusion-weighted image with b-value 750 (g), the metastases appear as high-intensity lesions. ADC values calculated from the corresponding ADC map (h) ranged from 0.9 to 1.9 × 10⁻³ mm2/s
Hypointense to intervertebral discs and muscle on T1-weighted images
Moderately to markedly hyperintense on STIR
>40 % enhancement on post-contrast T1-weighted images
No or <20 % signal loss on out-of-phase images
High ADC values (often higher than 1.0 × 10⁻³ mm2/s)
Key Points
Osteoblastic metastases: typical MRI appearance (Fig. 5.23)
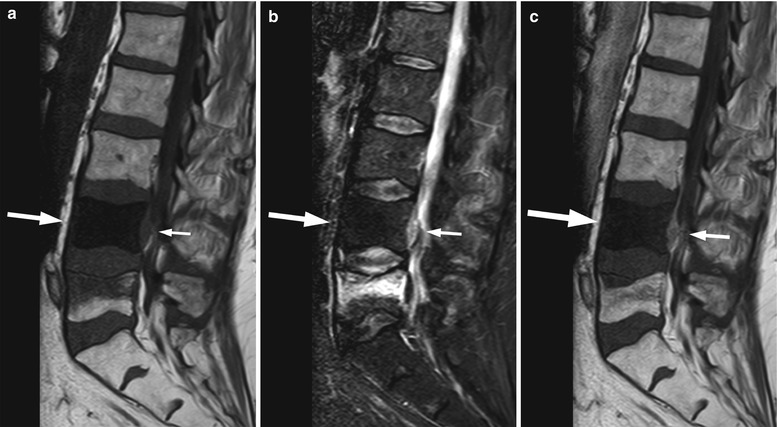
Fig. 5.23
Osteoblastic metastases, typical MRI appearance.
Sagittal T1-weighted image (a) of a 69-year-old man with prostate cancer shows a very low-signal-intensity metastasis at L4 (long arrow). There is no hyperintensity on STIR (b, long arrow), and minimal enhancement is noted on the post-contrast image (c, long arrow). There is an associated epidural soft-tissue component (short arrow on a, b, c) and a compression fracture of L5
Very hypointense on T1-weighted images (similar to cortical bone)
Mild or no hyperintensity on STIR (look for T2 halo sign)
Mild or no enhancement on post-contrast T1-weighted images
ADC values may overlap with those of normal marrow
Bone metastases may break through the cortical bone and present with an extraosseous soft-tissue component. Cortical destruction is easily diagnosed when the markedly low signal of cortical bone is lost (Fig. 5.24). Occasionally, extraosseous extension of a metastatic bone lesion may occur without evidence of gross cortical or trabecular destruction. This is usually observed in metastases from small round cell tumors, such as neuroblastoma, small cell lung carcinoma, Ewing’s sarcoma, and rhabdomyosarcoma, possibly reflecting the permeative nature of these tumors. A similar pattern of extraosseous soft-tissue extension with apparent preservation of cortical bone integrity has also been classically described in bone marrow lymphoma [39]. T1-weighted images are best suited for the diagnosis of tumor extending to the epidural space or intervertebral foramina (Fig. 5.25). The draped curtain sign is caused by tumor spreading to the right and left of the meningovertebral ligament which attaches the anterior surface of the dural sac to the posterior longitudinal ligament (Fig. 5.26) [40]. Symptomatic cord compression occurs in 10–20 % of patients with vertebral metastases (Fig. 5.27) [41]. Long-standing compression by epidural tumor may cause hyperintense signal in the spinal cord on T2-weighted images; contrast enhancement of the cord may or may not be present.
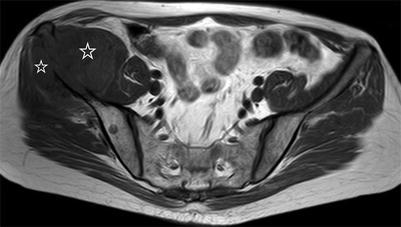
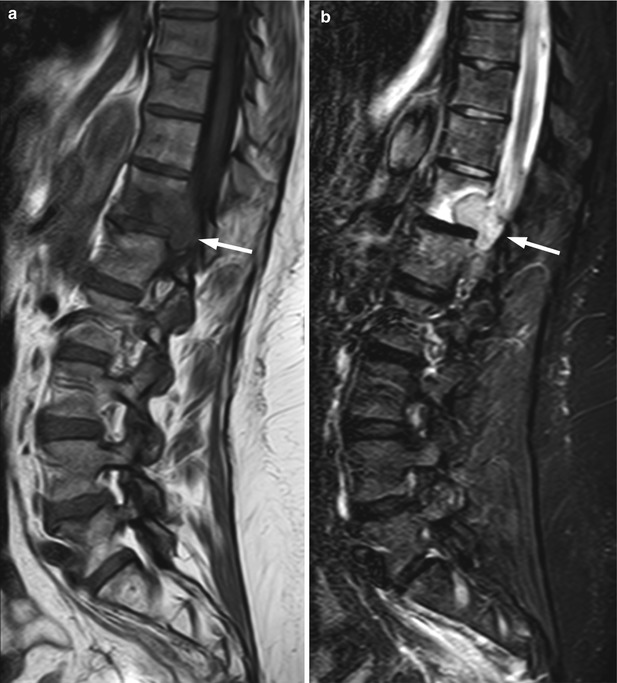
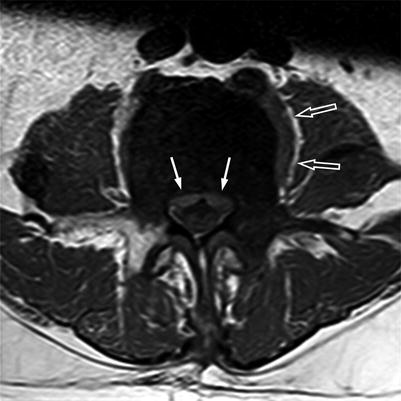
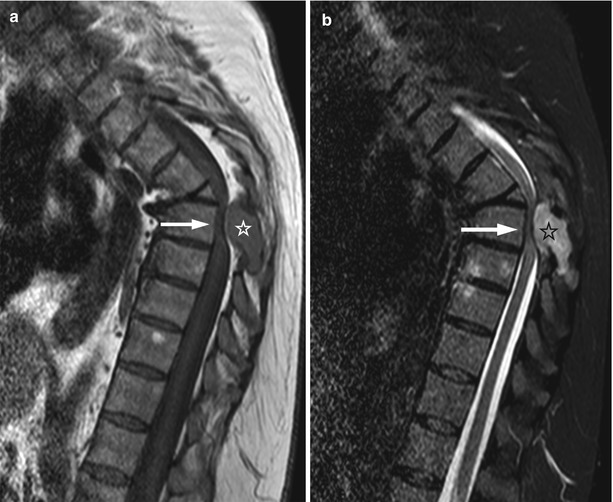
Fig. 5.24
Extraosseous extension of bone metastasis: loss of cortical low signal intensity on T1-weighted imaging.
Axial T1-weighted image of the pelvis of a 43-year-old man with metastatic malignant nerve sheath tumor shows right iliac bone metastasis with destruction of the bony cortex seen as loss of normal cortical signal void and large associated extraosseous soft-tissue mass (asterisks). Also seen is small round hypointense bone metastasis in the right posterior iliac wing
Fig. 5.25
Bone metastasis, foraminal extension.
Sagittal T1-weighted (a) and STIR (b) images of the lumbosacral and lower thoracic spine of a 64-year-old woman with endometrial cancer show metastasis at T12 with extraosseous extension in the left T12-L1 intervertebral foramen completely replacing foraminal fat (arrow)
Fig. 5.26
Anterior epidural mass: the draped curtain sign.
Axial T1-weighted image of a 69-year-old man with prostate cancer and an osteoblastic metastasis at L5 shows associated soft-tissue mass in the anterior epidural space spreading to the left and to the right of the meningovertebral ligament, resembling a draped curtain (solid arrows). Also note left paraspinal soft-tissue mass (open arrows)
Fig. 5.27
Bone metastasis, cord compression.
Sagittal T1-weighted (a) and STIR (b) images of the thoracic spine of a 57-year-old woman with lung cancer shows metastatic lesion involving the posterolateral elements of T6 with associated soft-tissue mass in the posterior epidural space (asterisk), causing marked compression of the spinal cord (arrow). A chronic compression fracture of T5 is also seen
The occasional occurrence of peripheral skeletal metastases led to the evaluation of whole-body MRI (WBMRI) for bone metastases screening. Initially, WBMRI was performed utilizing T1-weighted and STIR sequences; more recently Diffusion-Weighted Imaging (DWI) was added to oncology protocols. Meta-analysis of data from 11 WBMRI studies showed a pooled sensitivity of 89.9 % and a pooled specificity of 91.8 % for the detection of bone metastases [42]. The implementation of DWI to WBMRI seems to increase its sensitivity and positive predictive value for the detection of bone metastases [43]. However, even though the sensitivity increases, the specificity of WBMRI may be compromised by the addition of DWI [42]. In the case of bone metastases from prostate cancer, DWI with high b-values shows increased lesion conspicuity compared to STIR, because the pronounced osteoblastic component and reparative bone formation of these lesions decreases T2 relaxation time; on the other hand, for breast cancer bone metastases, DWI and STIR seem to have similar sensitivities [44]. DWI is therefore recommended for WBMRI protocols of prostate cancer. WBMRI detects more lesions than MRI limited to the spine; the clinical impact of the surplus data, however, is not clear. In a study of prostate carcinoma patients, comparing WBMRI to MRI of the axial skeleton (AS-MRI covering the cervicothoracic and lumbosacral spine as well as the pelvis and proximal femora), peripherally located metastases visible at WBMRI were only present in patients who also harbored metastases in the axial skeleton [45]. In our experience, isolated peripheral metastases confined to the bone marrow are extremely unusual; rarely, intracortical bone metastases may be observed in the periphery without involvement of the axial skeleton.
Although MRI is very sensitive in detecting skeletal metastases even of small size, its ability to differentiate them from other malignant bone marrow lesions or to diagnose the neoplasm of origin is more limited. Bone metastases are quite similar in appearance with foci of multiple myeloma, both of which affect mainly the elderly population. When bone metastases occur close to the endplates, the differential diagnosis may also include Modic I degenerative endplate changes and spondylodiscitis. Modic I changes display signal intensity similar to metastases (low on T1-weighted and high on T2-weighted images), but they are typically located along the vertebral endplates on both sides of a degenerated disc. However, occasionally, they may be more focal and unilateral and difficult to distinguish from a metastatic lesion. On high b-value DWI, Modic I changes show either no high signal or linear high signal at the interface of normal with abnormal marrow (referred to as the claw sign), while osseous changes related to metastases and spondylodiscitis both show increased signal intensity (Figs. 5.28, 5.29, and 5.30) [46, 47]. Spondylodiscitis is additionally characterized by T2 hyperintensity and contrast enhancement of the intervertebral disc; osseous, intradiscal, or soft-tissue abscesses, when present, are pathognomonic of infection.
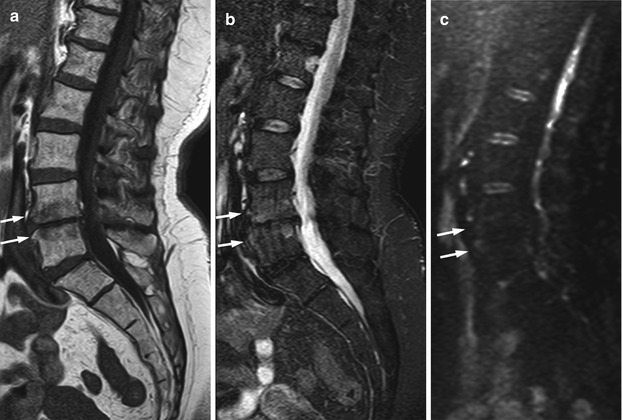
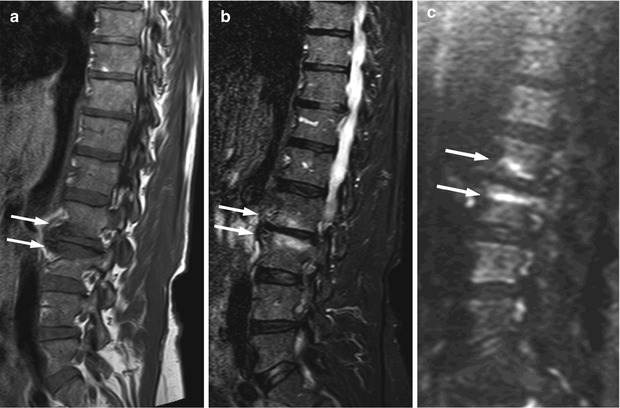
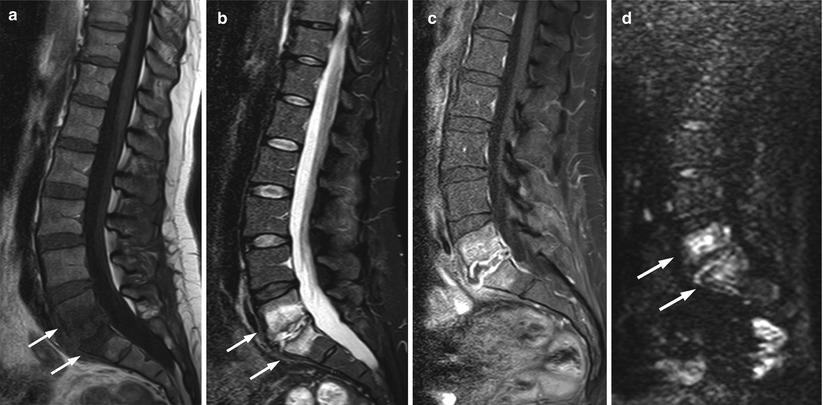
Fig. 5.28
Modic I degenerative endplate changes: absence of high signal on diffusion-weighted imaging.
Sagittal T1-weighted (a), STIR (b), and diffusion-weighted b-value 500 (c) images of the lumbosacral spine of a 68-year-old woman with Modic I degenerative endplate changes at L4–L5 (arrows). Degenerative changes are hypointense on the T1-weighted image and mildly hyperintense on STIR; they appear hypointense on the diffusion-weighted image
Fig. 5.29
Modic I degenerative endplate changes: claw sign on diffusion-weighted imaging.
Sagittal T1-weighted (a), STIR (b), and diffusion-weighted b-value 750 (c) images of the lumbosacral spine of a 65-year-old woman with Modic I degenerative endplate changes at L2–L3. Degenerative changes are hypointense on the T1-weighted image and hyperintense on STIR (arrows). On the diffusion-weighted image, linear hyperintensity is seen at the interface of normal and abnormal marrow (claw sign) (arrows)
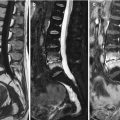
Fig. 5.30
Spondylodiscitis: high signal on diffusion-weighted imaging.
Sagittal T1-weighted (a), STIR (b), contrast-enhanced fat-suppressed (c), and diffusion-weighted b-value 500 (d) images of the lumbosacral spine of a 44-year-old woman with L5–S1 spondylodiscitis following surgery for prolapse of the pelvic organs. Inflammatory changes of L5 and S1 are hypointense on the T1-weighted image (a, arrows), hyperintense on STIR (b, arrows), and show marked contrast enhancement (c). Also noted on c is marked peripheral enhancement of the L5–S1 intervertebral disc in keeping with intradiscal abscess. On the diffusion-weighted image, there is pronounced hyperintensity of the marrow changes (d, arrows)
5.3 Multiple Myeloma: Focal Pattern
5.3.1 Clinical Background
Multiple myeloma is a hematologic malignancy caused by proliferation of a single clone of plasma cells in the bone marrow. It affects 5–6/100,000 individuals/year and accounts for 13 % of hematologic malignancies and 1 % of all cancers. Median age at presentation is 70 years, and men are affected slightly more often than women [48–50].
Multiple myeloma is characterized by the presence of ≥10 % abnormal plasma cells in the bone marrow and ≥3 g/100 ml serum monoclonal protein (with or without the presence of monoclonal protein in the urine). The presence or absence of end-organ dysfunction manifesting with hypercalcemia, renal insufficiency, anemia, or bone lesions (referred collectively by the acronym CRAB) classifies myeloma as symptomatic or asymptomatic (smoldering) disease.
A monoclonal gammopathy of uncertain significance (MGUS) is an asymptomatic, premalignant proliferation of monoclonal plasma cells (<10 % plasma cells in the bone marrow and <3 g/100 ml monoclonal protein in the serum) which is believed to precede the development of multiple myeloma with an annual risk of about 1 % [51]. A monoclonal gammopathy of borderline significance (MGBS) differs from MGUS in the percentage of bone marrow plasmacytosis (10–30 %). Plasma cell disorders are believed to form a continuum, progressing from MGUS to asymptomatic myeloma, and eventually to symptomatic multiple myeloma [52].
Key Points
Multiple myeloma is a hematologic malignancy caused by proliferation of a single clone of plasma cells in the bone marrow
It is believed to evolve from a premalignant monoclonal gammopathy
The biology of multiple myeloma is complex because of the various genetic abnormalities of plasma cells [50]. These abnormal cells interact with the microenvironment of the bone marrow and cause both neoplastic cell proliferation and bone resorption. Myeloma cells initially attach to bone marrow cells and extracellular matrix proteins. Through a series of events, mediated by the release of various cytokines and growth factors, tumor growth and angiogenesis is induced and the balance between osteoblast and osteoclast formation is disrupted. The bone marrow microenvironment itself actually plays an active role, assisting neoplastic proliferation [53].
Key Point
The bone marrow microenvironment actively supports the growth of neoplastic plasma cellsRelated posts:

Stay updated, free articles. Join our Telegram channel

Full access? Get Clinical Tree