Axial precontrast, non-fat-suppressed T1WI through the cerebellum.
Axial postcontrast, fat-suppressed T1WI through the same level.
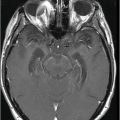
Axial DWI through the same level.
Brain Metastases from Mucin-Producing Primary
Primary Diagnosis
Brain metastases from mucin-producing primary
Differential Diagnoses
Metastasis from other primary malignancies
Brain abscess
Multifocal glioblastoma (GBM)
Imaging Findings
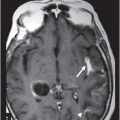
Fig. 102.1: Axial precontrast, non-fat-suppressed T1WI through the cerebellum demonstrated a large, right cerebellar mass that is heterogeneously hyperintense on T1WI sequence, predominantly at the posterior aspect of the mass. Fig. 102.2: Axial fat-suppressed T2WI through the same level demonstrated that the mass has an extremely heterogeneous T2 signal appearance. In particular, the posterior aspect of the mass is heterogeneously hypointense. Fig. 102.3: Axial postcontrast, fat-suppressed T1WI through the same level demonstrates non-suppression of the high T1 signal, as evidenced on the precontrast images. In addition, there is heterogeneous enhancement of the remainder of the mass and another tiny, nodular, enhancing lesion immediately adjacent to the larger mass. Fig. 102.4: Coronal GRE image through the mass does not demonstrate any area of hemorrhage within the T1 hyperintense or T2 hypointense area of the tumor. Fig. 102.5: Axial DWI through the same level does not demonstrate increased signal within the mass. Apparent diffusion coefficient map (not shown) did not demonstrate low value either to suggest diffusion restriction.
Stay updated, free articles. Join our Telegram channel

Full access? Get Clinical Tree


