Sagittal precontrast T1WI sequence.
Axial GRE image through the lesion.
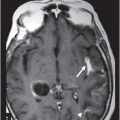
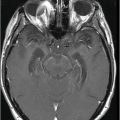
Axial postcontrast T1WI sequence through the lesion.
Intra-axial CNS Dermoid Cyst
Primary Diagnosis
Intra-axial CNS dermoid cyst
Differential Diagnoses
Epidermoid cyst
Oligodendroglioma
Lipoma
Imaging Findings
Fig. 103.1: Sagittal precontrast T1WI demonstrated a T1 heterogeneous mass involving the supramarginal gyrus and posterior aspect of the superior temporal gyrus. There were a few areas of T1 hyperintensity, matching the intensity of the subcutaneous fat. Fig. 103.2: Axial T2WI through the lesion demonstrated a thick-walled, unilateral, intra-axial lesion that demonstrated heterogeneous T2 hyperintensity. There was no mass effect to the adjacent brain tissue or abnormal T2 signal in the peritumoral area. Fig. 103.3 Axial GRE image through the lesion demonstrated a few linear areas of susceptibility-related signal drop within the core of the lesion corresponding to calcifications seen on the CT scan (not shown). Fig. 103.4: ADC map through the lesion demonstrated that most of the lesion has low ADC values, even lower than the adjacent white matter. Fig. 103.5: Postcontrast axial T1WI sequence through the lesion demonstrated heterogeneous signal within the lesion with no enhancement. Peripheral foci of T1 hyperintensity were noted in the anterolateral aspect.
Discussion
A benign-appearing intracranial mass containing both lipid and calcification is suggestive of a dermal inclusion cyst. Although diffusion restriction is characteristic in epidermoid cysts, diffusion restriction due to decreased water content has been described in intraparenchymal dermoid cysts (DCs). Epidermoid cysts typically demonstrate CSF intensity on T1-weighted sequences and do not demonstrate any fat or calcification. Although speckled calcification can be seen in lipomas, the entire tumor usually shows a homogeneously bright signal on the T1-weighted sequence, rather than a heterogeneously low signal, as seen in this tumor.
Oligodendrogliomas may be low attenuating, but never demonstrate fat attenuation. In addition, oligodendrogliomas may demonstrate enhancement with contrast.
Dermoid cysts arise from the inclusion of ectodermal cells during neural tube closure, around the fifth week of embryogenesis. They are rare lesions and account for approximately 0.5% of all intracranial tumors. As the dermal cell-line produces hair and secretions from glandular components, DCs enlarge slowly over time. Most of the intracranial DCs are extra-axial and most commonly located in the suprasellar cistern, followed by the posterior fossa, frontonasal area, and occipital lobes. Posterior fossa lesions are frequently associated with the dermal sinus and may be complicated with recurrent meningitis.
A thick capsule of stratified squamous epithelium demarcates DC from normal brain tissue. Sebaceous material, hair follicles, keratin debris, and hair can be seen at the core of the cystic lesion. The presence of keratin debris may explain diffusion restriction seen in some DCs. Lipid and cholesterol can be seen and produce T1 hyperintensity. As the outer DC layer is composed of squamous epithelium, rarely DCs may be complicated by presence of squamous cell carcinomas.
Although DCs are usually asymptomatic, large lesions can present with headache. Rupture of the DC is common because of the relentless production of material from the different dermal elements. Rupture of the DCs induces chemical meningitis, a neurologic emergency. In the case of rupture, patients present with severe headache, seizures, and vasospasm. In severe cases, there may be infarction and even death.
The fat-mixed contents of DCs typically demonstrate a low signal on CT scans. Calcification can be seen in up to 50% of cases and is usually peripheral, but inter-tumor calcification can be seen as well. If ruptured, fat droplets are usually seen in the subarachnoid space and non-dependent portion of the ventricles, mainly in the frontal horns, and in the anterior temporal horns. Spin echo T2-weighted sequence demonstrates chemical shift artifact at the fat-non-fat interface in the frequency-encoding direction. On the fast spin echo sequence, DCs are usually hyperintense and calcific foci may appear as blooming artifacts in GRE sequence. Typically, DCs do not enhance with contrast. However, ruptured DCs may demonstrate intense peripheral enhancement due to severe inflammatory response. Spectroscopy may demonstrate a lipid peak.
Stay updated, free articles. Join our Telegram channel

Full access? Get Clinical Tree


