11 Metabolic Imaging: MR Spectroscopy
11.1 Introduction
Magnetic resonance spectroscopy (MRS) allows noninvasive detection and measurement of clinically relevant metabolites in the brain and has the potential to play an important role in the diagnostic workup of brain lesions in children and adults. In recent years MRS has also shown to provide additional information for treatment planning and monitoring treatment response, particularly in patients with brain tumors. This chapter presents the methodological concept of performing and evaluating MRS in the context of brain tumors as well as the limitations of the technique. The chapter is focused on the use of MRS as a complement to conventional MR imaging (MRI) in daily clinical practice and not as a scientific research tool.
11.2 Metabolites
A large number of reviews and original articles elucidate the function and physical properties of metabolites detected with MRS. 1 Table 11.1 summarizes the major neurometabolites of interest for clinical brain tumor evaluation (N-acetyl aspartate [NAA], choline [Cho], creatine [Cr], myoinositol, lactate, and lipids). The chapter discusses a variety of resonances, which, due to their low concentration in normal brain tissue, broad resonance frequencies, or spectral overlaps, are usually more difficult to detect or quantify unless they are clearly increased (e.g., glutamine [Gln] and glutamate [Glu], and a variety of amino acids).
Metabolite | Main components contributing to the signal | Resonance frequency | Main functions | Main occurrence |
NAA | N-acetylaspartate (NAA), N-acetylaspartylglutamate (NAAG) | 2.02 parts per million (ppm) | Marker for neuronal integrity and function, osmolyte, metabolic precursor | Neurons |
Cr | Creatine (Cr), phosphocreatine (PCr) | 3.02 ppm | Marker of energy metabolism | All types of cells |
Cho | Choline (Cho), phosphorylcholine (PC), glycerophosphorylcholine (GPC) | 3.2 ppm | Marker for cell membrane turnover | All types of cells |
mI | Myoinositol | 3.56 ppm | Glial marker, osmolyte | Glia cells/myelin breakdown product |
Lac | Lactate (Lac) | Doublet peak at 1.33 ppm | Very low detectable concentrations in normal tissue | Pathologically altered cells and cerebrospinal fluid |
Lip | Lipids | 0.9–1.3 ppm | Membrane marker | All types of cells |
Note: Although NAA, Cr, and Cho are seen in both short (20–35 ms), intermediate (144 ms), and long (288 ms) TE (echo time) spectra, mI is seen only in short TE spectra. Lactate and lipid concentrations are low or not detectable in normal brain tissue unless the latter appear due to contamination artifacts from the scalp due to inappropriate voxel positioning. | ||||
11.3 Methodology
11.3.1 Data Acquisition
MRS physics have been described extensively in several textbooks, 2 and only some basics need to be discussed here for the understanding of methodological challenges related to the clinical interpretation of data acquired. MRS can be performed using several nuclei (C13, F19, Na23, P31), however the hydrogen nucleus (H1) is by far the most used in clinical MRS. H1 has a high abundance within multiple neurometabolites and most clinical scanners mainly operate at its resonance frequency. This allows the combination of MRS with morphological MRI and other functional MR techniques in the clinical setting, which is a prerequisite for successful clinical MRS examinations.
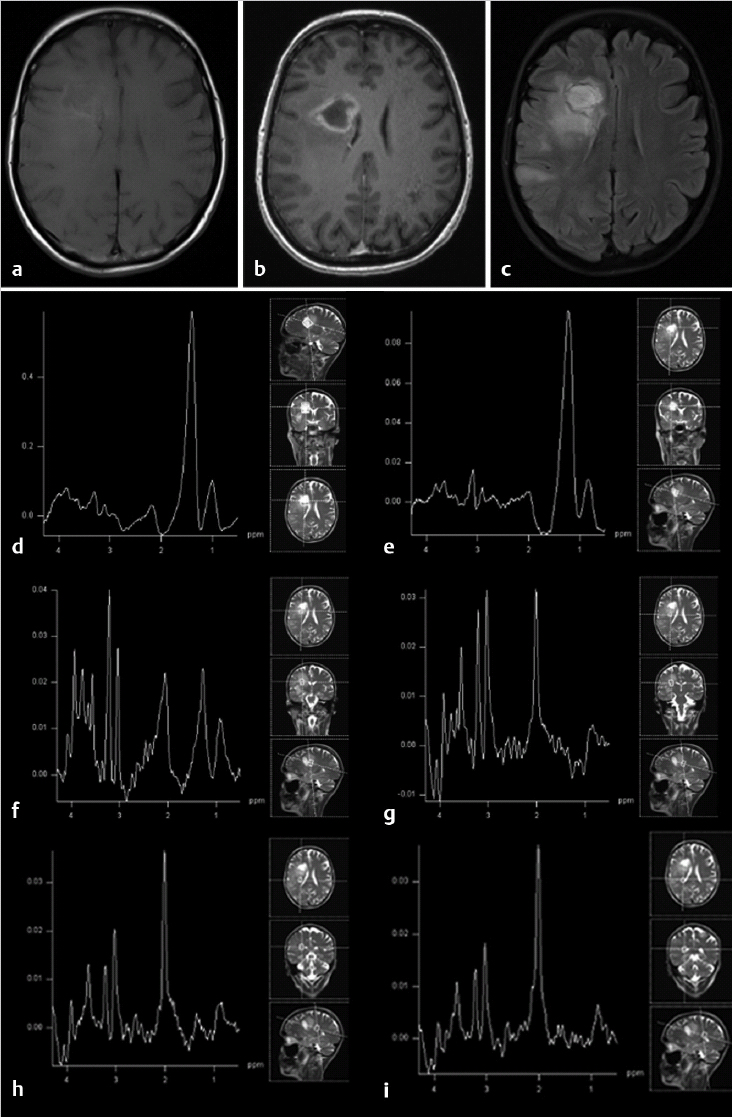
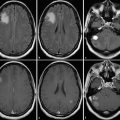
Based on morphological reference images (Fig. 11.1) a volume of interest is chosen for the MRS examination. A single voxel (single voxel spectroscopy [SVS]) with a usual voxel size of 3 to 8 cm3 is preferably used to characterize the metabolic profile of a rather homogeneous solid or cystic part in a tumor (Fig. 11.1b,c), whereas multiple smaller voxels (multivoxel MRS or chemical shift imaging [CSI]) in one or several slices (single-slice two-dimensional chemical shift imaging [2D CSI]; multislice three-dimensional CSI [3D CSI]) are used to characterize the metabolic profile over different parts of a heterogeneous tumor and/or surrounding tissue (Fig. 11.1d–f). In this context it is important to emphasize the need to review conventional MR images prior to voxel/region of interest (ROI) positioning to define the area of the lesion that is most interesting for MRS and relevant for the clinical question to be answered. The defined area might not necessarily coincide with the area technically most accessible for MRS. Compared to the wide variety of available sequences and parameters in MRI the choice of MRS sequences can be standardized regarding sequence type and acquisition parameters in a very robust way to allow for comparable data not only within one patient but within larger clinical populations (Table 11.2). Short echo times allow for evaluation of metabolites with short relaxation times (e.g., myoinositol). Intermediate echo times are used to more clearly depict lactate because the resonance inverts in the spectrum and points below the baseline, and to assure lesser relaxation effects on the main metabolites NAA, Cho, and Cr compared to long echo times. Use of the latter usually generates spectra of high quality, however, including a more limited number of metabolites compared to short echo time spectra.

MRS technique | SVS | CSI |
Voxel sizea | 3–8 cm3 | 1–1.5 cm3 |
Number of acquired spectra | 1 | 4–100 depending on region of interest size |
Repetition time (TR) (ms) | 1,500–2,000 | |
Echo time (TE) (ms) | Short (20–35) Intermediate (135–144)b Long (270–288)b | |
Number of excitations | 96–128 | 1–2 |
Acquisition methodc | PRESS or STEAM | |
aThe voxel size in SVS is determined by the width of the slice selection pulses and in CSI by the field of view (e.g., 16 × 16 cm) and the number of phase-encoding steps (e.g., 16 × 16) in combination with the slice thickness (e.g., 1.5 cm). The number of acquired spectra in CSI depends on the size of the region of interest (ROI; 2 × 2 to 10 × 10 cm) in combination with the voxel size above. bEcho time (TE) of 135 or 270 ms is usually used on 1.5 T systems and 144 and 288 ms on 3 T systems. cAlthough stimulated echo acquisition mode (STEAM) earlier was often preferred, especially for SVS because it allowed for more precise slice selection and usage of shorter TE, point resolved spectroscopy (PRESS) is now the clinical method of choice because earlier technical problems have been overcome, and the method allows for twice the signal-to-noise ratio compared to STEAM. | ||
11.3.2 Data Postprocessing
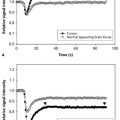
Acquired MRS raw data need to be postprocessed with software provided by the manufacturers or with postprocessing tools such as LCModel (LCMODEL, Inc. Oakville, Ontario, Canada). 3 For clinical examination in brain tumor patients, automated postprocessing with manufacturer-provided software is mainly sufficient and limited to a few steps: water reference processing, filtering, zero filling, Fourier transformation, frequency shift correction, baseline correction, phase correction, and curve fitting. Of these mainly phase correction might need some manual adjustment as illustrated in Fig. 11.1b. Generated spectra may be saved in Picture Archiving and Communication System (PACS) systems or made available for interpretation by other means. Using curve fitting tools the generated spectra may also include information on, for example, semiquantitative metabolite concentrations in arbitrary units, resonance position, and resonance assignment. Using automated curve fitting, the reader of the spectrum should make sure that, first, the fitted baseline coincides with the actual spectral baseline—because metabolites will otherwise be over- or underestimated—and that, second, the metabolite assignments are correct and there has been no frequency shift of metabolites. Voxel position should be illustrated to the reader of the spectrum with reference images (Fig. 11.1b–f). The area under a peak of the MR spectrum equals the signal intensity of the resonance and is proportional to the concentration of the metabolite within the voxel because it is a function of the number of nuclei contributing to the signal. However, besides the number of contributing nuclei the detected signal is influenced by many factors, such as J-coupling, relaxation times and thus pulse sequences and acquisition parameters, as well as spectral quality and artifacts. Strict rules need to be applied for spectral quality if absolute metabolite concentrations are calculated with methods employing referencing to internal signals (mainly brain water signal from the same voxel) or external signals (phantom). Furthermore, tissue inhomogeneity within the voxel—not only due to partial volume effects of, for example, cerebrospinal fluid (CSF), but also tumor inhomogeneities—needs to be taken into account. A more robust and clinically often more feasible method of data interpretation is a semiquantitative approach with calculation or visual appreciation of metabolite ratios. Either ratios normalizing the individual metabolites to the creatine signal (e.g., NAA:Cr) are used or the metabolites are directly compared to each other (e.g., NAA:Cho). This also allows the use of spectra with lower spectral quality for clinical evaluation (Fig. 11.2). When looking at an isolated voxel metabolite ratio, such as Cho:NAA, the problem arises of not knowing whether the abnormality causing an observed spectral change is in the numerator or in the denominator. Therefore, in multivoxel MRS, further tissue characterization might be achieved when the tumor signals are expressed in the contralateral normal brain tissue metabolite signals (e.g., tumor Cho to Cho from normal-appearing contralateral brain tissue). A drawback of this method, however, is the risk that general signal decrease due to edema, tissue necrosis, or artifacts might lead to an underestimation of a possible peak increase compared to the other metabolites in the same voxel.

11.3.3 Data Interpretation
Radiologists are trained to take confounding artifacts into account when interpreting MR images, and the awareness of interpretation pitfalls related to image artifacts is usually high. Artifacts affecting MR spectra are generally less well known but are well described and illustrated by Kreis. 4 As a first step in the clinical interpretation the spectral quality should be evaluated. Subsequently, voxel position should be related to morphological findings to establish the clinical question to be answered with the spectra from each voxel. Spectra acquired from outside the periphery or the center of a lesion need to be looked upon in different ways: while the tumor center primarily might be of interest for tumor differential diagnosis or grading, tumor periphery and surrounding tissue are often evaluated for tumor infiltration or as reference areas. When evaluating the spectral patterns the reader needs to keep in mind spectral changes in metabolite concentrations related to age, which is primarily of interest in neonates and infants, who show increasing NAA concentrations parallel to decreasing choline concentrations with increasing age. The following spectral changes are common in brain tumor MRS (Fig. 11.3): (1) decrease of NAA as a marker for a decreased number of neurons or neuronal function per volume as seen not only in the tumor itself but also in the surrounding edema; (2) increase of choline as a marker of increased cell membrane turnover, which might reflect tumor growth, tumor necrosis, or gliosis; (3) increase of lactate and or lipids mainly as a marker of tumor necrosis, which is not only related to treatment response but is also a natural feature in viable tumor with energy requirements exceeding energy supply; and (4) decrease of all metabolites as a marker of general cell destruction and general decrease of molecules contributing to the spectrum.
11.4 Limitations
Despite MRS being used in the workup of brain tumors there are still several important limitations associated with the clinical use of proton MRS for brain tumor imaging. MRS data processing is time consuming and user dependent, or it might require third party postprocessing tools. Regardless of which technique is used the size of the MRS voxel is limited, thus the total tumor volume might not be evaluated and heterogeneous parts of a tumor might contribute to a single spectrum leading to partial volume effects, which are difficult to interpret. The location of the lesion and components like calcification and hemorrhage might cause artifacts and provide limited spectral quality. Further, there is no obvious single spectral pattern that correlates with tumor histopathology, and nonspecific spectral findings as described earlier are common. Still, despite a considerable volume of research in the field, no consensus exists regarding the use of normalized versus nonnormalized ratios or quantitative data, the specificity and sensitivity of the method, or the true value of the method in clinical decision making. The ultimate clinically oriented scientific paper on the use of MRS in brain tumor diagnosis is yet to be written.
11.5 Clinical Applications
Despite some controversy the clinical potential for MRS in brain tumor workup is well documented. MRS has been shown to be a valuable additional tool along with conventional imaging and other advanced MR techniques for grading brain tumors, differentiating brain lesions, and differentiating recurrent tumor and radiation injury. MRS has also demonstrated its value as an imaging-guiding tool for surgical brain biopsy. The focus here is on the metabolic changes relevant for tumor grading, tumor characterization prior to treatment, and differentiation of radiation injury and necrosis from recurrent tumor. Furthermore spectral patterns of primary pediatric and adult intracranial tumors and secondary tumors are presented, and the findings in some common differential diagnoses are described.
11.5.1 Tumor Grading
Conventional MRI is limited in its ability to reliably grade gliomas. Contrast enhancement on postcontrast T1-weighted images is one of the most common methods for assessing glioma grade. However, malignancy often extends beyond contrast enhancement, and some tumors graded as World Health Organization (WHO) grade III or IV might not always present with contrast enhancement as well as low grade tumors might. 5 Some studies suggest that the choline signal in gliomas and peritumoral regions is able to distinguish regions with tumor infiltration from nontumor tissue, but it may not be a surrogate marker for the pathological grade of a tumor. 6 , 7 , 8 A common MRS finding in malignant gliomas is increased choline and decreased NAA and creatine concentrations compared with normal brain tissue. It is clear that the contrast enhancement does not necessarily correspond to the regions of high choline concentration because elevated choline levels have been found beyond the contrast-enhancing tumor area or, in cases of no enhancement, in areas with hyperintense signal on T2-weighted and fluid-attenuation inversion recovery (FLAIR) images representing tumor. 7 , 9 , 10 , 11 Indication of malignant transformation and early progression of initial low-grade gliomas is the increase in the creatine concentration and progressive decrease in NAA and myoinositol concentrations and increased choline concentration. 12 Significantly increased Cho:Cr and Cho:NAA ratios are usually seen in high-grade tumors compared to less increased Cho:Cr or decreased NAA:Cr in low-grade tumors compared to normal brain tissue. Fig. 11.4 illustrates a WHO grade III oligodendroglioma with highly increased Cho and decreased NAA. In comparison a WHO grade IV glioblastoma multiforme demonstrates almost complete absence of NAA in the contrast-enhancing periphery of the necrotic tumor and elevated Cho (Fig. 11.5f,g).


Several MRS studies have demonstrated significantly higher Cho:Cr and Cho:NAA ratios in high-grade than in low-grade glioma (p < 0.001), 13 , 14 whereas the NAA:Cr ratios were significantly lower in high-grade than in low-grade glioma (p < 0.001). 13 Using a threshold for Cho:Cr of 2.04 resulted in sensitivity, specificity, positive predicted value (PPV), and negative predicted value (NPV) of 84%, 83.33%, 91.3% and 71.43%, respectively. 13 A threshold value of 2.2 for the Cho:NAA ratio resulted in sensitivity, specificity, PPV, and NPV of 88%, 66.67%, 84.62%, and 72.73%, respectively. 13 The presence of lipid or lactate on MRS is highly suggestive of higher-grade malignant gliomas mainly seen in grade IV gliomas but not correlated to the degree of tumor infiltration. 8 , 9 Paradoxically malignant MR spectra can be present in pilocytic astrocytoma because lactate is frequently elevated in this type of tumor. 15 Other metabolites like glycine (Gly) and myoinositol (Myo) might be present in high-grade or low-grade tumors, respectively. A recent study demonstrated that glycine levels were significantly elevated in glioblastoma multiforme (GBM), low-grade astrocytoma, and metastases and significantly higher in GBM than low-grade astrocytomas. 16 The same study demonstrated that the myoinositol levels were elevated in low-grade astrocytoma and metastases and reduced in meningioma and GBM. 16 In addition they found that the Gly:Myo ratio did distinguish GBM from metastases and low-grade astrocytomas, suggesting that Gly might be a useful biomarker for tumor characterization. 16
Related posts:
Stay updated, free articles. Join our Telegram channel

Full access? Get Clinical Tree


