- Biological effects of planar X-ray imaging
- Biological effects of fluoroscopic imaging
- Biological effects of mammographic imaging
- Biological effects of computed tomographic imaging
- Equipment and techniques to acquire diagnostic X-ray images
Diagnostic Procedures
Almost all medical imaging procedures come from one of the six major diagnostic procedures: planar, fluoroscopic, computed tomographic, mammographic, magnetic resonance, or ultrasound imaging. The first four modalities use X-rays, magnetic resonance imaging uses radio frequency radiation, and ultrasound imaging uses high-frequency sound waves. Only procedures using X-rays are covered in this chapter.
Medical diagnostic procedures expose more people to radiation than any other source of man-made radiation. In the United States, almost half (48%) of the population exposure is from diagnostic X-ray procedures. The frequency and amount of radiation the population gets from medical exposure increases with patient age.
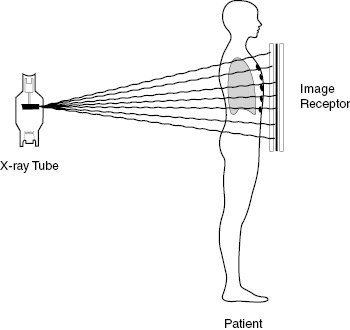
The geometry of the four X-ray modalities is similar. A radiation source outside the patient sends X-rays through the patient to an image receptor on the other side of the patient’s body. The transmitted radiation is detected, converted into a digital image, and presented on a video monitor. Less than 2% of the incident radiation reaches the detector on the exit side of the patient. The majority of the remaining 98% is absorbed in the patient where it may produce biological effects.
Figure 12.1 presents a schematic view of the planar image geometry where the X-rays pass through the patient and are detected in an image receptor on the exit side of the patient.
The dose to a particular patient depends on many factors including type of procedure, patient thickness, size of the X-ray beam, distance to the patient’s skin, and technique factors used to make the exposure. Although determining the dose received by a specific patient requires detailed and complex calculations, it is possible to provide general values for various procedures for average-sized patients. Table 12.1 shows typical patient doses for several common radiographic procedures. The patient dose can vary by as much as a factor of 2 or 3 from these values. The table has two dose columns. The first column gives the typical entrance dose in mGy, and the second column gives the effective whole body dose in mSv. Recall that the effective dose is the whole body dose that would produce the same biological effect as the actual dose from the examination. The entrance dose is a close approximation to the maximum dose at the skin. Organ doses below the skin will be less. For diagnostic energies, the dose at the patient’s midline is only about 10% of the maximum.
Table 12.1 List of Selected Diagnostic X-ray Examinations Showing Typical Entrance Skin Doses and Whole Body Effective Doses
| Examination | Entrance Dose | Effective Dose |
|---|---|---|
| mGy | mSv | |
| Abdomen | 3 | 1 |
| Chest | 0.4 | 0.1 |
| Head | 1 | 0.1 |
| Pelvis | 3 | 2 |
| Mammography | 2 | 0.1 |
| Spine | 2 | 1 |
| Dental | 3 | 0.005 |
Fluoroscopy
Fluoroscopy is used to observe and record moving anatomy with the X-ray tube located on one side of the patient and the detector on the opposite side. Fluoroscopy is often used in cardiology and radiology to place catheters or stents in the patient. Sometimes, these procedures are difficult and require a great deal of time. In these cases, the patient may receive a large dose of radiation. Recall the patient receives the highest dose on the entrance side of the beam and that is often the posterior side of the patient.
Figure 12.2 shows a schematic diagram of a fluoroscopy system and a picture of fluoroscopic unit. The X-ray tube is located beneath the patient and the imaging device is above the patient. When using fluoroscopy units, which can be oriented horizontally, the operator should stand on the side opposite the X-ray tube. This is because the X-ray beam scatters both forward and backward. Standing opposite the X-ray tube allows the forward scattered X-rays to be attenuated in the patient before striking the operator.
Figure 12.2 (a) The image on the left shows a schematic diagram of fluoroscopy equipment showing the patient on the table. (b) The figure shows a C-arm fluoroscopy room used for interventional radiology or cardiology procedures.
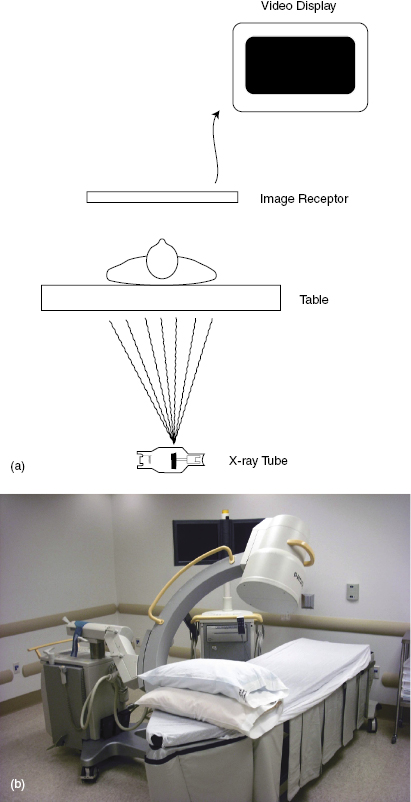
The patient receives the primary dose, and greater than 98% of the radiation is absorbed or scattered in the patient. This scattered radiation is the greatest source of radiation dose that the operator receives during the fluoroscopy procedure. During fluoroscopy procedures, all individuals in the room must be wearing protective shielding. Protection reduces the operator dose to less than 10% of the scatter dose. During fluoroscopy, the X-ray beam is strictly collimated to pass through the patient and strike the image receptor.
The greatest source of radiation to the operator and staff during fluoroscopy is scattered from the patient. Stepping back from the patient reduces the scatter dose significantly. One step backward (from 1 to 2 m from the patient) reduces the scattered dose by about a factor of 4. A rule of thumb is that 1/1000 (0.001) of the patient entrance dose is received by the operator at 1 m from the patient. Physicians specializing in interventional procedures are recommended to wear protective glasses.
Table 12.2 presents some typical entrance and effective doses from representative fluoroscopic examinations.
Table 12.2 Typical Fluoroscopy X-ray Exams Showing Typical Entrance Skin Doses and Whole Body Effective Doses
| Examination | Entrance Dose | Effective Dose |
|---|---|---|
| mGy | mSv | |
| Upper GI | 6 | |
| Barium enema | 60 | 8 |
| IVP | 4 | 2 |
| Cardiac CTA | 16 | |
| Interventional head | 5 |
GI, gastrointestinal; IVP, intravenous pyelogram; CTA, CT angiogram.
Mammography
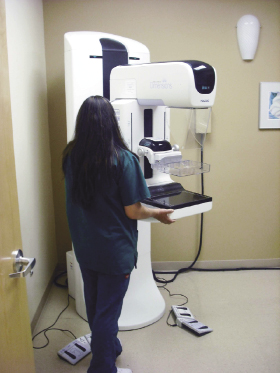
The breast is thinner than most other parts of the body and is relatively uniform and composed primarily of soft tissue. Mammographic examinations must detect small, submillimeter, higher-density calcium deposits and also larger cysts and cancers having almost the same density as normal breast tissue. To accomplish this difficult task, a specially designed unit is used to optimize the image with minimum dose. Figure 12.3 shows a picture of a mammography unit.
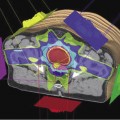
The mammography unit produces high-quality images that can show the difference between normal and cancerous tissues. Figure 12.4 illustrates a mammogram of a normal breast and one with a breast cancer.
Figure 12.4 Two mammographic images. (a) Image of a normal breast mammogram; (b) image of a patient with a breast cancer.

During the mammographic examination, the breast is compressed to create a thinner, more uniform object. Lower-energy radiation is used because less penetration is needed. The mammography unit is designed to image the entire breast up to the chest wall. Mammographic doses are regulated by the U.S. Food and Drug Authority (FDA). Every mammographic facility must be accredited by the FDA before it can legally take mammograms. FDA regulations set maximum dose for a single image at 3 mGy. This is considerably higher than the 1–1.5 mGy used in most digital mammographic units. In a typical mammography screening exam, each breast is imaged twice. One image is in the cranial–caudal (CC) direction and the other is in the medial–lateral oblique (MLO) direction. In a screening mammographic examination, each breast should receive less than 2–3 mGy.
Related posts:


Stay updated, free articles. Join our Telegram channel

Full access? Get Clinical Tree


