Proton magnetic resonance spectroscopy ( 1 H-MRS) is an unconventional technique that allows noninvasive characterization of metabolic abnormalities in the central nervous system. 1 H-MRS provides important insights into the chemical-pathologic changes that occur in patients with multiple sclerosis (MS). In this review article we present the main brain and spinal cord 1 H-MRS features in MS, their diagnostic value in differentiating pseudotumoral demyelinating lesions from primary brain tumors, and their relationship with clinical variables. Last, some data related to the use of 1 H-MRS in therapeutic trials is presented.
Key points
- •
Proton magnetic resonance spectroscopy ( 1 H-MRS) is a useful technique to understand the pathophysiological changes, namely neurodegeneration and demyelination, which occur both in lesions and in normal-appearing tissue in multiple sclerosis.
- •
1 H-MRS could provide useful diagnostic information to MR imaging for distinguishing pseudotumoral demyelinating lesions from tumors.
- •
N -acetylaspartate is the metabolite that most consistently correlates with irreversible disability in patients with multiple sclerosis, supporting its use as a surrogate marker of neuroaxonal dysfunction in research studies.
- •
The available evidence does not support the use of 1 H-MRS as a marker of disease severity or progression in clinical practice.
Introduction
Multiple sclerosis (MS) is a chronic, persistent inflammatory-demyelinating disease of the central nervous system (CNS), characterized pathologically by areas of inflammation, demyelination, axonal loss, and gliosis scattered throughout the CNS with a predilection for the optic nerves, brainstem, spinal cord, and cerebellum, as well as the cerebral periventricular white matter, although cortical and subcortical gray matter damage is also prominent. Conventional magnetic resonance (cMR) imaging techniques, such as T2-weighted sequences and gadolinium-enhanced T1-weighted sequences, are highly sensitive for detecting MS plaques and can provide quantitative assessment of inflammatory activity and lesion load. These conventional MR imaging–derived metrics have become established as the most important paraclinical tool in the diagnosis of MS, and contribute to understanding the natural history of the disease and monitoring the efficacy of disease-modifying treatments. However, the correlation between the extent of lesions observed on cMR imaging and the clinical manifestations of the disease is weak and underlines the fact that these techniques do not suffice to explain the entire spectrum of the disease process. This clinical-radiological paradox may be partially explained by several limitations of cMR imaging: (1) limited specificity for the various pathologic substrates of MS, which contribute differently to the development of permanent disability; (2) inability to quantify the extent of damage in normal-appearing white matter; (3) inability to detect and quantify the extent of gray matter damage; (4) variability in the clinical expression of MS plaques in different anatomic locations (eg, the spinal cord and optic nerve); and (5) inability to assess the effectiveness of reparative mechanisms in MS, such as cortical adaptive reorganization.
Over the past years, the MR research community has dedicated enormous effort to overcoming these limitations by applying new techniques, such as quantitative analysis of brain volume (global and regional), magnetization transfer ratio, diffusion-tensor imaging, proton MR spectroscopy, and functional MR imaging, which can reveal the underlying substrate of intrinsic pathology, monitor the neurodegenerative and reparative mechanisms of the disease, and assess the effects of experimental treatments.
Proton MR spectroscopy ( 1 H-MRS) is the first nonconventional MR technique used in MS and has proved to be particularly informative by revealing metabolic abnormalities related to the 2 primary pathologic processes of the disease. These are active inflammatory demyelination and neuronal/axonal injury in both T2-visible lesions and in brain regions that are not associated with evident structural abnormalities on cMR imaging, the so-called normal-appearing brain tissue (NABT). However, the high technical demands of 1 H-MRS have generally limited its use in research studies, and currently available data do not suffice to support its use as a biomarker of the neurodegenerative process of MS in clinical practice.
The aim of this article is to review the main brain and spinal cord 1 H-MRS features in MS and other idiopathic inflammatory-demyelinating diseases, the potential diagnostic value of this technique in specific situations, and its use as a biomarker of the neurodegenerative component of these diseases.
Technical aspects of 1 H-MRS in MS
The first 2 articles of this issue are devoted to technical aspects of 1 H-MRS that should be considered for clinical use of this technique in various CNS disorders. Here, we present some additional data about technical aspects related to specific use of this method in patients with MS.
In MS, most 1 H-MRS examinations use the standard acquisition techniques provided by the manufacturers; that is, localized spin-echo or stimulated-echo pulse sequences with single-voxel or multivoxel mode. These standard pulse sequences provide metabolic information on predefined regions, and although they are useful for assessing metabolic changes in T2-visible lesions or specific NABT regions, they cannot provide overall metabolic information within the brain. To overcome this limitation, one proposal is to obtain localized spectra from a large volume of interest centered on the corpus callosum, including the superior lateral ventricular regions where axonal projections converge after traversing large volumes of white matter. The rationale of this approach is based on the concept that damaged axons undergo anterograde shrinkage and Wallerian degeneration; hence, decreases in the amino acid N -acetylaspartate (NAA), considered a marker of neuronal/axonal function and density, should reflect brain damage inside and outside this volume of interest. Studies using this approach have demonstrated that the metabolite ratios obtained from this volume are equivalent to and highly correlate with those obtained from a whole supratentorial volume. Another approach proposes the use of a nonlocalized pulse sequence to allow acquisition of a spectrum to study changes in the whole-brain NAA. Although whole-brain NAA seems a more sensitive indicator of disease progression than lesion load or atrophy, and it could be an optimal surrogate marker for the overall load of neuronal and axonal dysfunction and damage in the disease, some unresolved technical issues have prevented its use in clinical MR scanners.
1 H-MRS has an important limitation in terms of acquisition time and size of the volume of interest because of the low sensitivity of the technique. To obtain a useful spectrum in a reasonable time, the minimum volume of interest is typically about 1 cm, but most MS lesions are smaller, and this can lead to partial volume effects that should be taken into account when interpreting the results.
Absolute quantitation is highly desirable but not easy; therefore, relative quantitation is generally used in clinical practice. The most common relative method is the use of ratios between metabolites, with NAA usually expressed relative to creatine-phosphocreatine (Cr), assuming that this metabolite is kept constant. Although this approach may be dubious in MS, where the Cr concentration may not be unaffected by MS pathology, NAA/Cr ratio is a practical compromise to acquiring surrogate measures of neuroaxonal integrity.
1 H-MRS of the brain in MS
MS is one of the neurologic diseases in which 1 H-MRS has been most widely used. The first studies appeared in the early phases of clinical application of this technique at the beginning of the 1990s. MS is a diffuse, dynamic disease that evolves over time. Thus, to summarize the 1 H-MRS features of the brain in this condition, it is useful to divide the metabolic patterns into 2 groups: those observed in T2-visible lesions, including both active and chronic lesions, and those in NABT, which is known to be affected in MS. 1 H-MRS is particularly useful to provide evidence of neurodegeneration even from the earliest stages of the disease based on the resonance intensity of NAA, a marker of neuronal integrity, and other metabolites, such as choline-containing compounds (Cho) and myo-inositol (mIns), which are affected by damage and repair of non-neuronal brain cells.
1 H-MRS in Focal Brain Lesions: Acute and Chronic
The presence of CNS lesions disseminated in space and time is one of the main features of MS, and the aim of the first 1 H-MRS studies was characterization of MS lesions in their different stages ( Table 1 ). In general, acute inflammatory-demyelinating lesions, which usually enhance with contrast on T1-weighted images, show increases in Cho and lactate (Lac) resonances during the first 6 to 10 weeks following lesion development. Changes in the resonance intensity of Cho can be interpreted as a measure of membrane phospholipids released during active myelin breakdown, whereas Lac increases mainly seem to reflect the metabolism of inflammatory cells or neuronal mitochondrial dysfunction. The NAA pattern in the acute phase of lesion development is highly variable, ranging from almost no change with respect to normal brain tissue to significant decreases. Because NAA is detected almost exclusively in neurons in the healthy adult brain, decreases in this metabolite are interpreted as a measure of neuronal/axonal dysfunction or loss. This initial NAA decrease may persist over time, indicating irreversible neuroaxonal injury, or show partial recovery starting a few weeks after the onset of lesion development and continuing for several months. Few studies have focused on the changes occurring in other metabolites in the proton spectrum, and the results are sometimes contradictory. Of particular relevance in MS plaques is the behavior of Cr, a metabolite present in both neurons and glial cells, with higher concentrations in glia than neurons. Cr, which commonly remains stable, can show significant increases in some plaques, or decreases. These changes may be related to varying amounts of neuroaxonal loss, oligodendroglial loss, and astrocytic proliferation.
| Metabolite | Acute Stage | Evolution | Chronic |
|---|---|---|---|
| Macromolecules | ↑ | Tendency to ↓ | Not present |
| Lipid | ↑ | Tendency to ↓ | ↓ or not present |
| Lactate | ↑ | Tendency to ↓ | Not present |
| N -acetylaspartate | ↓ | Further ↓ partial ↑ | ↓ |
| Glutamic/glutamine | ↑ | Tendency to ↓ | |
| Creatine/phosphocreatine | ↓, stable or ↑ | Further ↑ partial ↓ | ↑ |
| Choline compounds | ↑ | Further ↑ partial ↓ | ↑ |
| Myo -inositol | ↑ | Remain or further ↑ | ↑ |
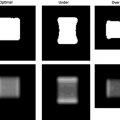
Short echo time spectra provide evidence of transient increases in visible lipids in some lesions, probably released during myelin breakdown. These lipid peaks have been identified in prelesional areas (areas of normal-appearing white matter [NAWM] that subsequently developed a plaque visible on MR imaging). A localized increase in Cho has also been described in areas of NAWM months before subsequent development of a plaque visible on MR imaging, consistent with focal prelesional myelin membrane disease. These observations suggest that demyelination can occur months before acute inflammatory changes become evident. Other nonconventional MR techniques, such as magnetization transfer imaging, diffusion, and dynamic susceptibility weighted sequences have also shown abnormalities in this prelesional stage, further supporting the presence of subtle progressive alterations in tissue integrity before focal leakage of the blood-brain barrier as part of plaque formation in MS. Increases have been reported in mIns, a proposed glial marker likely related to microglial proliferation, and in glutamate, which is consistent with active inflammatory infiltrates (large quantities of glutamate are produced and released by activated leucocytes, macrophages, and microglial cells). In addition, application of metabolite-nulling techniques that differentiate between macromolecular resonances and metabolites have shown elevated macromolecule resonances in the range of 0.9 to 1.3 ppm in acute lesions, whereas in chronic lesions, the values are similar to those of healthy controls. These macromolecules do not fit the spectral pattern of lipids, and may be interpreted as markers of myelin fragments ( Figs. 1 and 2 ).
Acute MS plaques usually evolve to chronic irreversible plaques (with varying degrees of neuronal/axonal loss) as inflammatory activity abates, edema resolves, and reparative mechanisms, such as remyelination, become active. These pathologic changes are reflected on cMR imaging, which usually shows cessation of contrast uptake after several weeks, associated with a T2 lesion size decrease. A percentage of active lesions become irreversibly hypointense on T1-weighted imaging (chronic black holes), which correlates pathologically with permanent demyelination and severe axonal loss. These pathologic changes also can be assessed using 1 H-MRS as changes in the spectral pattern of the lesions. Among the more generally recognized changes, there is a progressive return of Lac to normal levels within weeks, whereas Cho and lipids decrease for some months, but do not always return to normal values (see Fig. 2 ). A moderate increase in Cr may also be detected, likely resulting from gliosis and remyelination. NAA may further decrease, indicating progressive neuronal/axonal damage, or show partial recovery over several months without reaching normality. This recovery cannot be explained simply by resolution of edema and inflammation; other processes, such as increases in the diameter of previously shrunken axons secondary to remyelination, and reversible metabolic changes in neuronal mitochondria, also seem to have an important role (see Table 1 ).
1 H-MRS of NABT: White and Gray Matter
In addition to focal demyelinated plaques, diffuse global injury outside the focal MS lesions (in NABT) is also found in the brains of patients with MS. These abnormalities include diffuse astrocytic hyperplasia, patchy edema, and perivascular cellular infiltration, as well as axonal damage myelin loss and microscopic focal lesions. In vivo demonstration of this widespread abnormality has been achieved by several nonconventional MR techniques, such as magnetization transfer imaging (reduced magnetization transfer ratio), diffusion-weighted sequences (increased diffusivity and decreased fractional anisotropy), and 1 H-MRS, which reveals several abnormalities that are more pronounced in the progressive forms of the disease, but also can be detected in patients with clinically isolated syndromes, the earliest stage of possible MS.
The most consistent change reported is a decrease in NAA or in the NAA/Cr ratio within the NAWM, suggesting diffuse axonal loss or dysfunction. At least in the early phases of the relapsing forms of MS, when the inflammatory component of the disease predominates over the neurodegenerative component, this NAA decrease of 7% to 9% relative to healthy controls tends to recover from baseline, indicating that the neuronal/axonal injury is partially reversible. Increases in mIns, Cr, Cho, and glutamate (Glu) levels have been demonstrated within the NAWM of patients with MS, likely indicating gliosis and inflammation.
NAA decreases have also been demonstrated in the NAWM of the primary progressive form of MS (PPMS) and have been proposed as a marker of disease progression in this MS phenotype. Nonetheless, in a study performed in 40 patients with PPMS, Narayana and colleagues found no significant differences in NAA levels between T2 lesions and NAWM. Lipid peaks in NAWM were identified in most patients with PPMS in that study. Last, in patients with clinically isolated syndromes, several studies have shown a decrease in NAA, with normal or elevated mIns and Cho levels, indicating that axonal damage occurs during the first demyelinating episode, but absent or only minimal increase of the activity of glial cells.
Gustafsson and colleagues performed 1 H-MRS in a group of patients with a clinical diagnosis of MS in whom brain MR imaging was normal. This group, which accounts for approximately 3% of all patients with MS, showed a significant decrease in NAA, indicating diffuse neuronal/axonal damage. However, in contrast to studies in patients with MS with brain T2 lesions, a decrease in Cho and Cr was detected, a finding that could reflect an increase in protective or healing abilities in this particular and unusual group of patients with MS.
Although MS is considered a disease of the white matter, demyelination can also be found in the deep cerebral nuclei, cerebral cortex, and gray matter of the spinal cord and brainstem. Cerebral cortex involvement may contribute to neurologic and cognitive impairment, particularly in advanced disease stages, as a result of axon and dendrite transection, synapse loss, and neuron apoptosis. Unfortunately, currently available MR imaging techniques are not optimal for detecting cortical lesions because of poor contrast resolution between normal-appearing gray matter (NAGM) and the plaques in question, and because of the partial volume effects of the subarachnoid spaces and cerebrospinal fluid surrounding the cortex. New MR techniques, such as double inversion recovery (DIR) sequences, which selectively suppress the white matter signal and cerebrospinal fluid and phase-sensitive inversion recovery sequences, which generate a high signal-to-noise ratio image, significantly increase the sensitivity for detecting cortical MS lesions, although most purely intracortical lesions remain invisible. 1 H-MRS offers detection of diffuse gray matter involvement, and several studies have demonstrated an NAA decrease in the cortical and subcortical NAGM of patients with MS. In addition, significantly lower Cr and glutamine-glutamate (Glx) values have been described, which could be interpreted as an indirect expression of metabolic dysfunction. Lipid resonances consistent with an active process of demyelination/remyelination can also be present. There are reports showing either an increase or decrease in mIns, which is thought to be the result of gliosis or a possible combination of reduced neuronal cellularity and a lack of gliosis. Similarly, there are reports of increases in the Cho resonance, likely attributable to microscopic lesions that are not visible on T2-weighted imaging, as well as decreases in this metabolite, which could indicate reduced cellular density and metabolic activity ( Table 2 ).
| Metabolite | NAWM | NAGM |
|---|---|---|
| Lipids | ↑ | ↑ |
| N -acetylaspartate | ↓ | ↓ |
| Glutamic/glutamine | ↑ | ↓ |
| Creatine/phosphocreatine | ↑ or ↓ | ↓ |
| Choline compounds | ↑ or ↓ | ↑ or ↓ |
| Myo -inositol | ↑ | ↑ or ↓ |
In addition to detection of changes in levels of the above-mentioned metabolites within the NABT, recent studies have reported changes in other metabolites, such as citrulline and glutathione. Citrulline resonances are more frequently identified in NAWM and in chronic lesions of early-onset patients with MS than in healthy subjects, suggesting an association between increased citrullination of myelin proteins and demyelinating disease. Furthermore, a decrease in glutathione has been reported in NAWM, NAGM, and T2 lesions of patients with MS. This metabolite is considered a biomarker of oxidative stress in the cell.
1 H-MRS in the diagnosis of pseudotumoral idiopathic inflammatory-demyelinating lesions
Idiopathic inflammatory demyelinating diseases can present as single or multiple focal brain lesions that may be clinically and radiographically indistinguishable from tumors. This situation is a diagnostic challenge and reasonably calls for biopsy despite clinical suspicion of demyelination. However, even the biopsy specimen may resemble a brain tumor because of the hypercellular nature of the lesions, which are often associated with large protoplasmatic glial cells with fragmented chromatin and abnormal mitosis (Creutzfeldt cells). On MR imaging, these pseudotumoral lesions usually present as large, single or multiple focal lesions located in the brain hemispheres. Clues that can help to differentiate these lesions from a brain tumor include a relatively minor mass effect or vasogenic edema, incomplete ring-enhancement on T1-weighted gadolinium-enhanced images sometimes associated with a rim of peripheral hypointensity on T2-weighted sequences, and an internal pattern of alternating bands on T2-weighted images (Balo-like pattern). Nonetheless, the differential diagnosis between malignant gliomas and pseudotumoral demyelinating brain lesions may be impossible based solely on these cMR imaging features. In these cases, 1 H-MRS can provide useful additional information, although reports on the diagnostic value of this technique in tumors have yielded conflicting results.
Several studies have shown that pseudotumoral demyelinating lesions and glial tumors can present with similar spectral patterns. Others suggest that the combination of 1 H-MRS and cMR imaging features can facilitate the correct diagnosis, and that an increase in Glx should suggest a pseudotumoral demyelinating lesion. More sophisticated methods rely on statistical analysis of the spectrum using pattern recognition techniques or combining results obtained from spectra acquired at short and long echo times. Pattern recognition techniques applied to 1 H-MRS data obtained from acute large solitary demyelinating lesions and astrocytic tumors (low-grade, anaplastic astrocytomas and glioblastoma multiforme) can correctly classify the lesions, based on the leave-one-out technique. However, classification of chronic lesions with this approach is limited because the metabolic patterns of low-grade astrocytomas can overlap those of chronic lesions. Hourani and colleagues studied 36 brain tumors and 33 non-neoplastic pseudotumoral lesions (10 demyelinating) using a discriminant function analysis that correctly classified 84% of the cases. More recently, Majós and colleagues analyzed the spectra of different focal noncystic and non-necrotic brain lesions (68 glial tumors World Health Organization grade II and III, and 16 pseudotumoral lesions), and found differences in NAA, Glx, Cho, and mIns. This study proposed a classifier based on the mIns/NAA and Cho/NAA ratios obtained at short and at long echo times, tested with a test-set group of 28 cases. Accuracy was about 80%, and the confidence of neuroradiologists in establishing a correct differential diagnosis between tumoral and nontumoral lesions improved in 5% to 27% of cases ( Figs. 3 and 4 ). A different and probably more challenging situation is when acute pseudotumoral demyelinating lesions present with a ring-enhancement pattern of contrast uptake (cystic/necrotic appearance) on cMR imaging, mimicking high-grade primary tumors or metastasis. The 1 H-MR spectra of these lesions are characterized by the presence of Lac, macromolecules/lipids, and Cho with a marked decrease in NAA. On follow-up, these lesions show rapid disappearance of the Lac and macromolecule/lipid signal, whereas NAA shows progressive and partial recovery, associated with a decrease in lesion size and cessation of contrast uptake. These findings suggest the existence of an inflammatory process that produces an accumulation of edema in the extracellular space with an almost complete absence of cells. With elimination of the inflammation, there is a reduction in the edema and almost complete normalization of the spectral pattern, indicating that cell destruction is less important than was initially expected ( Fig. 5 ).
Related posts:


Stay updated, free articles. Join our Telegram channel

Full access? Get Clinical Tree


