Magnetic resonance spectroscopy (MRS) is a powerful clinical tool for investigating the metabolic characteristics of neurologic diseases. Proton ( 1 H)-MRS is the most commonly used and widely available method. In this article, a brief introduction regarding technical issues of 1 H-MRS applied to the study of metabolic diseases is followed by a description of findings in some of the most common entities in this large, heterogeneous group of neurologic disorders. The aim was to provide a focused representation of the most common applications of 1 H-MRS to metabolic disorders in a routine clinical setting.
Key points
- •
Proton magnetic resonance spectroscopy (MRS) is an important adjunct to conventional MRI in the diagnosis of metabolic disorders.
- •
Some metabolic diseases are associated with entirely specific characteristic MRS findings, consisting of either abnormal elevation or reduction of a single normal peak or detection of abnormal metabolites.
- •
Specific MRS patterns are mainly found in Canavan disease (elevated NAA), creatine deficiency (reduced Cr), nonketotic hyperglycinemia (presence of glycine), and maple syrup urine disease (detection of branched-chain amino acids).
- •
In most the inherited metabolic disorders, MRS findings are abnormal but not specific for a single disease or syndrome.
- •
Nonspecific MRS patterns are either unremarkable (ie, similar to normal age-matched controls) or consisting of a variable degree of modification of the ratios between the various normal metabolites in the MR spectra, possibly associated with presence of lactate.
Introduction
Metabolic diseases comprise a large host of inherited disorders that may predominantly involve the cerebral gray matter, white matter, or both. The underlying, causative enzyme defects have been elucidated in several of these conditions, and research constantly adds new information to this already relevant body of knowledge; however, a significant proportion of metabolic diseases remain without a specific etiology despite extensive clinical, imaging, and laboratory investigations. Magnetic resonance imaging (MRI) plays a pivotal role in the diagnostic evaluation of patients suspected of harboring metabolic disease. The specificity of MRI findings increases significantly when a pattern recognition approach is used, but may remain unsatisfactory, because different metabolic disorders may result in similar signal intensity changes on conventional magnetic resonance (MR) images. Magnetic resonance spectroscopy (MRS) plays an important supportive role to conventional MRI in the diagnosis of metabolic disorders, based on its capability to detect and quantify in vivo both normal and abnormal metabolites in the brain.
The technical basis of MRS is related to the identification of metabolites based on their differences in resonance frequencies, which is translated into a graph in which the various peaks correspond to individual compounds. Thus, when used in association, MRI and MRS enable one to correlate anatomic and physiopathological characteristics within preselected areas of the brain. MRS can be performed based on signal generated by hydrogen protons ( 1 H), carbon ( 13 C), or phosphorus ( 31 P) atoms. Unlike 13 C or 31 P MRS, however, 1 H-MRS has become widely available in a routine clinical setting. In fact, hydrogen is the most abundant atom in the human body and its nucleus emits a strong radiofrequency signal, which generates a sufficient signal-to-noise ratio at 1.5 T to become detectable with a sufficient resolution. At higher magnetic field strength (ie, 3 T) the resolution of 1 H spectra improves, providing better resolution of the individual compounds. On the other hand, also at 3 T, the number of metabolites that can be detected is necessarily limited by the narrow chemical shift range, which unfavorably influences their identification and quantification.
Technical aspects
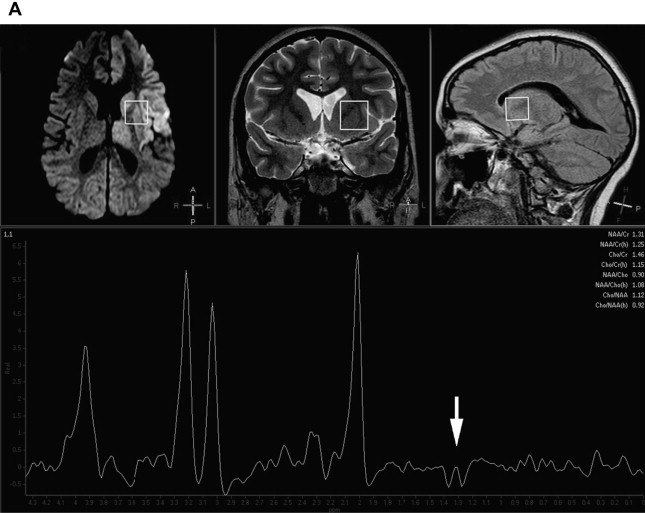
The most commonly used techniques of 1 H-MRS are single-voxel and multivoxel (ie, chemical-shift imaging) techniques. Single-voxel MRS provides spectral information on predetermined selected brain volumes (usually at least 2 × 2 × 2 cm) in a reasonable amount of time (usually less than 5 minutes) ( Fig. 1 ). Multivoxel MRS, although usually longer in terms of acquisition time, provides spectra from multiple, small, and contiguous volumes on a particular region of interest that may involve both the gray and white matter, which enables one to map metabolic tissue distributions, usually at higher spatial resolution than single-voxel 1 H-MRS ( Fig. 2 ). On both single-voxel and multivoxel MRS, the possibility to detect the various metabolites, and their relative orientation with respect to the baseline, depends on several variables. Among these, the choice of the echo-time (TE) is of critical importance. MRS can be performed at short (20–35 ms), intermediate (135–144 ms), and long (270–288 ms) TE, with different results regarding number, sharpness, and orientation of metabolite peaks, as well as the amount of background noise. At short TE, a larger number of metabolites are detected but peak superimposition may occur, rendering interpretation more problematic. On the other hand, the number of detected metabolites is lower at longer TE, but the peaks are typically better defined. At intermediate TE, lactate is typically inverted below the baseline because of the J-coupling phenomenon (see Fig. 1 B).
Obtaining more than one spectrum at different TEs or in different brain locations obviously has a significant influence over scan duration and must be evaluated carefully in each individual case, depending on the clinical suspicion and the findings on conventional MRI. Although, in theory, in many metabolic conditions the sampling voxel may be placed anywhere in the brain, as abnormal metabolites are presumably present diffusely everywhere, abnormal signal intensity areas are sampled in the vast majority of clinical settings. In this case, care should be used to avoid necrotic, hemorrhagic, or calcified regions in which tissue samples may no longer be representative of the metabolic status of the rest of the brain or in which the presence of magnetic field inhomogeneity may result in excessively noisy or uninterpretable spectra.
Significance of the individual peaks
Regardless of the TE or other technical aspects, under normal conditions 1 H-MRS consistently detects 3 main peaks: N-acetylaspartate (NAA), a marker of the neuronal population and viability; choline (Cho), a membrane marker; and creatine (Cr), representing energy storage compounds. Other normal peaks that are detected only at short TE include myo-inositol (mI), a glial function marker. The absolute and relative concentrations of these metabolites vary normally with age. In the neonate, Cho and, at short TE, mI are the prominent peaks, whereas NAA is low; by 4 months, NAA becomes more prominent, whereas Cho and mI decrease; an adult appearance is reached by 6 months of age. In most clinical instances, absolute metabolite quantitation is not routinely obtained; instead, relative concentrations to Cr (the so-called ratios) are usually measured, based on the fact that Cr remains stable throughout life, reflecting the stability of energy storage in the brain under normal conditions, and may therefore be confidently used as a control value in relation to other metabolites under most circumstances.
Under abnormal conditions, including inherited metabolic disorders, other metabolites may become detectable on 1 H-MRS. The most important of these is lactate, whose presence indicates anaerobic metabolism and must be considered abnormal, with the sole exception of newborns, in which mild amounts of lactate may be physiologic. MRS detection of lactate in the brain parenchyma is a more precise indicator of cerebral lactic acidosis than blood and cerebrospinal fluid (CSF) lactate levels. Lactate is particularly elevated during phases of metabolic unbalance in mitochondrial diseases, and may be used to monitor the response to therapy. Lactate can also be demonstrated in a wide variety of metabolic disorders causing secondary lactic acidosis, however, and is therefore not specific for mitochondrial diseases. Evidence of lactate in normal-appearing brain areas on conventional MRI is an important indicator of an underlying generalized metabolic impairment (see Fig. 1 ). Glutamine/glutamate complexes are normally detected on short-TE 1 H-MRS, but their increase in several metabolic diseases is a sign of excitotoxicity, which may portend neuronal death. Other metabolites only show up in specific conditions, such as glycine in nonketotic hyperglycinemia, and may therefore significantly assist in a specific diagnosis.
Specific MRS patterns
Only a small number of entities are associated with entirely specific and characteristic findings on 1 H-MRS. In these conditions, spectral abnormalities may result from either abnormal elevation or reduction of a single normal peak or from the appearance of abnormal metabolites that are specifically associated with a given metabolic condition. Only the most relevant entities are discussed here.
Canavan Disease
Canavan disease is an autosomal recessive disease caused by mutation of the ASPA gene on chromosome 17 encoding for aspartoacylase, an enzyme metabolizing NAA into acetate and aspartate. This results in brain accumulation of NAA, a neuron-specific marker that is present in neuron bodies and axons and indicates their density and viability. Production of NAA takes place in the mitochondria of brain tissue. The role of NAA is still incompletely elucidated; it is proposed that it regulates the molecular efflux water pump system that accounts for fluid balance between intracellular and extracellular spaces within the myelinated white matter. Thus, excessive NAA would lead to water accumulation in white matter with resulting intramyelinic edema, spongy degeneration, demyelination, and glial cell loss. Canavan disease occurs in 3 clinical variants: neonatal, infantile, and juvenile, of which the infantile (presenting by age 3–6 months) is the most common. Patients are affected with macrocrania, hypotonia, lethargy, seizures, spasticity, optic atrophy, and developmental delay, with variably severe phenotypes depending on the degree of residual enzyme activity.
MRI shows a diffuse leukoencephalopathy with swelling of the white matter, involving both the supratentorial and the infratentorial compartments with relative sparing of the internal capsules and corpus callosum. The affected white matter appears hypointense on T1-weighted images, hyperintense on T2-weighted images, and shows restricted diffusivity on diffusion-weighted images (DWI) owing to intramyelin edema. The gray matter of the thalami and globi pallidi is also involved, whereas the caudate nuclei, putamina, and claustra are spared. Canavan disease has a pathognomonic appearance on 1 H-MRS, characterized by marked, isolated increase of the NAA peak ( Fig. 3 ) ; other nonspecific features include decrease of Cho and Cr, increase of mI, and the frequent presence of lactate.
Creatine Deficiency
Creatine phosphate is required for adenosine triphosphate synthesis during energy use, and is obtained through phosphorylation of creatine. Creatine deficiency may result from defective primary synthesis because of deficiency of 1 of 2 enzymes, guanidinoacetate-methyltransferase or arginine:glycine amidinotransferase, or from an X-linked defect of the creatine transport mechanism that delivers creatine to the brain. The latter is the most common form of creatine deficiency, and occurs in males with global developmental delay with a prevailing impairment of language.
Conventional MRI is typically unremarkable. On the other hand, MRS is highly specific, showing profound reduction or even absence of the Cr peak regardless of sampling voxel positioning in the brain ( Fig. 4 ). MRS is also useful to monitor therapy, which consists of oral creatine monohydrate administration and is typically efficacious in synthetic defects, but not in transport abnormalities.
Nonketotic Hyperglycinemia
Glycine is a neurotransmitter with inhibitory functions at level of the spinal cord and brainstem, and playing an excitatory role in the forebrain. Nonketotic hyperglycinemia (NKH), also known as glycine encephalopathy, is caused by defective glycine cleavage enzyme. As a consequence, glycine builds up to toxic levels in body fluids and in the brain, where it causes glutaminergic excitotoxicity. NKH presents with 4 variants: neonatal, infantile, late onset, and transient, of which the neonatal or classical form is the most common. Affected newborns have a very severe clinical picture with encephalopathy, lethargy, respiratory failure, seizures, and hiccups; mortality is high within the first year of life, with severe residual disability in survivors.
MRI findings may simulate those of hypoxic-ischemic encephalopathy, with restricted diffusion in early myelinated pathways, such as the posterior limb of the internal capsule, possibly associated with corpus callosum abnormalities and delayed myelination. 1 H-MRS plays an important supportive role in the diagnosis of NKH. In fact, glycine resonates together with mI at 3.56 ppm, where it normally contributes to less than 20% of the so-called mI peak at short TE. Because of its short T2 relaxation time, however, mI is not normally detected on intermediate or long TE MRS. Therefore, persistence of a conspicuous “mI” peak at intermediate and long TEs indicates elevated glycine, thus supporting the diagnosis of NKH in a concordant clinical setting ( Fig. 5 ).
Maple Syrup Urine Disease
Maple syrup urine disease (MSUD) is related to deficiency of branched-chain α-keto acid dehydrogenase enzyme, leading to increased concentrations of branched-chain amino acids (leucine, valine, and isoleucine) and their derivatives in blood, urine, and CSF. There are 4 clinical phenotypes of MSUD: classical, intermediate, intermittent, and thiamine responsive forms, of which the most common and severe is the classical form, which presents in neonatal age with a severe and progressive neurologic deterioration characterized by feeding problems, vomiting, ketoacidosis, hypoglycemia, seizures, and lethargia progressing to coma.
Conventional MRI shows diffuse swelling of the brain, which is attributable to a combination of extensive vasogenic edema that involves nonmyelinated white matter structures and intramyelin edema at the level of the posterior brainstem tracts, central cerebellar white matter, posterior limbs of the internal capsules, and corticospinal tracts in the corona radiata, which are normally already myelinated at birth. The 2 types of edema can be confidently differentiated from one another on DWI, resulting in a pathognomonic appearance of restricted diffusion in the myelinated areas at birth.
In MSUD, especially during stages of metabolic decompensation, elevations in the branched-chain amino acids leucine, isoleucine, and valine and their ketoacids can be detected on 1 H-MRS as a peak at 0.9 ppm. This peak is present on both short-TE and long-TE spectra and may be associated with evidence of lactate and/or reduction of the NAA peak ( Fig. 6 ).
Nonspecific MRS patterns
In most inherited metabolic disorders, findings on 1 H-MRS are abnormal but not specific for a single disease or syndrome. This nonspecific appearance may either be unremarkable (ie, similar to normal age-matched controls) or entail a variable degree of modification of the ratios between the various normal metabolites in the MR spectra, in which (1) the NAA peak is variably decreased owing to depletion of the neuronal population with loss of neuroaxonal integrity; (2) Cho may be variably increased or decreased in function of the degree of membrane turnover, demyelination, and gliosis; (3) Cr is usually stable in most instances; (4) elevation of the mI peak, probably as a result of gliosis, may be seen at short-TE; and (5) lactate may also show up as an indicator of anaerobic glycolysis owing to defective energy metabolism. MRS findings may vary with time in function of the disease stage (active metabolic stress vs burnt-out), and also regionally in the brain depending on the degree of involvement of individual structures. MR spectra may be abnormal also in areas that appear unaffected on conventional MR images, as a result of widespread metabolic derangement. Sampling of the CSF in the ventricular cavities is also possible and may provide a gross appraisal of CSF lactic acidosis, which may be relevant in cases in which CSF examination is not available (see Fig. 1 ).
Despite the nonspecific appearance in terms of identification of a definite diagnosis of a specific disease entity, studies have shown that quantitative MRS can assist in discriminating between different types of white matter disorders and classifying white matter lesions of unknown origin with respect to underlying pathologic conditions. The following section deals with some of the most prominent metabolic diseases characterized by an aspecifically pathologic spectrum, aiming to identify a role for 1 H-MRS in the neuroimaging diagnostic process.
Pelizaeus-Merzbacher Disease
The Pelizaeus-Merzbacher disease (PMD) is the prototype of the large, heterogeneous group of hypomyelinating disorders. PMD is caused by various types of mutations of the X-linked proteolipid protein 1 gene (PLP1), located on Xp22 and encoding for the proteolipid protein (PLP), which contributes to 50% of all central nervous system (CNS) myelin protein. These mutations include copy number changes (most commonly duplications), point mutations, and insertions or deletions of a few bases, corresponding to a wide clinical spectrum that ranges from the most severe connatal PMD to the classic infantile PMD, the PLP1 null syndrome, and the least severe spastic paraplegia 2 (SPG2). Affected patients are invariably males, and present variably depending on their clinical form, ranging from severe failure to thrive to variably severe developmental delay, seizures, spasticity, and, characteristically for the classical PMD form, nystagmus. A more recently described entity within the PMD disease group is PMD-like disease 1 (PMLD1). This particular entity is caused by mutations of the GJC2 gene on chromosome 1q41-q42. Affected patients have a similar clinical picture as classic PMD, but with higher cognitive and intellectual function, greater levels of motor performance, earlier onset, and more rapid neurologic deterioration.
In both PMD and PMLD1, conventional MRI shows a diffuse pattern of hypomyelination of the white matter, with increased signal intensity on T2-weighted or fluid-attenuated inversion recovery (FLAIR) images and isointensity to mild hypointensity on T1-weighted images. Affected white matter regions include the cerebral hemispheres, cerebellum, and brainstem in the connatal and classical forms of PMD as well as in PMLD1, whereas hypomyelination is patchy in SPG2. Findings on 1 H-MRS are nonspecific, and often not profoundly dissimilar to those of age-matched controls ( Figs. 7 and 8 ). In PMD, Cho has been described to be variably reduced (reflecting hypomyelination) or increased (reflecting ongoing demyelination in the early stages), whereas NAA may range from mildly to moderately reduced. In general, MRS findings may vary depending on clinical phenotypes, genotypes, or stages of disease progression.
Related posts:
 Proton Magnetic Resonance Spectroscopy
 1H Magnetic Resonance Spectroscopy in Multiple Sclerosis and Related Disorders
The Use of Magnetic Resonance Spectroscopy in the Evaluation of Epilepsy
MR Spectroscopy in Brain Infections
1H Magnetic Resonance Spectroscopy in Multiple Sclerosis and Related Disorders
The Use of Magnetic Resonance Spectroscopy in the Evaluation of Epilepsy
MR Spectroscopy in Brain Infections
 Hypoxic-Ischemic Injuries
 Magnetic Resonance Spectroscopy in Common Dementias
Stay updated, free articles. Join our Telegram channel

Full access? Get Clinical Tree


