Magnetic resonance spectroscopy (MRS) is indicated in the imaging protocol of the patient with epilepsy to screen for metabolic derangements such as inborn errors of metabolism and to characterize masses that may be equivocal on conventional magnetic resonance imaging for dysplasia versus neoplasia. Single-voxel MRS with echo time of 35 milliseconds may be used for this purpose as a quick screening tool in the epilepsy imaging protocol. MRS is useful in the evaluation of both focal and generalized epilepsy.
Key points
- •
Magnetic resonance spectroscopy (MRS) is indicated in the imaging protocol of the patient with epilepsy to screen for metabolic derangements such as inborn errors of metabolism and to characterize masses that may be equivocal on conventional magnetic resonance imaging for dysplasia versus neoplasia.
- •
Single-voxel MRS with an echo time of 35 milliseconds may be used for this purpose as a quick screening tool in the epilepsy imaging protocol.
- •
MRS is useful in the evaluation of both focal and generalized epilepsy.
Introduction
This article concerns the use of proton magnetic resonance (MR) spectroscopy ( 1 H MRS) in the evaluation of the patient with epilepsy. It is a practical “why, how to, and when” article. It is written in 3 parts to address 3 questions that arise when the neuroimager evaluates a patient with epilepsy.
Why do MRS? This first part addresses the question of whether MRS is indicated in the evaluation of the patient with epilepsy. It is addressed to the radiologist, faced with a requisition to perform MR imaging for a patient with epilepsy, who often needs to ask the referring clinician to add an order for MRS for the same patient. It answers the question, “Is there evidence that MRS is indicated in this setting?” The term “conventional MR imaging” is used to distinguish those sequences such as anatomic T1- and T2-weighted and susceptibility-weighted images and functional sequences such as diffusion-weighted or diffusion tensor imaging that we routinely perform for MR evaluation of the patient with epilepsy.
How to do MRS in the patient with epilepsy? This second part addresses MRS technique. It is written for the radiologist, spectroscopist, or MR imaging technologist who is at the scanner console with a patient on the table and considers the parameters to enter into the MR unit.
When , in what clinical-imaging setting, can MRS help you to diagnose or manage the patient with epilepsy? This third part addresses the question of interpretation and exemplifies the use of MRS by the use of cases. It is written for the radiologist or spectroscopist who is trying to interpret the semiologic, conventional MR imaging, and MRS data combined to diagnose or manage the patient.
Part I: why do MRS?
In our practice, many clinicians who refer patients for MR imaging of the brain for evaluation for epilepsy do not initially request MRS. When we ask clinicians to add a requisition for MRS, 2 questions are usually raised:
“Is there evidence that MRS is going to make a difference for my patient?” “Is it covered by my patient’s insurance, and, if not, who will pay for it?”
The answer to the first question requires knowledge of the evidence in favor of the diagnostic yield of MRS, reviewed later.
The answer to the second question requires a practical billing strategy. Consideration of reimbursement for MRS is simply imaging realpolitik for any radiologist interested in sustaining a clinical MRS practice. It is our experience that without a consensus institutional policy on the reimbursement for MRS, the MRS component of the practice is at risk of shutting down under the weight of negative feedback from rejected insurance claims.
“Is there clear evidence that MRS is going to make a difference for my patient?”
The evidence in favor of an indication for MRS is best understood in the context of the broader consideration of the role of neuroimaging in the evaluation of the patient with epilepsy. The first goal of neuroimaging in the evaluation of the patient with epilepsy is etiologic triage. When a patient seizes, the goal of imaging is to detect certain treatable epileptogenic lesions, such as tumors, hemorrhage, vascular malformations, or inborn errors of metabolism, that would indicate involvement of the neurosurgical, neurointerventional, or metabolism and genetic services. From the perspective of the managing epileptologist, the initial goal of imaging is to determine if other clinical services need to be involved in the care of the patient.
Triage
In this initial triage phase of imaging, MRS is indicated for the following:
- 1.
Screening for metabolic derangements that may occur from seizure or from certain metabolic disorders that may present with seizures such as mitochondrial disorders and creatine (Cr) deficiencies ( Figs. 1 and 2 ).
Fig. 1
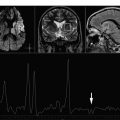
MRS raises concern for a metabolic derangement and seizure when the conventional MR images appear normal. A 2-year-old boy underwent MR imaging and MRS for evaluation for global developmental delay and had not, previous to the MR imaging/MRS, manifested clinically recognized seizures. ( A ) The conventional 3-T MR imaging was normal and showed normal hippocampi and basal ganglia. ( B ) 1 H MRS obtained at TE of 35 milliseconds over the left basal ganglia as a screening tool for metabolic derangement showed a peak at 1.3 ppm equivocal for lactate versus lipid. This finding then prompted additional SV MRS at TE 35 over the left frontal white matter first at TE of 35 milliseconds ( C ) and then at TE of 288 milliseconds ( D ) that confirmed the abnormal lactate and distinguished it definitively from lipid. Based on the MRS findings, the boy underwent EEG that was interpreted as diffusely abnormal because of the presence of frequent bursts of high-amplitude generalized 3- to 4-Hz spike-and-wave activity.
Fig. 2
MRS shows an inborn error of metabolism (Cr transport deficiency) when the conventional MR images are nonspecific. A 3-year-old boy with language delay (not speaking) and history of multiple generalized reportedly febrile seizures underwent MR imaging and MRS. ( A ) The conventional MR imaging showed two 3-mm nonspecific hyperintensities deep to the facial colliculi and was otherwise normal. ( B , C ) 1 H MRS at 1.5 T and TE of 144 milliseconds showed conspicuous absence of the normal Cr resonance at 3.0 ppm. ( D , E ) 1 H MRS obtained over the left fontal white matter at TE of 144 milliseconds confirms absence of the Cr peak. Serologic testing showed low levels of Cr and guanidinoacetate consistent with arginine:glycine amidinotransferase (AGAT) deficiency. ( F ) Normal level of central nervous system Cr after 3 months of Cr replacement therapy.
- 2.
The characterization of masses detected by conventional MR imaging as neoplasm versus dysplasia ( Fig. 3 ).
Fig. 3
MRS confirms a focal lesion as a dysplasia instead of a neoplasm. MR imaging and MRS were performed for evaluation of a 2-year-old boy with focal seizure semiology consisting of right head turn and eye deviation and staring, which evolved to tonic seizures with bilateral arm raising. EEG showed nearly continuous spikes with slow-wave discharges in the left frontal region F3/Fp1. Axial ( A ) and coronal reformats ( B ) from an MPRAGE show asymmetric sulcation and fullness of the left middle frontal gyrus that raised concern for FCD versus neoplasm. MRS at TE 35 milliseconds over the lesion ( C ) compared with MRS obtained over the contralateral normal right middle frontal gyrus ( D ) show a reduced NAA/Cr ratio and no elevation in Cho/NAA, findings thought to favor dysplasia instead of neoplasia. The patient became medically refractory during the course of the next 2 years, underwent resection of the left middle frontal gyral lesion, and pathologic examination confirmed a type IIB FCD.
Screening for metabolic derangements
Seizure alone and inborn errors of metabolism that may cause seizure can produce metabolic derangements that may be detectable by MRS and may be missed by conventional MR imaging (see Figs. 1 and 2 ). During seizure, the metabolic demands of brain cells can exceed the supply of oxygen and nutrients to the brain tissue undergoing elevated electrical activity, and this metabolic disturbance can be detected by MRS, including the abnormal accumulation of lactate and the reduction in N -acetyl aspartate (NAA).
Parikh and colleagues reviewed the records of 429 patients admitted to a pediatric epilepsy unit during the course of 1 year and found that of the 85 patients who had undergone metabolic testing, 11% had known inborn errors of metabolism. In addition, the 2002 Amalfi conference provides a clear consensus recommendation that screening for inborn errors of metabolism should be performed in the initial workup. MRS fits squarely into this imperative for screening.
In many inborn errors of metabolism that may cause seizures, MRS can characterize further those abnormal findings seen on conventional MR imaging ( Fig. 4 ); however, the indication for the inclusion of MRS in the initial imaging protocol becomes more clear when one considers that MRS may diagnose certain metabolic disorders that commonly result in seizures (eg, mitochondrial disorders and Cr deficiency), when conventional MR imaging may be insensitive or nondiagnostic. Mitochondrial disorders are important considerations in the evaluation of the patient with epilepsy; in a review of 429 children admitted to a major pediatric epilepsy center in 2005, of the 85 patients with metabolic testing and without prior diagnosis, Parikh and colleagues found metabolic evidence of mitochondrial dysfunction in 28% of cases. Epilepsy, conversely, occurs frequently in mitochondrial disorders; Khurana and colleagues evaluated 38 patients with mitochondrial disorders and found that 61% had seizures. In mitochondrial disorders, moreover, seizures may be the presenting finding: Canofoglia and colleagues reviewed 31 patients with mitochondrial encephalopathies and found that seizures were the presenting feature in 53% of patients. Mitochondrial disorders may exhibit considerable epileptic phenotypic heterogeneity and may present with partial or generalized epilepsy. MRS, moreover, may reveal metabolites, in voxels placed over areas that appear normal on conventional MR imaging sequences. Cristina Bianchi and colleagues, for example, studied 15 patients with mitochondrial disorders and found that MRS voxels placed methodically over white or gray matter that appeared normal on conventional imaging showed abnormal metabolites. They found reduced choline (Cho) in 80% of normal-appearing cerebellar white matter, 67% of normal-appearing peritrigonal white matter, and 60% of normal cortical gray matter. Cristina Bianchi and colleagues also found reduced NAA/Cr ratios in 93% of normal-appearing cerebellum and in 87% of normal-appearing cortex, and in many cases, they found an abnormal small peak at 0.9 parts per million (ppm) that they attributed to amino acids. Abnormal lactate was often detected over abnormal-appearing brain but was also found in 2 patients over normal-appearing brain. In 3 patients in whom conventional MR imaging was interpreted as completely normal, MRS detected reduced Cho, NAA, and peaks at 0.9 ppm. These findings suggest that MRS is indicated as a screen for mitochondrial disorders even in MR imaging of normal-appearing brain.
Cr disorders are also important considerations in the evaluation of the patient with epilepsy. Cr is an important metabolite for central nervous system function. Two inherited enzymatic defects ( l -arginine-glycine amidinotransferase [ AGAT ] and guanidinoacetate methyltransferase [ GAMT ]) and one inherited defect in Cr transport ( SLC6A8 ) have been characterized that result in a deficiency of cerebral Cr. Cr deficiency may present with epilepsy or developmental delay. Arias and colleagues reviewed 1600 patients with mental retardation, autism, and/or epilepsy and found the prevalence of Cr transporter deficiency prevalence to be 0.25% (4 of 1600 cases). Of the 14 patients with global developmental delay who Neumeyer and colleagues studied, moreover, 2 had Cr transporter deficiency diagnosed by MRS, and in both of these cases, MR imaging showed only nonspecific T2 hyperintensity in the periventricular white matter.
Medical Management
Once the goal of etiologic triage has been met, however, neuroimaging, not only MRS but also MR imaging, magnetoencephalography, and positron emission tomography, has a minor role in the initial management of the new patient with epilepsy. Management decisions are based principally on semiologic and electroencephalographic (EEG) findings. Although the detection of a gliotic scar or unequivocal malformation of cortical development may be of interest to the clinician, such data are “kept in consideration” or followed, whereas a trial of antiepileptic drugs (AEDs) is initiated.
Some studies have suggested a role for MRS as a biomarker for response to AEDs. Campos and colleagues, for example, studied 25 patients with temporal lobe epilepsy (TLE) who responded to first-line AEDs and 21 patients with TLE who did not respond. The authors found a statistically significantly lower NAA/Cr ratio in the hippocampi of the nonresponders. Although certainly of interest, it is the authors’ experience that such findings, initially, are not yet considered to be actionable, in that they do not practically influence the choice of AED or duration of the trial of AED therapy and do not per se justify the inclusion of MRS into the imaging protocol.
Presurgical Evaluation
If, however, the patient becomes refractory to medical therapy and the patient is considered for surgical management, MR imaging and MRS reemerge as tools in the evaluation. Although the indication for MRS in this phase again certainly includes the detection of inborn errors of metabolism that may have been missed during the initial triage phase, the indication for MRS in this phase is based more on the reevaluation of lesions that may have been characterized initially as a dysplasia (eg, for evidence of neoplasia) ( Fig. 5 ) or, as mentioned later, in confirmation of laterality of the epileptogenic nidus.
MRS for lateralization of the epileptogenic nidus in TLE
During persurgical planning for epilepsy surgery, localization of the epileptogenic nidus can be seen as a process of triangularization among seizure semiology, EEG findings, and imaging. A patient may be considered a surgical candidate if the seizure semiology, EEG findings, and imaging cohere (ie, if the lesion suggested by imaging would expectedly produce the seizure semiology showed clinically and if the lesion seen on imaging corresponds anatomically to the electrographic maxima seen on EEG).
In the specific semiologic setting of TLE, when this process of triangularization fails, some investigators have proposed, as detailed later, that MRS may play an adjunct role in the presurgical evaluation of medically refractory TLE. Cendes and colleagues, for example, performed 1 H MRS and MR volumetric analyses of the temporal lobes in 100 patients with medically refractory TLE. Using reduced NAA/Cr ratios as a marker of neuronal loss, they found that MRS alone agreed with the lateralization determined by EEG in 86% of patients, better than MR imaging volumetry alone (83%), and that MRS was abnormal in 12 patients with normal MR imaging volumetric analysis. Cendes and colleagues proposed that MRS may be used in “conventional MR imaging negative” patients to confirm a lesion suggested by EEG.
Part II: how to do MRS: technique.
Major Resonances in Brain 1 H MRS and Their Clinical Relevance
The resonances seen in the brain on MRS are typically low-weight molecules such as NAA, Cho-containing compounds, Cr/phosphocreatine, lactate, myoinositol (mI), glutamate/glutamine (Glx), and lipids. NAA is predominantly found in neurons and therefore is a marker for neuronal density and viability. Cr serves as a marker for energy-dependent systems. Cho concentrations are increased as a result of increased inflammatory/gliotic processes and pathologic changes in membrane turnover. Lactate is not normally detected on MRS; however, its presence can be detected after seizures, in cases of hypoxic-ischemic injury (HII), or in mitochondrial disorders and in the first hours after birth. Glutamate is the major excitatory neurotransmitter of the brain. Excessive stimulation of glutamate can be toxic and can eventually result in neuronal death. mI is an organic osmolite and primarily located in glia, and an increase in mI is commonly thought to be a marker of gliosis.
Acquisition Parameters
As with MR imaging, the choice of echo time (TE) and repetition time (TR) can have a considerable effect on the appearance of the information obtained in an 1 H MRS study.
Spin-lattice TRs
Spin-lattice TRs for selected resonances at 1.5 T vary between 1100 and 1700 milliseconds. Ideally, one has to wait 3 × T1 (3 × 1500 milliseonds = 4500 seconds) to gain approximately 95% of the original magnetization. With longer TRs (>3 seconds), the signal/noise ratio (SNR) and the quantification improve. A long TR, however, results in a long examination time. Therefore, typical TRs for clinical MRS experiments lie between 1 and 3 seconds.
TEs
MR spectra obtained with shorter TEs (∼35 milliseconds) allow the detection of more metabolites, including Glx and mI (see Fig. 1 A). Specifically, high concentrations of Glx may reflect seizure activity and have been reported in neonates with HII; elevated Glx levels were found to be associated with poor prognosis in HII. Furthermore, low levels of mI most likely the result of glial loss were associated with poor outcome.
Spectra obtained with longer TEs (135–144 milliseconds) depict a reduced number of metabolites ( Fig. 6 B). However, spectra are easier to process and analyze because of the relatively flat baseline. In addition, lactate (1.3 ppm) and alanine (1.5 ppm) doublets are inverted, thereby allowing better differentiation between these metabolites and lipids/macromolecules. Spectra obtained at TEs of 270 to 288 milliseconds have the advantage that typically no lipid contamination is present; lactate is once more phased up, but the SNR is considerably decreased because of T2 effects (see Fig. 6 C).
In our MRS protocol for epilepsy, we suggest initially obtaining short TE MR spectra to detect metabolites such as Glx and mI. In case there is suspicion for the presence of lactate, we suggest repeating the MRS using a longer TE of 144 milliseconds at 1.5 T and 288 milliseconds at 3 T. This technical adjustment at 3 T is necessary, because at higher field strengths, lactate may show reduced or absent signal intensity at a TE of 144 milliseconds.
Editing and 2-Dimensional MRS Techniques
Splitting of resonance lines into multiplets because of J-modulation results in signal loss and cancellation and therefore can make the quantification in an MR spectrum more challenging. In addition, in the 1 H MR spectrum, many resonances overlap at similar frequencies (eg, the γ-aminobutyric acid [GABA] triplet and the Cr singlet resonate at 3.0 ppm).
In difference editing, a selective and nonselective spin-echo spectrum is acquired, and the difference spectrum contains the contribution of the target metabolite providing the subtraction of all other contributors will null the background. For example, the GABA triplet at 3.0 ppm can be detected using this method, canceling contribution from Cr. Macromolecules, however, are usually edited along with GABA.
An MRS technique called 2-dimensional J-resolved MRS spreads out the resonances that overlap in conventional 1-dimensional MRS along 2 separate dimensions, improving the definition and specificity of detection of different metabolites. Such metabolite-specific MRS techniques may be useful for the evaluation of GABA levels with antiepileptic treatment.
Localization Techniques
To measure MR spectra in vivo, one has to be able to define the spatial origin of the detected signal. Currently, 2 methods exist to obtain the spatially localized metabolic information in vivo: (1) single-voxel spectroscopy (SVS) uses selective excitation pulses to localize a voxel of typically 3 to 8 cm 3 and (2) multivoxel arrays of spectra (MRS imaging) can be obtained in 1, 2, or 3 dimensions resulting in individual voxel sizes of typically 0.5 to 3 cm 3 .
SVS
SVS has the advantage of higher SNR and typically shorter acquisition times (∼3 minutes) compared with MRS imaging (∼8 minutes). In SV MRS, one approach is to survey white matter and deep and cortical gray matter by performing 3 × SV MRS at TE of 35 milliseconds, one each over the centrum semiovale, lentiform nuclei, and midline occipitoparietal cortex. Another approach is to perform one SV MRS over the basal ganglia; in the interest of time, when the conventional/anatomic MR images are negative, we perform one SV MRS over the basal ganglia as a screening technique and reserve the 3-voxel approach for those cases when there is a high clinical suspicion for inborn error of metabolism or when the anatomic MR images raise such concern. To evaluate TLE, 2 single voxels are placed in the left and right temporal lobes over the hippocampi.
MRS imaging or MV MRS
MRS imaging allows one to collect the spectral information from a volume consisting of many voxels. We prefer MRS imaging for clinical studies when it is indicated to obtain metabolic information of a large and heterogeneous lesion (eg, in tumors and in myelin disorders such as adrenoleukodystrophy). In addition, spectral information from control regions may be obtained simultaneously. However, the main limitation of MRS imaging is the lengthy acquisition times, especially with 3-dimensional data acquisition.
Fast MRS imaging techniques
Several fast MRS imaging experiments have been presented that promise to reduce data acquisition duration. Some improvement of sensitivity may be achieved by acquiring data by reduced k-space sampling. Fast MRS imaging sequences have evolved from concepts related to spatial encoding using gradient switching during acquisition. Spiral trajectories in k-space allow fast encoding of spatial information. A recent study showed that clinical 3-dimensional MRS images can be acquired 4 times faster with spiral protocols than with the elliptical phase encoding protocol at a high spatial resolution of 1 cm 3 in 2.5 minutes.
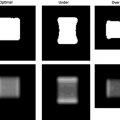
Chemical Shift Artifact
With increasing field strengths, (1) chemical shift displacement error, (2) spatial nonuniformity of radiofrequency excitation, and (3) contamination with subcutaneous lipid signal from tissues outside the region of interest are becoming increasingly and more severe. To compensate for radiofrequency inhomogeneity, adiabatic pulses can be implemented. Recently, a 3-dimensional MRS imaging technique with low-power adiabatic pulses and fast spiral acquisition was implemented, resulting in high-resolution, high-SNR MRS data ( Fig. 7 ).