Infection of the central nervous system can be life-threatening and hence requires early diagnostic support for its optimal management. Routine definitive laboratory diagnostic tests can be time-consuming and delay definitive therapy. Noninvasive imaging modalities have established themselves in the diagnosis of various neurologic diseases. In this article, a pragmatic review of the current role of magnetic resonance spectroscopy in the diagnosis and management of intracranial infections is addressed.
Key points
- •
Magnetic resonance spectroscopy forms a part of diagnostic sequences used for imaging brain infections. A quality spectrum can usually be obtained with point resolved spectroscopy using an echo time of 135 ms, which is usually sufficient for diagnostic purposes.
- •
The metabolites important in central nervous system infections are amino acids (valine, leucine, and isoleucine, 0.9 ppm), alanine (1.48 ppm), acetate (1.92 ppm), succinate (2.4 ppm), glycine (3.56 ppm), and trehalose (3.6-3.8 ppm).
- •
The presence of amino acids at 0.9 ppm usually differentiates abscesses from tumors. The ratio of acetete/succinate differentiates parasitic from pyogenic infections. Trehalose, if seen, is specific for fungal infections.
- •
Magnetic resonance spectroscopy is diagnostic in pyogenic abscesses and parasitic cysts. It may be helpful as a support to imaging in diagnosis and prognosis in other infections.
Introduction
Magnetic resonance spectroscopy (MRS) provides information about the metabolite profile of the tissue under investigation and has long been under the domain of biochemists and researchers. The technique has evolved into a clinical tool and with its use it is possible to obtain information on a routine clinical scanner in a reasonably short time. This development has resulted in its routine use in clinical practice. After the initial euphoria of MRS entering into the domain of clinical radiology and purported by few enthusiasts to be able to diagnose everything to the cynical observations of many radiologists that it “does not help at all when it is required and provides quality data when not required,” it has come a long way. Although it has established itself as a strong adjunct, most of the diagnostic difficulties arise not because of the inherent limitations of the technique but because of the suboptimal acquisition, limited knowledge, and inadequate interpretation of the acquired data.
In this discourse, when sufficient although confusing data about role of spectroscopy in clinical imaging have accumulated, every attempt has been made to analyze and classify the role of MRS in central nervous system (CNS) infections.
Basic requirements for acquisition and interpretation of MRS data
Although the technical details have been described in the first and second articles in this issue, it should be re-emphasized that MRS is a part of the diagnostic MR imaging workup of the brain infection and is not a stand-alone investigation. The decision of performing MRS in a case of known or suspected infection depends on the results of the conventional MR imaging.
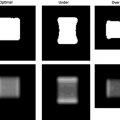
As these patients are usually sick and cannot stand for long periods of time to image, single-voxel methods like Point RESolved Spectroscopy (PRESS) at intermediate echo time (TE) with a volume of 1 to 2 mL from the region of interest usually provides diagnostic quality data in a very short time. Besides the usual brain metabolites observed on MRS, metabolites of interest in CNS infections are summarized in Table 1 .
| Metabolites | Resonance Peaks at (ppm) | Features |
|---|---|---|
| Amino acids (valine leucine and isoleucine) | 0.9 | Phase reversal at intermediate TE, seen in abscesses not in tumors |
| Lipid/lactate (Lip/lac) | 0.9 to 1.4, 1.33 | Lactate doublet shows phase reversal at intermediate TE, seen in anaerobic metabolism, abscesses as well as tumors. |
| Alanine | 1.46 | Phase reversal at intermediate TE. |
| Acetate | 1.92 | A/S ratio to differentiate parasitic from pyogenic abscess |
| Succinate | 2.4 | A/S: >1 in pyogenic and <1 in parasitic |
| Glycine | 3.56 | Seen in pyogenic abscesses |
| Trehalose | 3.6 to 3.8 | Disaccharide specific for fungal infections |
Specific metabolites should be searched for from a good quality spectrum to make a clinical conclusion for the diagnosis of brain infections. Poor quality data should be disregarded and no attempt should be made to interpret it. The voxel should be placed within the center of the lesion to ensure uncontaminated spectrum that may confound the interpretation.
MRS in bacterial infections
Pyogenic Abscess
Brain abscesses are characteristically defined as a focal suppurative process within the brain parenchyma. The abscesses result from cerebritis (1–9 days) to well-developed abscess (days 14 onwards). The causative organisms are quite variable and may consist of aerobes, anaerobes, facultative anaerobes, and a mixture of facultative anaerobes and true anaerobes. Pus culture is usually considered the reference standard for identification of its causative agents.
The fully developed mature abscess with central liquefactive necrosis appears as hypointense on T-weighted and hyperintense on T2-weighted images. The abscess rim appears isointense or slightly hyperintense on T1-weighted and hypointense on T2-weighted images and shows rim enhancement on postcontrast T1-weighted images. It is not always possible to differentiate pyogenic abscesses from other cystic intracranial mass lesions solely from conventional MR imaging features.
In vivo MRS may help in suggesting the definitive diagnosis of pyogenic abscess among the various lesions with comparable imaging features. The spectral pattern permits the differentiation of pyogenic abscess from tumors by demonstrating the presence of amino acid peak (0.9 ppm) consisting of cytosolic amino acids, namely, valine, leucine, and isoleucine, in the former. The amino acids persist in varied concentrations even when the patient is on medical therapy and/or when pus is sterile on culture. The presence of cytosolic amino acids on MRS has been explained by the fact that pyogenic abscesses contain large amounts of neutrophils and proteins. The cytolysis of neutrophils results in the release of proteolytic enzymes that hydrolyze proteins into amino acids and thus contribute to MR spectrum. Treatment-naive abscesses present a variety of spectral patterns depending on the type of causative bacteria responsible for the pathologic abnormality. The abscess with true aerobes ( Nocardia asteroides and Pseudomonas aeruginosa ) shows peaks of cytosolic amino acids, lactate, alanine, and glycine (3.56 ppm), along with mobile lipid peaks at various chemical shifts (0.9, 1.3 ppm) ( Fig. 1 ). The in vivo spectrum of abscess containing only anaerobic bacteria ( Bacteroides fragilis group and Peptostreptococcus sp ) is comparatively metabolically richer. In addition to the above-mentioned metabolites, the spectrum shows acetate (1.92 ppm) with or without succinate (2.4 ppm) ( Fig. 2 ). When both peaks are present, acetate seems to be present in a higher concentration than succinate. The spectrum taken from the abscess containing facultative anaerobes (such as Staphylococcus aureus , Escherichia coli , Streptococcus mirabilis , Klebsiella pneumoniae , Enterococcus fecalis , Streptococcus intermedius ) may show metabolite patterns similar to those of aerobic as well as anaerobic abscess. Facultative anaerobes when mixed with aerobes in abscess give a spectral pattern typical of aerobic bacteria growth. However, these bacteria in combination with anaerobes give the metabolite pattern of anaerobic abscess. The metabolism of facultative anaerobes is by definition flexible (ie, these are not restricted to their mode of metabolism). In the presence of oxygen, they follow the aerobic pathways for energy similar to aerobic bacteria; however, in oxygen-deficient conditions, they pursue anaerobic pathways.
In aerobic metabolism, the 2 molecules of pyruvate formed during glycolysis enter the tricarboxylic acid cycle and ultimately form carbon dioxide, water, and stored energy in the form of adenosine triphosphate. Although succinate is an intermediate of the tricarboxylic acid cycle, its steady-state concentration is negligible and it is not seen in aerobic abscess. In contrast, in anaerobic abscess, the pyruvate undergoes anaerobic fermentation and is carboxylated to oxaloacetate and eventually transforms to malate. The malate is metabolized in mitochondria to form acetate and succinate.
MRS helps to distinguish infective from noninfective lesions and may give information on the type of infective agent, which may guide the clinician to initiate appropriate antibiotic therapy, while the pus culture results are awaited.
A combination of in vivo MRS and diffusion-weighted imaging (DWI)/diffusion tensor imaging (DTI) has been used in the differential diagnosis of abscess from other intracranial cystic mass lesions. It has been reported that demonstration of restricted diffusion on DWI with reduced apparent diffusion coefficient (ADC) is highly suggestive of brain abscesses; however, in the absence of restriction, in vivo MRS may help to distinguish brain abscess from other nonabscess lesions. The viable inflammatory cells and bacteria have been thought to be responsible for restricted diffusion in brain abscess. It may not always be possible to demonstrate amino acids, a hallmark of brain abscess, in all the cases. Typically staphylococcus abscess may not form amino acids ( Fig. 3 ), and in those cases, combining DWI and DTI may help in its definitive diagnosis.
Pyogenic Meningitis
Pyogenic meningitis has been defined as an inflammatory response to bacterial infection of the pia-arachnoid matter and the cerebrospinal fluid (CSF) of the subarachnoid space. The diagnosis of meningitis is usually made by CSF analysis using cytology, biochemistry, and culture.
MR is generally superior to computed tomography (CT) in demonstrating the distension of the subarachnoid space, which is reported to be an early finding in severe meningitis. MRS has not yet been shown to be of much diagnostic value in patients with meningitis. In vivo proton MRS ( 1 H-MRS) in meningitis has reported normal levels of brain N -acetyl aspartate (NAA), creatine (Cr), choline (Cho), and inositol with mild elevation of Lactate (Lac). Ex vivo MRS of CSF performed in proven cases of pyogenic meningitis has reported the peaks of cytosolic amino acids (0.9 ppm), Lac (1.33 ppm), alanine (1.47 ppm), acetate (1.92 ppm), and acetoacetate (2.24 ppm) along with reduced levels of glucose. Anaerobic bacterial metabolism is likely to explain increased glucose consumption and consequently lactic acidosis in the CSF.
MRS in tubercular infections
Tuberculosis (TB) of the CNS is always secondary to TB elsewhere in the body and is caused by Mycobacterium tuberculosis . The incidence of CNS TB has increased following the emergence of acquired immunodeficiency syndrome (AIDS). TB causes a granulomatous inflammatory reaction, which may involve the meninges, causing TB meningitis, and/or brain parenchyma, causing tuberculoma or tuberculous abscess.
Tuberculoma
Tuberculoma is a space-occupying mass of granulomatous tissue. The definitive diagnosis is necessary, as most tuberculomas respond to medical management. On MR imaging, tuberculoma’s appearance varies depending on its stage of maturation (ie, whether noncaseating, caseating with solid or liquid center). The noncaseating tuberculoma usually appears as hyperintense on T2-weighted and slightly hypointense on T1-weighted images. Metastases, lymphoma, and other infective granulomas also have similar imaging features. On T1-weighted magnetization transfer (MT) imaging, the cellular component of the lesion appears brighter and is considered relatively specific for the disease ( Fig. 4 ). The solid caseating tuberculoma appears isointense to hypointense on both T1-weighted and T2-weighted images. This T2 hypointense-appearing solid caseation often overlaps with imaging features of lymphoma, glioblastoma, fungal, and cysticercus granuloma. On T1-weighted MT images, the solid center appears hypointense with hyperintense rim. The significantly lower MT ratio (MTR) of the rim of T2 hypointense tuberculoma than cysticercus granuloma helps in its differentiation. When the solid center of caseating lesion liquefies, it appears hyperintense with a hypointense rim on T2-weighted images with edema. On T1-weighted and T1-weighted MT images, the peripheral hyperintense rim may be visualized beyond the T2 hypointensity and shows enhancement on postcontrast study. The lower MTR in different stages of tuberculoma is due to high lipid content present in the granuloma.
In vivo MRS may help in the differentiation of the tuberculoma with solid caseation from other nontuberculous lesions. In vivo, ex vivo, and in vitro MRS have been performed to fingerprint the metabolites of M tuberculosis in tuberculomas. In vivo MRS with stimulated echo acquisition mode sequence shows only lipid peaks at 0.9, 1.3, 2.0, 2.8, and 3.7 ppm, corresponding to terminal methyl group [–(CH 3 )], methylene group –(CH 2 ) n , of CH 2 CH fatty acyl chain, “CH-CH 2 CH” of fatty acyl chain, and phosphoserine, respectively. Ex vivo MRS of the excised tuberculomas confirms the resonances seen in vivo. On ex vivo and in vitro (lipid extract) spectroscopy, caseating tuberculomas show peaks attributed to cyclopropane rings (0.5 and 0.1 ppm) and phenolic glycolipids (7.1–7.4 ppm). These peaks have also been reported from the lipid extracts of pure strain of M tuberculosis . Phenolic glycolipids represent the biochemical fingerprint of M tuberculosis in a granuloma. One of the characteristic features of mycobacterium is the presence of a lipid-rich cell wall that contributes to the lipid peaks in tuberculomas. On perchloric acid extract of tuberculoma as well as cultured M tuberculosis , serine could also be demonstrated.
Although in vivo spectroscopy is known to show only lipid in T2 hypointense tuberculoma, the lesion with variegated appearance shows Cho at 3.22 ppm along with lipid (see Fig. 4 ). As these lesions show a large amount of cellularity and minimal solid caseation, the cellular regions appear brighter on T1-weighted MT imaging and show Cho peak on spectroscopy along with lipid. Predominance of cellularity in such variegated tuberculoma is responsible for prominent Cho peak and may cause difficulty in its differentiation from neoplastic lesions.
Tuberculous Abscess
Tuberculous brain abscesses are the result of infection of M tuberculosis ; tuberculous brain abscesses are relatively rare and form about 4% to 7% of the total CNS TB in developing countries. These abscesses on MR imaging generally appear as nonspecific large, solitary, and frequently multiloculated ring-enhancing lesions with surrounding edema and mass effect. The rim of tuberculous abscesses shows significantly lower MTR values (19.89 ± 1.55) than that of pyogenic abscesses (24.81 ± 0.03) as the latter remain rich in protein content as compared with the former, which is loaded with high-lipid containing M tuberculosis bacilli. Restriction on DWI with low ADC values has also been observed in tubercular abscesses and is considered to be the result of the presence of intact inflammatory cells in the pus.
In vivo MRS has also been used for the differentiation of tuberculous abscesses from other lesions, such as pyogenic and fungal abscesses, which may appear similar on conventional MR imaging. The in vivo 1 H MRS from tuberculous abscess shows only Lac and lipid peaks (at 0.9 and 1.3 ppm), without any evidence of cytosolic amino acids ( Fig. 5 ). MTR and amino acid peaks may help to discriminate pyogenic from tuberculous abscess.
Tubercular Meningitis
Tuberculous meningitis is the most frequent manifestation of TB in the CNS. The incidence of tuberculous meningitis in a given community is proportional to the prevalence of tuberculous infection in general. Diagnosis depends on CSF cytology and biochemistry depends on the detection of acid-fast bacilli in smear. However, because of the relatively low sensitivity of laboratory tests, noninvasive imaging plays an important role in its diagnosis.
The imaging features in tuberculous meningitis largely depend on the stage at which MR imaging is performed. MR imaging in tuberculous meningitis may be normal in the early stages of disease, especially on noncontrast studies. MT is superior to conventional spin echo sequences for imaging the abnormal meninges, which are seen as hyperintense on precontrast T1-weighted MT images and enhance further on postcontrast T1-weighted MT images. The visibility of the inflamed meninges on precontrast T1-weighted MT images with low MTR is very specific of tuberculous meningitis and differentiates it from other nontuberculous chronic meningitis. Ex vivo spectroscopy of CSF has been attempted in this context. High-resolution ex vivo MRS of CSF showed the Lac, acetate, and sugars along with the peaks from cyclopropyl rings (−0.5 to +0.5 ppm) and phenolic glycolipids (7.1 and 7.4 ppm); these have not been observed with pyogenic meningitis.
MRS in fungal infections
Fungal infections of CNS are relatively rare in immunocompetent individuals, where they tend to be caused by pathogenic species such as Cryptococcus . Immunocompromised patients, however, are susceptible to invasive infection with a wider range of opportunist fungal pathogens, such as Aspergillus and Candida .
Fungal Abscess
Both Aspergillus and Candida species can produce cerebral abscesses. The Aspergillus infection has been observed in immunocompromised patients. Two general patterns of infection are seen: (1) direct extension from the paranasal sinuses, eye, or middle ear leading to abscess in frontal or temporal lobe and (2) hematogenous spread with formation of multiple small abscesses at the junction of gray and white matter (WM). The CSF findings are usually nonspecific. The presence of red blood cells in the CSF of a patient with brain abscess is suggestive of possible intracranial aspergillosis.
On conventional MR imaging, the fungal abscess resembles pyogenic abscesses. The abscess core appears hyperintense with hypointense rim on T2-weighted images and hypointense core with isointense to minimally hyperintense rim on T1-weighted images. Postcontrast study shows rim enhancement. It has been shown that the pyogenic abscesses have smooth and lobulated walls, whereas the tubercular abscesses have smooth, lobulated, or crenated walls with no intracavitary projections. The fungal abscesses show intracavitary projections directed centrally from the wall without any contrast enhancement in these projections. These projections have not been shown in nonfungal abscesses and seem to be a characteristic feature of a fungal cause on conventional MR imaging. The wall and projections of the fungal abscesses show restricted diffusion on DWI with low ADC values; however, the cavity of the abscess may show high ADC values ( Fig. 6 ).
The limited published data on in vivo 1 H MRS in fungal abscesses showed cytosolic amino acids (valine, leucine, and isoleucine) and lactate along with multiple peaks between 3.6 and 4.0 ppm. These peaks have been assigned to trehalose sugar present in the fungal wall, confirmed with ex vivo high-resolution spectroscopy of aspirated material. Such sugar peaks have also been reported in cryptococcomas. The presence of characteristic sugar peaks from the fungal wall on in vivo spectrum may help in diagnosis in such cases.
Mucormycosis or phycomycosis is a fatal fungal infection of immunocompromised patients caused by the Mucor species. Predisposing factors include diabetes mellitus with ketoacidosis, naso-orbital necrotizing infection, and meningoencephalitis. MR imaging shows parenchymal abnormalities in the basal ganglia, thalamus, and midbrain. The lesions appear hypointense on T1-weighted, T2-weighted, and fluid-attenuated inversion recovery (FLAIR) images with surrounding edema and enhance on postcontrast studies. In vivo MRS in mucormycosis showed lactate, alanine, acetate, succinate, and lipid peaks along with the peaks of NAA, Cr, and Cho. An unassigned peak at 3.8 ppm was also present; ex vivo high-resolution studies may allow this to be characterized and provide a biochemical fingerprint for mucormycosis.
Fungal Granuloma
Fungal granulomas are the space-occupying lesions caused by Aspergillus and Cryptococcus species and have been referred to as Aspergillus granuloma and cryptoccoma , respectively.
Aspergillus granuloma
On T2-weighted MR imaging, the A granuloma gives a heterogenous pattern of intensity (ie, hyperintense lesions mixed with hypointense foci). On T1-weighted images, the lesion is hypointense. On spectroscopy there is high Cho, low Cr, Lac, and low NAA ( Fig. 7 ). Because the spectrum is completely nonspecific for the aspergillus granuloma, it does not help in its differentiation from other neoplastic and nonneoplastic mass lesions.
Cryptococcosis
Cryptococcosis is the most common cause of CNS fungal infections in humans and is the most commonly identified fungal infection in the CNS in AIDS patients. It is a ubiquitous monomorphic fungus that primarily exists as encapsulated yeast and reproduces by budding. A polysaccharide capsule surrounds the fungus. The cryptococcal infection results from inhalation or ingestion of fungus with the respiratory tract being the primary site of infection. It penetrates the meningeal vessel wall and colonizes the perivascular spaces, sheaths of fungi leading to pseudocyst formation, typically found in basal ganglia and subcortical areas. The proteolytic enzymes produced by the fungus may destroy the pial lining of the Virchow-Robin (VR) spaces so that cryptococci penetrate the parenchyma, causing meningoencephalitis. Another location is the choroid plexuses where Cryptococcus may cause the formation of voluminous masses. Imaging findings on both CT and MR imaging are nonspecific in the case of cryptococcal meningitis. MR imaging may be negative or uncommonly show contrast enhancement. Several MR appearances have been described in CNS cryptococcosis in AIDS patients: dilated VR spaces, cryptococcoma, and military enhancing nodules in parenchyma or leptomeningeal cisternal spaces and a mixed pattern. The dilated VR spaces filled with mucoid material, inflammatory cells, and organisms manifest on MR imaging as punctuate hyperintense round-oval lesions on T2-weighted images and hypointense on T1-weighted images and show no evidence of contrast enhancement or associated mass effect or perilesional edema. The cryptococcomas have variable appearances depending on the relative constituents of the lesions. The gelatinous pseudocysts or the nonreactive form of meningoencephaitis represent sequelae of cryptococcus colonization along the VR spaces or in the large perivascular spaces of the choroid plexus. They are usually hyperintense on T2-weighted and hypointense on T1-weighted images and may show contrast enhancement on postcontrast study. The lesions that are hyperintense on T2-weighted images and enhance after contrast administration characterize the granulomatous type of meningoencephalitis. These granulomas are preferentially located in the ependyma of choroid plexus and may cause localized ventricular dilatation.
There are isolated reports of 1 H MRS in cases of intracerebral cryptococcal abscess and cryptococcomas. In vivo 1 H MRS shows variable Lac along with a decrease in NAA, Cho, and Cr. Ex vivo 1 H MR spectroscopy has shown the presence of lipid/Lac and trehalose sugars in the regions of 3.42, 3.62, 3.83, and 5.17 ppm, which represent the polysaccharide capsule of cryptococcal yeast.
Phaeohyphomycosis
Primary cerebral phaeohyphomycosis is a serious infection with poor prognosis. The infection may mimic a high-grade glial tumor on imaging. Biopsy and culture resolve the 2 entities. NAA/Cho ratio of approximately one on MRS may raise suspicion of an underlying pathologic abnormality other than glioma. Increased awareness of cerebral phaeohyphomycosis and careful analysis of MRS should encourage early biopsy and aggressive treatment to improve the outcome.
Related posts:
 Proton Magnetic Resonance Spectroscopy
 1H Magnetic Resonance Spectroscopy in Multiple Sclerosis and Related Disorders
The Use of Magnetic Resonance Spectroscopy in the Evaluation of Epilepsy
1H Magnetic Resonance Spectroscopy in Multiple Sclerosis and Related Disorders
The Use of Magnetic Resonance Spectroscopy in the Evaluation of Epilepsy
 Magnetic Resonance Spectroscopy in Metabolic Disorders
 Hypoxic-Ischemic Injuries
 Magnetic Resonance Spectroscopy in Common Dementias
Stay updated, free articles. Join our Telegram channel

Full access? Get Clinical Tree


