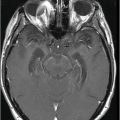
DWI image.
MR angiography of the circle of Willis.
Spectacular Shrinking Deficit
Primary Diagnosis
Spectacular shrinking deficit
Differential Diagnoses
Non-ketotic hyperglycemic hemichorea
Hemorrhagic infarct
Hypoglycemic coma
Cardiac arrest/global hypoxia
Basal ganglia calcification
Hepatic failure
Hyperalimentation or long-term parenteral nutrition due to manganese toxicity
Wilson disease
Imaging Findings
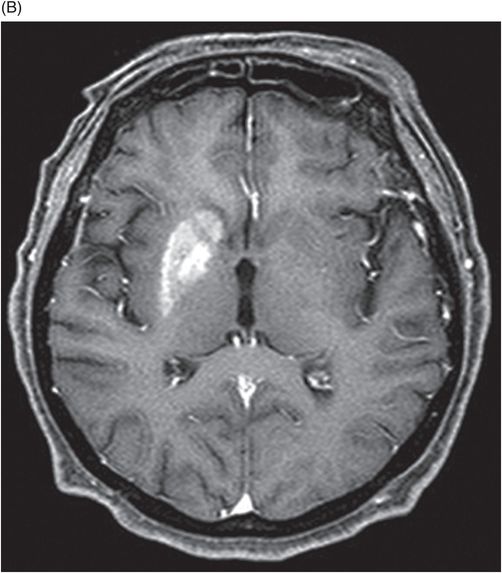
Fig. 22.1: (A) Axial T1WI showed a non-enhancing T1 hyperintense signal in the right caudate head and (B) lentiform nucleus. Fig. 22.2: FLAIR sequence demonstrated subtle focal hypointense signal. Fig. 22.3: T2 demonstrated shine through on DWI sequence and no obvious changes on ADC map (not shown). Fig. 22.4: GRE sequence did not exhibit hemorrhage. Fig. 22.5: MR angiography of the circle of Willis showed focal narrowing and irregularity of the M1 segment of right middle cerebral artery (MCA).
Discussion
Spectacular shrinking deficit (SSD) is typically defined as a major, hemispheric ischemic stroke syndrome that is followed by dramatic improvement within hours and disappearance of most of the clinical manifestations. Cerebral hemispheric ischemic syndrome classically includes moderate to severe consciousness disturbance, hemiparesis, aphasia, apraxia, and amnesia. Neurologically, a decline in 8 NIHSS points or a drop to < 4 NIHSS points within 24 hours is considered a required clinical criteria for diagnosis of SSD. A temporary occlusion of the internal carotid artery or MCA, with subsequent fragmentation and distal migration of the thrombus and restoration of perfusion prior to irreversible damage, has been proposed as the underlying mechanism leading to SSD. Previously published literature has suggested that the majority of SSD cases are associated with cardioembolism, ranging from 80% to 94%. However, other recent studies have shown no specific relation to cardiac sources. Spectacular shrinking deficit has been reported to occur in 12–14% of patients with initial major hemispheric syndrome. Patients with SSD tend to be younger and have a smaller final infarct core, as compared to hemispheric syndrome patients without SSD. The presence of smaller initial DWI lesion with a large mismatch volume associated with reperfusion and small final infarct volume are characteristic MRI patterns of SSD. However, in most patients, serial MRI can reveal T1-weighted hyperintensity and T2-weighted relative hypointensity in the ischemic lesions of basal ganglia and cerebral cortex, usually between one and three weeks after SSD. This is described as delayed ischemic hyperintensity (DIH) on T1-weighted MRI. Thereafter over time, it gradually fades away with the appearance of atrophy of the affected structures. Magnetic resonance imaging performed in our patient after approximately two weeks showed unilateral T1-weighted hyperintensity with focal MCA narrowing, consistent with an SSD diagnosis.
Two common differential diagnoses of T1-weighted hyperintensity on cranial MR images include hemorrhagic infarct and calcification. Typically, hemorrhagic transformation follows the process of hemoglobin degradation within the tissue and the MRI signal differs during various phases of degradation. For example, during acute stage hemorrhage, intracellular deoxyhemoglobin, MR signal appears isointense on T1-weighted and hypointense on T2-weighted images. In contrast, during chronic stage, hemosiderin, MR signal appears hypointense on both T1-weighted and T2-weighted images. In addition, CT can show hyperdense hemorrhage in the affected areas. Calcification can appear hyperintense on T1-weighted and hypointense on T2-weighted images and hyperdense on CT.
Cardiac arrest with global hypoxia typically presents with symmetric changes in the basal ganglia, thalami, and/or substantia nigra and cortex with diffusion restriction. The changes in SSD do not represent infarction or hemorrhage on MRI. The difference in presentation is most likely related to the mechanism of ischemia (focal and brief in SSD and global and prolonged in cardiac arrest).
The MRI findings of hypoglycemic coma can mimic SSD, sharing a similar time of onset following hypoglycemic injury. Diffusion imaging best demonstrates early-onset hypoglycemic effects; however, the signal changes are often bilateral and symmetric.
Hemichorea-hemiballism syndrome is a condition that typically manifests in elderly diabetics with non-ketotic hyperglycemia. Usually CT images show unilateral hyperdensity involving the lentiform nuclei and caudate head, with similar hyperintense signal changes on T1-weighted images. Moreover, in hemichorea-hemiballismus, symptoms resolve with adequate glycemic control. The histopathology, which usually reveals glial tissue with abundant gemistocytes, is also seen in SSD. Improvement in hemiplegia but persistence of symptoms even after glycemic control, and angiographic evidence of stenosis of the MCA, confirm the suggested diagnosis of SSD and exclude hemichorea-hemiballism syndrome.
Other conditions presenting with T1-weighted hyperintensity of basal ganglia such as hepatic encephalopathy, hepatic failure, hyperalimentation, or long-term parenteral nutrition (manganese), Wilson’s disease, and hamartomas as noted in neurofibromatosis-1 were excluded because of the discrepancy in clinical presentation and laboratory findings.
Various animal and human studies have shown that a brief period of MCA occlusion causes selective neuronal necrosis and apoptosis, leaving intact glial cells and microvessels in the caudo-putamen region and cerebral cortex. This has been termed incomplete infarction, in which the brain tissue framework is preserved, without any cavitation. Therefore, the DIH in the basal ganglia and cerebral cortex may neuroradiologically represent selective neuronal loss and gliosis without infarct or hemorrhage. The neuronal cell death matures slowly in the course of several weeks after an incomplete infarction with increasing glial reactions and deposition of paramagnetic compounds such as iron, manganese, and free radicals generated by the macrophages. This could explain the short T1-weighted and T2-weighted relaxation seen in the affected areas in SSD.
Stay updated, free articles. Join our Telegram channel

Full access? Get Clinical Tree


