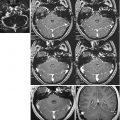
Fig. 19.1
Axial MR 3T, TSE T2-w images. (a) Diffuse infiltrative low-grade glioma. It is ill-defined and tends to blur the normally clear distinction between gray and white matter. (b) High-grade glioma with different components, an infiltrative part, and two solid parts with different signal. (c) Glioblastoma with heterogeneity of signal, due to the presence of necrotic central part. (d) Glioblastoma with heterogeneity of signal, due to solid, necrotic parts, and spots of hypointense signal due to paramagnetic blood breakdown products
MRI is used in routine clinical practice to establish a differential diagnosis, guide tumor biopsy or resection, plan radiotherapy, and monitor response to treatment and disease progression [31].
When we study a tumor, we have to consider the main properties of the MR sequences [32]:
Spin echo (SE) and fast/turbo spin echo (F/TSE)
SE has traditionally been considered the mainstay of neuroimaging. T2-weighted SE or FSE/TSE highlights pathologic processes because of its sensitivity to fluid and changes in tissue cellularity. T1-w imaging can be helpful for identifying substances such as fat, melanin, and proteinaceous material, because they appear bright. Intralesional hemorrhages have a variable appearance on T1-w or T2-w images depending on the age of the bleeding.
Gadolinium-based contrast material has to be administrated in a study of a tumor. Gadolinium is a paramagnetic metal that, by itself, is toxic to the human body, so must be tightly chelated to another substance such as diethylenetriaminepentaacetic acid (DPTA) before use. Gadolinium shortens T1 relaxation times, causing increased signal on T1-w images wherever the blood barrier has been breached and contrast material is able to enter.
Gradient echo (GE)
the lack of 180° refocusing pulse and the specific vulnerability to the T2*decay can be exploited to detect intracranial hemorrhage. Paramagnetic blood products create local magnetic field inhomogeneities and induce a characteristic signal loss on GRE sequences. In contrast blood can be more difficult to detect on SE sequences, which are less sensitive to susceptibility effects. The faster imaging time of GRE is particularly useful in 3D imaging, which requires longer scan times than 2D; in particular, 3D-spoiled GRE sequences provide T1-w images and excellent anatomic detail. 3D GRE sequences are useful for characterizing tumor extension in conjunction with gadolinium-based contrast.
Fluid-attenuated inversion recovery (FLAIR) is typically a T2-weighted FSE/TSE sequence that uses an inversion pulse to eliminate the signal from CSF. It is useful for highlighting lesions that lie close to ventricles or sulci and are not as conspicuous on T2-w sequences. Suppression of CSF signal allows to distinguish the different components of a neoplastic cystic lesion, for example, the cyst with a content-like CSF are dark and the cyst with protein or fat content are bright. FLAIR imaging is also limited in evaluation of the posterior fossa lesions because of CSF artifacts in the basilar cisterns and third/fourth ventricles. 3D FLAIR is not as susceptible to CSF flow artifact as 2D FLAIR because the inversion pulse is applied to the entire volume imaged and not just a single slice.
Fat saturation (FS)
is an alternative technique to STIR for eliminating signal from fat. FS exploits the chemical shift between protons in fat and those in water to reduce or remove the signal from the fat. This is clinically useful for diagnosing the fat components of a tumor.
A morphological exam of a tumor has to include T1-weighted precontrast, T2-weighted, DWI, and T1-weighted contrast imaging. FLAIR may be substituted for T2 to save time. PWI, MRS, and other advanced MR imaging techniques may be included in the protocol according to the availability of equipment and clinical scenario.
The standard protocol for brain tumor imaging based on expert panel discussion following the framework of the ACRIN 6686 (American College of Radiology Imaging Network) component of the RTOG 0825 (Radiation Therapy Oncology Group) protocol [33]:
Three plane localizer/scout in order to acquisition
T1-weighted precontrast (spin echo)
T2-weighted axial
FLAIR (optional to perform after contrast)
T1 map (quantitation) for DCE MR imaging – 3D gradient echo or 2D TSE/FSE T1
DWI and/or DTI (can extract DWI data trace/ADC from DTI)
T2* DSC MR imaging(after presaturation DCE MR imaging sequence)
T1-weighted postcontrast (spin echo)
These sequences can be used as an adjunct in the clinical brain tumor:
Functional language, auditory, visual, motor testing, and MRS
Can do FLAIR before DSC MR imaging
SWI, gradient echo, additional optional sequences
General parameter recommendations: for section thickness not greater than 5 mm, delay is recommended, which can be built in by performing DWI and/or DTI before acquiring T1-weighted postcontrast sequences. High field strengths provide superior image quality through increased signal intensity. The clinical superiority of 3 T over 1.5 T has been demonstrated in brain imaging [34, 35]. Head coil with ≥32 channels, for use with higher field strengths, offers additional signal intensity-to-noise ratio gains compared with conventional equipment [36, 37]. Delays of up to 20 min postcontrast injection significantly improve lesion detection rates and the assessment of lesion volume [38, 39]. Experimental studies by using a rat glioma model suggested that an 8-min delay postinjection represents a practical compromise between enhanced lesion detection and extended scanning time [40].
When we have to evaluate the morphological imaging of a tumor, we have to consider different aspects:
- (a)
The side of the lesion: supra or subtentorial, hemispheric or in deep structures
- (b)
If the lesion is solid, well defined, or diffuse, with ill-defined borders, infiltrating of the structures with distortion of gross morphology
- (c)
If the signal is homogeneous or dishomogeneous with cystic or necrotic parts
- (d)
If calcifications are present
- (e)
The kind of enhancement after contrast administration
The solid lesions are normally well demarcated from surrounding tissue; in general they are low-grade gliomas (pilocytic astrocytoma, ganglioglioma, etc.) (Fig. 19.2). The infiltrative lesions are ill-defined and tend to blur the normally clear distinction between gray and white matter. The signal of the tumor is hypointense on T1-w sequences and hyperintense on T2-w sequences [41].

Fig. 19.2
Coronal MR 3T, (a) IR-w image and (b) SPGR T1-w, after contrast administration. Gangliocytoma with cystic and solid parts. The solid parts show contrast enhancement
The heterogeneity of the signal is due to the presence of cystic or necrotic parts of the lesion. Necrosis can be either hemorrhagic or nonhemorrhagic. The effects of necrosis on MR imaging are complex and varied [30], but it can be identified if one uses both T1-weighted and FLAIR sequences. In general necrosis can be either high intensity or low intensity on T1-w images, as well as on T2-w images, due to the presence of paramagnetic cations or free radicals. These substances can shorten relaxation times, whereas regions of cystic necrosis prolong relaxation times [42]. Cystic necrosis has intensities consistent with high water content, and hemorrhagic necrosis parallels the complex intensities relevant to paramagnetic blood breakdown products. The identification of cystic areas on MR imaging also requires careful scrutiny of lesion intensity relative to CSF on all images. FLAIR can be particularly useful in proving cystic content of a lesion. If a lesion is isointense to CSF on T1-weighted, T2-weighted, and FLAIR images, none can state very confidently that the lesion is cystic, a pattern followed by arachnoid cysts and cysts associated with extra-axial masses. Unfortunately tumor cysts and cystic necrosis within neoplasms are often proteinaceous (Fig. 19.3) or contain dilute concentration of paramagnetic substances that can shorten T1 enough to alter intensity on these images [43]. Therefore, these regions are hyperintense to normal CSF on FLAIR. Hemorrhage is depicted by MR imaging, because of the paramagnetic properties of the blood breakdown products. On MR imaging, old hemorrhage is easily distinguished from other fluid (like CSF) because of paramagnetic properties of methemoglobin, the major constituents of chronic intracranial hemorrhage [44]. Blood may not evolve as rapidly if it is within tumor tissue, in comparison with evolution of benign hematomas. This delay in evolution may be related to the well-documented intratumoral hypoxia found in human neoplasms [45] or due to repeated episodes of bleeding [46].

Fig. 19.3
Axial MR 3T, (a) SE T1-w image, (b) TSE FLAIR T2-w image, (c) TSE T2-w image. Oligodendroglioma with cystic morphology. The cyst is different from CSF in FLAIR sequence in relation to a proteinaceous content
Calcifications are more evident on GRE sequences. They appear hypointense with different morphology and are more frequent in low-grade gliomas with slow growing.
19.2.1 Tumor Enhancement
Intra-axial enhancement of the brain and spinal cord is never normal. There must be a vascular structure or a breakdown in the blood-brain barrier. In the central nervous system (CNS), contrast enhancement is produced by two related, yet independent, processes: interstitial (extravascular) enhancement and vascular (intravascular) enhancement. The CNS capillaries have a selectively permeable membrane that creates a blood-brain barrier. The normal capillaries are impermeable to intravascularly injected contrast agents. Vascular enhancement is a combinated product of blood volume, blood flow (delivery of contrast agent or “wash in”), and “mean transit time” or time needed for “washout” of contrast agent. In addition to neovascularity, which increases both blood volume and blood flow, vasodilatation of existing normal vessels produces increased intravascular enhancement [47]. Extravascular or interstitial enhancement will also depend on the permeability of these capillaries to contrast agent. On MR imaging only the regions of tissue that lack an intact blood-brain barrier enhance. Interstitial enhancement is related to alterations in the permeability of the blood-brain barrier, whereas intravascular enhancement is proportional to increases in blood flow or blood volume.
The tumor interstitial enhancement is due to accumulation of paramagnetic contrast in the water-containing interstitial space [30]. The contrast agent enhances the relaxation of the water protons nearby, and we visualize the water in the enhancing tissue as high intensity on T1-weighted images. Generally tumors have a tendency to evoke the formation of capillaries within and sometime adjacent to their tissue. Tumor capillaries in gliomas may have near-normal features with functioning blood-brain barriers, so these areas of tumor tissue will not enhance with contrast. In other often more malignant gliomas, on the contrary, formation of capillaries is stimulated whose endothelia are fenestrated; therefore, with no blood barrier, these tumors should theoretically enhance [48]. The formation of tumor capillaries deficient in blood-brain barrier constituents (tight junctions), rather than an active destruction of the blood-brain barrier, is presumed to be the explanation for tumor enhancement. The enhancement may be immediate or delayed, evanescent or persistent, dense and homogeneous, or minimal and irregular. Perhaps one of the most important points for the radiologist to remember is that the lack of enhancement does not necessarily signify lack of tumor. It’s not possible to separate tumor from edema in infiltrative gliomas by enhancement, because tumor clearly is often present in area that do not enhance [30].
The low-grade glial tumor can be divided into major group: the infiltrative or diffuse astrocytomas and the localized noninfiltrative astrocytomas. The localized noninfiltrative astrocytomas may become heterogeneous not from necrosis, but through accumulation of serous fluid. The fluid must come from somewhere, so the periphery of the fluid space includes neoplastic tissue. Almost all “fluid-secreting” gliomas (pilocytic astrocytoma, ganglioglioma, etc.) enhance on MRI. These low-grade lesions may have abnormal capillaries but usually do not show increased blood flow. Most authors believe that the abnormal capillaries in these lesions do not form a blood-brain barrier and that the increased permeability is related to somehow to both fluid production and contrast material [49]. The tumors show the “cyst-with-nodule” appearance, with enhancement of the nodule, but the morphology is varying and can produce the “open-ring sign,” an incomplete rim of enhancement (Fig. 19.2).
The well-differentiated astrocytomas show no significant contrast enhancement (Fig. 19.4).

Fig. 19.4
Axial MR 3T, (a) TSE T2-w image, (b) SE T1-w image, after contrast administration. Low-grade astrocytoma. The lesion is hyperintense on T2 and doesn’t show contrast enhancement
If the lesion has a major grade of malignity (high-grade gliomas), the contrast enhancement is extremely variable and can be focal and nodular, homogeneous, or ringlike. Intraventricular, subarachnoid, or subependymal spread can be seen in this lesions. Vascular endothelial proliferation within and adjacent to the tumor and intratumoral necrosis are characteristics of glioblastoma. Central necrosis within a neoplasm will also produce a ring-enhancing lesion. Remaining residual living tissue surrounds a central zone of necrotic tumor tissue. Enhancement patterns are usually very heterogeneous, often with ringlike enhancement depicted as being thick, irregular, and nodular and surrounding necrotic areas, finding virtually indistinguishable from those seen in metastases and radiation necrosis (Fig. 19.5). The residual/remaining living tumor in the outer rime survives because it maintains a rich blood supply. This hypervascular rim can be several centimeter thick, can be irregular both outside and toward the central necrosis, and often thicker toward the cortical gray matter or basal ganglia. Quite different from an abscess, delayed imaging in a necrotic neoplasm may show progression of enhancement toward the center, from islands of islands of viable tumor that surround remaining patent vessels [49]. However, one study found that up to one third of malignant gliomas did not enhance [50]. Nonenhancing glioblastomas may reflect tumors with only scattered microscopic changes, including those that arise from and within a lower-grade astrocytoma (Fig. 19.6).


Fig. 19.5
Sagittal MR 3T, (a) SPGR T1-w image, (b) axial TSE T2-w image, (c) axial SE T1-w image. Glioblastoma with central necrosis and after contrast administration, a ring-enhanced pattern with thick and irregular rim
Fig. 19.6
Axial MR 3T, (a) TSE T2-w images, (b) SE T1-w images, (c) rCBV map, (d) rCBV graphic. Infiltrative high-grade glioma, hyperintense on T2-w images and without contrast enhancement. rCBV map shows high value of rCBV (4.17) in confront to normal white matter
Tumor enhancement characteristics and their correlation with certain genetic expressions in GBM have been the focus of many researchers. Diehn and colleagues [51] described the correlation between contrast-enhanced radiophenotype and the genetic expression of genes involved in tumor hypoxia and angiogenesis (e.g., vascular endothelial growth factor (VEGF)) and found that EGFR (epidermal growth factor receptor) overexpression was associated with a high ratio of contrast enhancement to necrosis within the same tumor. Pope and colleagues [52] showed that interleukin-8 and VEGF were overexpressed in completely enhancing tumors when compared with incompletely enhancing one. IDH1 mutation proved to be associated with non-contrast-enhancing tumors in a study by Carrillo and colleagues [53] in which they showed that imaging features including larger tumor size and non-contrast-enhancing tumors could be used to determine IDH1 mutational status with 97.5 % accuracy but can poorly predict the MGMT promoter methylation status (Fig. 19.7). However, Drabycz and colleagues [54] found that ring enhancement was associated with unmethylated MGMT-promoter status, whereas irregular and nodular enhancement has been related to methylate and secondary tumor [53].

Fig. 19.7
Axial MR 3T, (a) TSE T2-w image, (b)TSE FLAIR T2-w image, (c) TSE SE T1-w image after contrast administration. Oligodendroglioma with IDH-mutation and 1p/19q codeletion. The lesion doesn’t show contrast enhancement
19.3 Advanced MRI Techniques
19.3.1 Diffusion Imaging (DWI)
The rate of water movement, or diffusion, within the brain and other tissues is believed to be the direct reflection of the local microstructure within the tissue. Anatomic magnetic resonance imaging (MRI) can be modified in a way that makes the images sensitive to the water diffusion within tissues [54]. DWI, which is currently the only MRI technique that provides information on water diffusion, involves the use of phase-defocusing and phase-refocusing gradients to enable the evaluation of the rate of microscopic water diffusion within tissues. This approach has been shown to be sensitive to changing microenvironment such as the increased cell density that typifies growing tumors [56–59]. The gold standard for brain tumor diagnosis is light microscopy analysis of histological tissue samples. Typically definitive diagnosis and differentiation between pathological and normal tissue are achieved by examination of cell-architecture parameters, such as cell arrangement, cell density, cell-size distribution, and nucleus-to-cytoplasm size ratio. MR diffusion imaging probes water molecular diffusion over distances that correspond to typical cell sizes, and this water diffusion is also impeded by membranes, i.e., structures that are an integral part of the cell architecture. With increasing cell density, the impeding effect of membranes is expected to increase. Thus, MR diffusion imaging provides an intriguing access to information that otherwise can only be obtained by invasive light microscopy [60].
DWI has been used to grade or differentiate brain tumors based on cellularity [61]. Because the majority of the translational movement of water occurs in the extracellular space, increased cellularity or swelling should affect the apparent diffusion coefficient (ADC), causing a drop in the values [62] (Fig. 19.8). Several studies have shown that the ADC correlates well with tumor cellularity at histological examination, and calculation of the ADC together with conventional MRI may aid the characterization of cerebral tumors [56, 59, 61]. Simply stated, the higher the cell density, the more boundaries or restriction the water experiences and the lower the apparent diffusion coefficient (ADC), a value that is estimated from the DWIs. In this regard, several reports in the literature have demonstrated an inverse correlation between ADC and cell density in brain tumors [56–59]. Glioma grading and typing are crucial for prognosis, but patients with tumors of the same histopathological characterization and receiving similar treatment may display diverse outcome because of differences in the proliferative potential of disease. Assessment of tumor proliferation has therefore been suggested as an important additional predictor of tumor behavior [63]. In addition, identification of the tumor “hot spot” is important for biopsy guidance. The proliferative activity of each tumor is measured by deriving the Ki-67 proliferation index from immunohistochemical staining of tumor specimens. Neoplasms are associated with increased cellular density, resulting in decreased signal intensity on ADC images. High tumor cellularity has been associated with increased proliferative activity, as assessed by the Ki-67 index [64]. Several studies have shown that lower ADCs suggest malignant glioma, whereas higher ADCs suggest low-grade astrocytomas findings reflecting more restricted diffusion with increasing cellularity [59–65] (Fig. 19.9). The median minimum ADC of the high-grade astrocytomas is significantly lower than that of the low-grade astrocytomas [66]. Higher ADC values in intracranial tumors are attributed to low tumor cellularity, necrosis, or cysts, and lower values are attributed to attenuated highly cellular tumors [67]. These higher ADC values in lower grade gliomas may reflect an increase in the water content of the interstitial spaces [66].


Fig. 19.8
Axial MR 3T, (a) TSE T2-w image, (b) DWI image, (c) ADC map. MGMT-methylated glioblastoma. The lesion presents dishomogeneity in diffusion sequence with areas with increased ADC values, in relation to the normal white matter, and areas with low ADC, due to increasing cell density
Fig. 19.9
Axial MR 3T, (a) TSE T2-w image, (b) ADC map. Low-grade astrocytoma with MGMT methylation, no IDH-mutation and very low Ki 67 (5 %). The ADC of the lesion is higher (1.9–2.4) of contralateral cerebellar hemisphere
The commonly used b-factor is around 1000/s mm2 for the diffusion-weighted images. With this b-factor and with the typical magnetic field gradient and echo time employed on clinical MR systems, the average water molecule has several tens of milliseconds to diffuse and may migrate up to 10 micrometers in a random direction and is therefore likely to be hindered by the cell membrane or intracellular membranes [60]. Unlike normal white and gray matter, which for a normal b-factor range exhibit very similar ADC values, diffusion values observed in different tumor types are dissimilar and cover a wide range. In general, brain tumor ADC values measured over a normal b-factor range, clearly exceed ADC values of normal gray and white matter. This difference in diffusion, however, can rarely be gainfully applied to determine the extent of tumor growth within normal tissue, since tumors are often surrounded by edematous tissue, where diffusion is also elevated and thus difficult to distinguish from diffusion values representative for tumor [60]. Very high diffusion values in peritumoral edema of high-grade gliomas may reflect the destruction of the extracellular matrix ultrastructure by malignant cell infiltration [68]. On the other hand, the elevated values of diffusion coefficients in a tumor may to some extent also be the result of edema that arises inside the tumor. The brain tumor edema is vasogenic, but may also be related to failure of membrane pump systems (cytotoxic) or to transependymal movement fluid from the ventricles.
The complete absence of cell membranes in cystic lesions and the destruction of cell membranes in necrotic brain lesions create an environment where diffusion is virtually unhindered. Consequently, the diffusion constant is very high and easily distinguished from the diffusion constant of any other tissue, including tumor tissue. Large areas of necrosis can be well detected and delineated based on elevated ADC within the tumor lesion [69].
Diffusion imaging is also useful to document characteristic fluid volume changes in the intra- and extracellular compartments that occur during nonsurgical therapy of brain tumors. For gliomas, studies have shown that ADC values increase during successful cytotoxic therapy and decrease during tumor growth [70], suggesting ADC values can be used as a biomarker for brain cellularity. Tumor areas at initial stage of treatment response present transient cell swelling or ischemia with decreased diffusion values. Tissue experiencing successful response with cell lysis or apoptosis displays a characteristic increase of diffusion, meanwhile tumor areas resistant to therapy exhibit unaltered diffusion values [71]. It has also been demonstrated that changes observed during the first stage of therapy are an early indicator of the final treatment response [72]. The correct interpretation about an unresponsive to therapy tumor may facilitate a timely decision for protocol adjustment or alternative therapy.
Diffusion-weighted brain images with very high b-factors of 5000 s/mm2 or higher, which clearly depict tissue structures above the noise threshold, can readily be obtained on clinical scanners. The residual signal at very high b-values is distinctly higher. Of course, compared to images acquired at b-factors of 1000 s/mm2, there is an increased signal loss of up 90 % or more, which typically has to be compensated with a decrease in spatial resolution [60]. However, the acquisition of image data at multiple b-factors permits a more detailed analysis of the diffusion-related signal decay. Without diffusion weighting, tumor and edema cannot be distinguished and exhibit higher signal than normal white matter. With increasing diffusion weighting, the signal of the edematous tissue decreases more rapidly than the signal of the other tissue and approaches the signal level of normal white matter. Tumor tissue exhibits the slowest signal decay and shows the highest residual signal at very high b-factors. High b-diffusion-weighted imaging, although currently purely experimental, seems to provide a good differentiation in normal tissues and in different pathologies, in relation to the different diffusion signal decay observed in tissues. Serious limitations for clinical studies are currently the long scan times, low SNR, and lower resolution [60].
19.3.2 Diffusion Tensor Imaging (DTI)
Diffusion tensor imaging (DTI) is an MRI-based technique that can demonstrate white matter anatomy by measuring the directional anisotropy of water. Diffusion MRI is the first noninvasive technique for measuring white matter fiber structure in vivo [73]. In DTI analysis, a tensor model is used to represent the orientation of white matter fibers, in relation to the preferential diffusion of water in brain tissue, which decreases perpendicular to the myelin sheaths and cell membranes of white matter axons. Computation of the diffusion tensor yields for each voxel three diffusion coefficients (diffusion eigenvalues) along three orthogonal principal direction (diffusion eigenvectors). In white matter (WM), the eigenvector associated with the largest eigenvalue (principal eigenvector) defines the tissue’s fiber tract axis [74]. In voxels where one white matter fiber population is predominant, the principal diffusion direction is aligned with the white matter fiber tract direction [75]. By following principal directions of diffusion, a process called tractography [76, 77] estimates the trajectories of white matter fiber tracts. These reconstructions may then be displayed in three dimensions providing a detailed map of the configuration of the tracts and their relationship to other structures. Increasingly color code maps are used for a combined and easy to interpret visualization of anisotropy and principal eigenvector direction [78].
The most useful application of the directional dependence of the diffusion-related signal decay lies not inside the main tumor lesion, but rather within the surrounding highly structured white matter.
In patients with brain tumors, DTI can demonstrate displacement, interruption, or infiltration of white matter tracts by the tumor [79–84]. The distinction of these situations is often not possible to organize. A useful tool to understand the various scenarios is the paper by Fields et al. [85] who described four basic categories of tumor growth-related white matter changes in relation to anisotropy maps and principal eigenvector direction:


- (a)
Dislocation caused by the mass effect of the tumor and edema is showed by the loss of symmetry, the distorted appearance, and the abnormal location of tracts on the anisotropy maps. Principal eigenvector within the tract remains aligned with the tract orientation. In the absence of edema, the anisotropy within the tract is unchanged (Fig. 19.10a, b, c).
- (b)
Edema within the fiber structures is characterized by uniformly reduced white matter anisotropy, increased lateral tract dimensions, and absence of localized areas with very low anisotropy. Principal eigenvectors within the tract remain aligned with the tract orientation (Fig. 19.10d, e, f).
- (c)
Tumor infiltration or invasion is characterized by a variable degree of anisotropy reduction and principal eigenvectors that remain aligned with the tract orientation. Differentiation from edema may be difficult, but localization close to the primary tumor and evidence of high malignancy or the absence of edema on corresponding T2-weighted maps may be indicative of infiltration or invasion (Fig. 19.10g, h, i).
- (d)
Complete tract destruction by tumor tissue replacing the original white matter produces a significant loss in anisotropy and lack in coherence of the principal eigenvector directions. The tract destruction may also impress by the abrupt change of anisotropy and eigenvector directions along the tracts (Fig. 19.10j, k, l).
Fig. 19.10
Axial MR 3T, (a, d, g, h) TSE T2-w images; (b, e, h, m) FA map; (c, f, i, n) color-coded map. Possible DTI patterns in case of dislocation (a–c): distorted appearance and abnormal location of tracts on the anisotropy maps. The tract remain aligned with the tract orientation in color-coded map. Edema (d–f): uniformly reduced white matter anisotropy, increased lateral tract dimensions, and absence of localized areas with very low anisotropy. The tract remain aligned with the tract orientation. Tumor infiltration or invasion (g–i): variable degree of anisotropy reduction and principal eigenvectors that remain aligned with the tract orientation. Complete tract destruction (j–l): tumor tissue replacing the original white matter produces a significant loss in anisotropy and lack in coherence of the principal eigenvector directions
A clear differentiation is not often possible because more than one of these characteristics can be present and it has to be considered the confounding effect of edema. Due to these and other pathological changes throughout the brain, the identification of known neuroanatomy is often not straightforward in tumor patient. For Golby et al. [86] in order to define relevant anatomy, it would be useful to identify those fibers that pass within a certain distance of the tumor or which run through the tumor, as well as those associated with particular, patient specific, cortical areas such as fMRI activation or magnetoencephalography (MEG) findings. This can provide a preoperative functional brain map defining both the critical cortical functional areas and the WM tracts leading to and from these areas.
If clinically it is critically important to distinguish between cases where the lesion infiltrates the white matter and cases where the fibers are displaced by the lesion, this also determines the extent of resectability of the lesion. DTI and fiber tractography can demonstrate the orientation and integrity of white matter fibers in vivo. The metrics commonly used include the mean diffusivity (MD) and fractional anisotropy (FA). MD represents a measure of the overall magnitude of diffusion, independent of tissue orientation, similar to the ADC. FA, which is a measure of the directionality of molecular motion, is thought to reflect white matter fiber integrity [87, 88]. Normal white matter appears brighter than tumors on FA image maps due to the directional movement along white matter structures in normal brain that are often disrupted or absent in tumors. FA in brain tumors has been found to be influenced by histological characteristic and correlates with cellularity, vascularity, cell density, neuronal and axonal structures, and fiber tracts [89–91]. The decrease in FA values within brain tumors can be explained as a loss of structural organization, and a strong correlation was observed between the FA and Ki-67 index, although a clear physiological basis linking FA values with the Ki-67 labeling index remains to be determined [92]. For this reason, the DTI has been used in the attempt at differentiating tumor-infiltrated edema from purely vasogenic edema. It has been demonstrated [62] as significantly higher MD in the peritumoral edema, which surrounds metastatic tumors when compared with that in the edema surrounding high-grade gliomas. Increases in the peritumoral MD for malignant gliomas are tempered by the infiltrative rather than expansive growth patterns with the presence of tumor cells in the peritumoral abnormality. At the same way, a reduced FA in the peritumoral region of malignant glioma reflects the presence of infiltrating tumor cells, which may destroy rather than simply displace the white matter tracts [87]. Nevertheless it has been observed [93] that FA values in the tumor marginal area, but not in tumor core, differed significantly between low-grade and high-grade gliomas. This could be consequence of more extensive fiber tract destruction and accordingly lower anisotropy in high-grade gliomas than in low-grade gliomas, whereas in the center of the lesions, the fiber destruction was assumed to be more or less complete, irrespective of tumor grade.
In a recent study [94], it has demonstrated that DTI tractography could be a useful tool in predicting surgical outcome in patients with gliomas located near eloquent areas (Fig. 19.11). By establishing the presence of intact, displaced, or infiltrated fascicles, it was possible to estimate the chance of performing a total resection. Unchanged reconstructed tracts showed normal anisotropy, location, and orientation, compared with homologous contralateral tracts. Displaced tracts had a normal or only slightly decreased anisotropy and showed abnormal location or trajectories when compared with those of contralateral unaffected hemisphere. Infiltrated tracts showed substantially decreased FA with abnormal hues on directional color maps, because infiltrating tumor disrupts the directional organization of fiber tracts causing altered color patterns on directional maps (Fig. 19.10).

Fig. 19.11
MR 3T, (a, c) FA map, (b, d) DTI tractography. The FA maps show reduction of FA by the left temporo-occipital and left frontal lesions. In tractography reconstruction the fascicles have been displaced by the lesions
Other commonly derived DTI parameters are axial (AD) and radial (RD) diffusivity that represent diffusion properties along the axial and radial directions, respectively. Server et al. [95] have investigated the value of AD coefficient and RD coefficient in grading tumor. They have demonstrated that ADC, RD, and AD are useful DTI metrics for the differentiation between low-grade and high-grade gliomas with a diagnostic accuracy of more than 90 % and can be used as noninvasive reliable biomarkers in the grading of gliomas. There was a significant difference in the minimum ADC values between low-grade and high-grade gliomas. The AD coefficient and RD coefficient values were significantly higher in low-grade gliomas compared with high-grade gliomas, according to Yuan et al. [96]. In their study it was revealed a good inverse correlation between ADC, RD, AD and WHO grade II–IV astrocytic tumors. Findings related to AD and RD within tumor groups may be an indirect manifestation of the combined effects of axonal damage, demyelination, and tumor mass within the cranial compartment. ADC describes microscopic water movement parallel to axonal tracts and has been associated with axonal damage [97]. In a recent study [98], the association of RD with both demyelination and axonal damage was reported. Inano et al. [99] have developed a new method using multiple DTI-based parameters for voxel-based clustered images in a supervised manner that can be used to visually grade gliomas. By algorithms applied to DTI data, they can noninvasively predict the grade of gliomas with accuracy and may perform regional grading of glioma, which is useful for targeting biopsy, because gliomas are heterogeneous tumors. In this way the regional grading of the tumor can preoperatively be predicted, and it’s possible to establish which region must be resected, including peritumoral edematous lesions. We know that LGGs develop into HGGs and >10 % of gliomas differentiate into more malignant grades [100] but we cannot know when tumor grade progresses. By using regional grading based with the Inano et al. methods, the authors can clarify when LGGs progress into HGGs during follow-up and provide an appropriate adjuvant treatment at the optimum time.
Most diffusion tensor imaging studies that measure the directional dependence of diffusion employ b-factors up to 1000 s/mm2. Diffusion imaging at higher b-factors increases the dynamic range of directionally dependent signal variations, which can be gainfully applied to detect fibers crossing at high angular resolution. Typically, a prohibitive large number of around 250 directions or more are required to achieve a good level of confidence in measuring fiber orientations within crossings [101]. Scan time, at the moment, exceeds 1 h and volume coverage is limited. The potential for diagnostic imaging in brain tumors and improved detection of crossing nerve fiber tracts are interesting. However, further technical development is required to reduce the excessive scan times and limitation in spatial resolution.
More recently, diffusion tensor MR imaging has been used to noninvasively detect genetic characteristics of gliomas, especially the IDH1 R132H mutation [102]. High fractional anisotropic (FA) values and low apparent diffusion coefficient (ADC) values were shown in a wild-type IDH1 group when compared with a mutation group in grade II and III gliomas. The authors found that, although FA and ADC values can detect IDH1 mutation, the ratio of minimal ADC is the best measurement for this proposal.
19.3.3 Intravoxel Incoherent Motion Diffusion-Weighted MR Imaging (IVIM)
Diffusion-weighted imaging is considered very sensitive for early pathological changes of a lesion and can potentially be useful in evaluating the feature of gliomas. To overcome a limitation of DWI, in which perfusion can substantially confound diffusion measurement because of the incoherent motion of the blood, a new MR technique, intravoxel incoherent motion (IVIM) based on DWI, has been proposed in differentiating the histologic grade among human gliomas [103, 104]. The major advantages of IVIM MR imaging are as follows: it allows the simultaneous acquisition of diffusion and perfusion parameters.
The IVIM model generated parametric images for apparent diffusion coefficient ADC, slow diffusion coefficient D (or D slow), fast diffusion coefficient D* (or D fast), and fractional perfusion-related volume f. Hu et al. [104] assess the relationship between ADC, D, D*, and f, based on IVIM models and the glioma grades, and determine the cutoff values of suggested parameters for differentiating high- from low-grade gliomas. They evaluated whether the IVIM MRI could be used preoperatively to grade gliomas. There were significant differences in parameters ADC, D, D*, and f between low- and high-grade gliomas. The ADC and D are correlates with cellularity and nuclear atypia [105, 106], and their values were significantly lower in high-grade gliomas compared with low-grade gliomas, according to Iima et al. [107]. The degree of neovascularization is critical in assessing tumor grade and malignancy [108]. Malignant gliomas are characterized by increased angiogenesis, which is a marker of the histological grading system [109]. The parameter D* from the IVIM model is influenced by microvessel density within the tumor, which is associated with an average length of capillaries and blood flow velocities [110]. Several study have suggested that the relative cerebral blood volume (rCBV) value is correlated with the grade and vascularity in gliomas [111, 112], low-grade gliomas show no increase in tumor rCBV, whereas high-grade gliomas demonstrate high rCBV that in some cases even extends outside the contrast-enhancing portions of the tumor [113]. The parameter f represents the fraction of the fast diffusion component and is affected by abundance of capillaries (Fig. 19.12). In the Hu et al. [104] study, the diagnostic efficacy of IVIM parameters in differentiating glioma grades was shown.

Fig. 19.12
Axial MR 3T. (a)TSE T2-w image; (b) SE T1-w image after contrast administration, DSC MR perfusion; (c) the CBV map; (d) the MTT map; (e) the CBF map; IVIM (f) the f map; (g) the D*map; (h) the fD*map. Necrotic contrast-enhancing high-grade glioma. The CBV and f maps demonstrate a higher perfusion fraction region in the corresponding areas of contrast-enhancing compared to the healthy white matter. The D* map shows a slightly decreased fast diffusion values in the tumor tissue compared to the healthy white matter
Also for Bisas et al. [103], D, D*, and f in the high-grade gliomas demonstrated significant differences compared to the healthy white matter. D* and f showed a significant difference between low- and high-grade gliomas. D tended to be slightly lower in the WHO grade II compared to WHO grade III–IV tumors. f and D* demonstrated higher coefficients of variation than the ADC and D in tumor.
In conclusion the IVIM-fitted post-processing of DWI signal decay in human gliomas could show significantly different values of fractional perfusion-related volume and fast diffusion coefficient between low- and high-grade tumors, which might enable a noninvasive WHO grading in vivo.
19.3.4 Perfusion
Perfusion is physiologically defined as the steady-state delivery of blood to an element of tissue. The term “perfusion” is also used to emphasize contact with the tissue or, in other words, capillary blood flow [114].
There are two major approaches to measure cerebral perfusion with MRI. The first is application of an exogenous, intravascular, nondiffusible contrast agent, usually a gadolinium-based contrast agent that emphasizes either the susceptibility effects of gadolinium-based contrast agents on the signal echo, namely, first-pass dynamic susceptibility contrast-enhanced (DSC) MR perfusion or the relaxivity effects of gadolinium-based contrast agents on the signal echo, namely, dynamic contrast-enhanced (DCE) MR perfusion. The second is application of an endogenous contrast agent using magnetically labeled arterial blood water as a diffusible flow tracer in arterial spin labeling (ASL) MR perfusion.
Dynamic susceptibility contrast-enhanced MR perfusion (DSC MR perfusion) is a technique in which the first pass of a bolus of gadolinium-based contrast agent through brain tissue is monitored by a series of T2-or T2*-weighted MR images. The susceptibility effect of the paramagnetic contrast agent leads to a signal loss in the intensity-time curve. Using the principles of the indicator dilution theory, the signal information can then be converted into a contrast medium concentration-time curve on a pixel-by-pixel basis. From these data, parametric maps of cerebral blood volume (CBV) and flow (CBF) can be obtained. Regional CBF and CBV values can be measured by region of interest analysis (Fig. 19.13e, f).


Fig. 19.13
Axial MR 3T, (a) TSE T2-w image, (b) SE T1-w image after contrast administration, (c, d)ASL images, (e, f) rCBV map and graphic derived from GE-DSC perfusion, (g, h) K2 map and rCBV map corrected in function to permeability. MGMT-methylated glioblastoma. The lesion is hyperperfused in all images. The hyperperfused area in rCBV map corrected is larger than the same area in rCBV map uncorrected
Dynamic contrast-enhanced MR perfusion (DCE MR perfusion) is based on the acquisition of serial T1-weighted images before, during, and after administration of extracellular low-molecular-weight MR contrast media, such as gadolinium-based contrast agent. The resulting signal intensity-time curve reflects a composite of tissue perfusion, vessel permeability, and extravascular-extracellular space [115]. DCE MR perfusion imaging depicts the wash-in, plateau, and washout contrast kinetics of the tissue, providing insight into nature of the bulk tissue properties at the microvascular level. With pharmacokinetic modeling of DCE MR perfusion data, several metrics are commonly derived: the transfer constant (ktrans), the fractional volume of the extravascular-extracellular space (v e), the rate constant (kep), and the fractional volume of the plasma (v p).
Arterial spin-labeling MR perfusion (ASL MR perfusion) is a method that uses magnetically labeled blood as an endogenous tracer. There are two main types of ASL technique: continuous ASL and pulsed ASL [116, 117]. In continuous ASL, there is a prolonged radio frequency pulse that continuously labels arterial blood water below the imaging slab until a steady state of tissue magnetization is reached [118]. In pulsed ASL, a short radio frequency pulse is used to label a thick slab of arterial blood at a single point in time, and imaging is performed after a period of time to allow distribution in the tissue of interest [119]. A new technique, called “pseudocontinuous ASL,” represents a compromise between pulsed ASL and continuous ASL. This technique may provide improved balance between labeling efficiency and signal-to-noise ratio (SNR) compared with conventional ASL methods [120]. This method is considered completely noninvasive, and it allows the determination of absolute quantitative values of CBF, in contrast with DSC MR perfusion (Fig. 19.13c, d). It is also insensitive to permeability.
In general DSC and DCE MR perfusion achieve a substantially higher SNR that allows imaging at a higher temporal and spatial resolution, and DSC MR perfusion allows the visualization and quantification of the whole brain in less than a minute of acquisition time. ASL has a limited SNR and much longer scanning time.
Clinically, established methods for quantitative perfusion measurement usually include normalization of the mean or maximum perfusion values in the tumor region in relation to mean values in normal appearing white matter. Normalized rCBV measurements are considered to be the clinical standard [121]. However, white matter is often affected by treatment and/or edema or may invaded by diffuse tumor growth. In these cases the cerebellum could be used as a reference region [122].
One of the characteristics of brain tumors, irrespective of grade, is to produce a mass effect, which compresses the microcirculation in the normal tissue around the lesion and alters the permeability properties of vessels, including those that feed the tumor. In addition, high-grade gliomas also generate new blood vessels, which have very abnormal physiologic properties, including the peculiarity of allowing fluid from the intravascular compartment to seep through them. This occur indiscriminately within and around the tumor [60].
Hypoxic tumors tend to grow and metastasize faster than well-oxygenated tumors, and to be more resistant to radio- and chemotherapy [123]. In high-grade gliomas, the extent of tumor hypoxia is correlated with time to progression and overall survival [124]. Tumor secures their supply of oxygen and other nutrients by stimulating tissue angiogenesis, and the extent of vessel formation is closely related to tumor development and is in indirect marker of high malignancy and aggressiveness. The effects of vascular endothelial growth factor/vascular permeability factor (VEGF/VPF) and other growth factors on vascular perfusion and permeability have studied since Folkman J. (1971) first described the association of tumoral growth with angiogenesis [125]. Perfusion and permeability magnetic resonance (MR) imaging can now measure parameters such as CBV e Ktrans, which can be directly correlated with these histopathologic changes as well as molecular markers such as VEGF [126, 127]. rCBV have been shown to correlate reliably with tumor grade and histologic findings of increased tumor vascularity [128, 131]. The degree of vascular proliferation, or angiogenesis, is one of the most important histologic criteria for determination of the degree of malignancy of a glioma. Vascular networks are not only the principal route for delivery of oxygen and nutrients to the neoplastic cells but also serve as paths for tumor infiltration along perivascular spaces. The cerebral capillary endothelium, site of blood-brain barrier, is frequently destroyed by malignant tumor cells. A hypermeable blood barrier associated with or without immature angiogenic vessels allows for contrast agent enhancement, extravasation, and, hence, measurement of vascular permeability [132]. These pathophysiologic changes have been shown to provide good correlation between tumor biology and rCBV, CBF, CBV Ktrans, and Vp measurement. Due to an increase in CBV from microvascular density, as well as many collateral and tortuous vessels, from angiogenesis, it is felt that the mean transit time (MTT) should be prolonged. However, because of the immense heterogeneity of the tumor microvasculature in some regions, MTT may also decrease due to increased CBF, particularly at the tumor margins, where there is rapid shunting of blood flow [133]. There have been numerous publications demonstrating a good correlation between the value of rCBV and tumor biology. Comparison of rCBV measurements between LGG and HGG has demonstrated LGG to have maximal rCBV values of between 1.11 and 2.14 and HGG to have maximal rCBV values of between 3.54 and 7.32 [67, 129, 130, 134]. A larger study demonstrated LGG to have rCBV values of 2.14 and HGG to have rCBV values of 5.18 [129]. DSC MR imaging increases the sensitivity and predictive value in predicting glioma grade compared with conventional contrast-enhancement MR imaging.
In clinical practice, 95–100 % sensitivity has been reported for differentiating HGGs from LGGs using threshold of 1.75 and 1.5 for rCBV, respectively [129, 135].
The role of VEGF, also known as VPF, as a mediator of tumor growth and angiogenesis has also resulted in several investigators demonstrating a good correlation between vascular permeability and glioma grade. It seems clear, however, in part due to the heterogeneity of glioma vasculature that the regions of increased rCBV are spatially heterogeneous and different to areas of increased permeability [136, 137].
Previous studies have demonstrated no correlation between rCBV and low- versus high-grade gliomas [138] and no statistical difference in rCBV between grade I and II, grade II and III, and grade III and IV gliomas [139]. The disparity of these findings suggests that careful attention must be paid to the rCBV computation process, and one point of differing methodology involves contamination of derived concentration-time data by contrast agent extravasation [140]. When confined to intravascular space, paramagnetic contrast agents (Gd-DTPA) produce signal intensity loss in the extravascular space on T2-weighted scan, and susceptibility contrast-based rCBV maps are computed by integrating the resulting transverse relaxivity changes that occur over a dynamic first-pass injection. However, because Gd-DTPA is also an effective enhancer, the susceptibility-contrast signal intensity loss can be masked by signal intensity increase in region where T1 effects are significant. This occurs in enhancing tumors, where Gd-DTPA extravasates into the interstitial space of lesions with significant blood-brain barrier breakdown. In such instances, rCBV will be underestimated, which may affect tumor grade prediction (Fig. 19.14). Boxerman et al. [140] use a linear fitting to estimate the T1 contamination due to agent extravasation and, by removing the leakage term, allow generation of both corrected rCBV maps and first-order estimate of vascular permeability. In this way they show that rCBV corrected for contrast agent leakage correlates significantly with histopathologic tumor grade, whereas uncorrected rCBV does not (Fig. 19.15).


Fig. 19.14
MR 3T, (a) rCBV map and (b) corrected rCBV map, derived from GE-DSC perfusion. The values of regions of interest (blue and white circles) placed in the lesion are in uncorrected rCBV map 3.98–3.99, compared to the healthy white matter, in the corrected map they are 5.7–6.1
Fig. 19.15
MR 3T. (a) Axial SE T1-w image after contrast administration; (b) uncorrected CBV map, derived from GE-DSC perfusion; (c) CBV corrected in function to AIF (arterial input function); (d) CBV map corrected in function to permeability. Glioblastoma with central necrosis. CBV is higher (red color) around the necrotic area in rCBV corrected map
Another problem is the kind of sequence to use. GE-EPI acquisition is sensitive to vessels of all size, as opposed to SE acquisition, which has peak sensitivity to capillary-sized microvessels [141]. Although early reports documented significant correlation between SE rCBV and tumor grade [134], this has been refuted subsequently by Donahue et al. [142] and Schmainda et al. [143], who demonstrated that GE- but not SE-derived rCBV maps significantly correlate with tumor grade. This would seem to underscore the fact that the neovascularity characteristic of aggressive, high-grade tumors often consists of disorganized, large-scale microvessels that do not have feature typical of capillaries and would therefore be best interrogated with GE acquisition possessing wide-range microvascular sensitivity that can distinguish tumor angiogenesis from normal capillary beds. For these reasons, GE acquisition should be used for tumor perfusion studies because GE-based rCBV will be a statistically significant predictor of tumor grade [140]. Of course, GE acquisition are also sensitive to macrovessels, which must carefully excluded from the regions of interest used to compute rCBV and estimate tumor grade.
Related posts:

Stay updated, free articles. Join our Telegram channel

Full access? Get Clinical Tree


