Fig. 18.1
Biomarker model for AD (Adapted from http://adni.loni.usc.edu/study-design/background-rationale/). Abbreviations – PET positron emission tomography, CSF cerebrospinal fluid, MRI magnetic resonance imaging, FDG 18F-2-fluoro-2-deoxy-D-glucose, MCI mild cognitive impairment
To date, results for differential diagnosis and estimation of disease progression based on MRI analysis still refer to groups of patients and cannot be transferred for assessing single patients [6]. Hence, it should be pointed out that two different approaches for discussing results of AD neuroimaging are possible. The first one is to discuss results obtained from groups of patients in experimental settings. The second approach is to discuss the clinical applications of these techniques.
MRI allows quantitative estimation of brain features in a non-invasive way through conventional and advanced techniques, such as brain morphometry, volume estimation, diffusion-weighted imaging (DWI) (and its most frequently used fitting model, diffusion tensor imaging (DTI)), magnetisation transfer, relaxometry, perfusion-weighted imaging (PWI), MR spectroscopy and functional MRI. These advanced techniques are affected by the amount of information that the scanner is able to provide (e.g. signal-to-noise ratio or SNR) and require data post-processing. In MRI, the signal depends on the amount of protons recruited by the magnetic field. The larger the amount of recruited protons, the greater the increase in signal with higher SNR (keeping other parameters constant).
In subsequent refinements of Dubois’ diagnostic criteria [7, 8], AD diagnosis has been simplified, requiring the presence of an appropriate clinical AD phenotype (typical or atypical) and a pathophysiological biomarker consistent with the presence of Alzheimer’s pathology. In their latest version [8], it was pointed out that, while biomarkers of tau or amyloid pathology possess the necessary specificity for diagnosing AD over the entire disease continuum, downstream topographical markers of brain regional structural and metabolic changes, such as volumetric MRI and FDG-PET, would be more useful in measuring disease progression, rather than being part of the diagnostic algorithm.
In the following sections, we describe advanced MRI findings in MCI and AD and their role in the search for reliable markers for the entire disease continuum.
18.2 Rationale in Imaging Neurodegenerative Diseases
In order to focus on problems of imaging neurodegenerative diseases, it might be useful to start from some basic observations on such diseases, correlating pathology with diagnostic imaging.
Generally, neuropsychological impairment of neurodegenerative diseases is due to biochemical alterations, structural abnormalities and circuit impairment, which are related to one another. Biochemical changes occur earlier than histological and macroscopic alterations, preceding clinical symptoms.
In AD, neuronal loss is more prominent in temporal and parietal lobes, particularly in the entorhinal cortex, hippocampus and amygdala, with volume reduction of the brain and enlargement of cerebrospinal fluid (CSF) spaces [9]. Areas of neuronal loss vary according to the underlying disease: AD patients have significantly smaller left temporal lobes and parahippocampal gyri than those with dementia with Lewy bodies [10–12]. In addition, volume loss and cognitive impairment have been shown to be associated with genotype, particularly with the apolipoprotein E (APOE) ε4 allele [13–17]. Volume loss of hippocampal formation, which correlates with functional impairment, has been observed in preclinical AD patients, and volume loss rate is predictive of disease progression [18–23]. The volume of entorhinal cortex predicts development of AD [24–26]. In addition, and as a consequence of neuronal loss, there is a deafferentation with degeneration of white matter (WM) and reduction of connectivity between cerebral regions. Basal ganglia ferritin iron levels are increased in AD [27].
In clinical settings, a standard MRI protocol in neurodegenerative disease includes T1-weighted, proton density (PD) and T2-weighted images in, at least, axial and coronal planes. However, in order to reliably assess brain atrophy, three-dimensional T1-weighted scans, as magnetisation-prepared gradient echo (MPRAGE) sequences, are essential for assessing brain atrophy. Finally, fast fluid-attenuated inversion recovery (fast FLAIR) sequences can replace PD images and provide, even automatically, an estimate of the white matter (WM) lesion load in ageing, vascular disease and dementia [28].
Routine MRI investigates gross structural changes only, allowing the assessment of brain atrophy and vascular lesion load and differential diagnosis with other diseases causing dementia. MRI is crucial for excluding tumours and infectious and inflammatory diseases, providing two items of information: whether chronic ischaemic damage is present, which is included in the differential diagnosis of dementia, and a qualitative appraisal of brain atrophy by visually assessing enlargement of perivascular and subarachnoid spaces (Fig. 18.2). Visual assessment has been proven to be specific in differential diagnosis between AD and other dementias, particularly if combined with neuropsychological assessment [29]. However, in assessing single individuals, visual estimation of brain atrophy in the early stages may not be sensitive and specific enough, because atrophy occurs when dementia signs are already present. In addition, in single patients, brain atrophy is not predictive of disease progression and does not provide an accurate quantification of potential response to therapy. Hypointense signal in basal ganglia is often present in gradient echo and PD-T2 images due to accumulation of calcium and iron. Subcortical hyperintense lesions in T2-weighted and FLAIR images can be present and should be considered as ischaemic damage, which is superimposed on brain atrophy. These lesions are not associated with but contribute to cognitive impairment [30–32]. Periventricular hyperintense areas in T2-weighted images should be considered as atrophic damage and are not associated with vascular risk and dementia [31, 33].

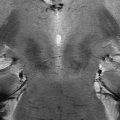
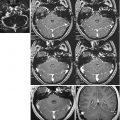
Fig. 18.2
Axial T2-weighted images obtained with a 3 T MR scanner at different levels showing moderate brain atrophy with enlargement of subarachnoid spaces and ventricles
In summary, in single individuals, conventional MRI does not allow early and accurate diagnosis, prediction of disease progression or quantification of potential response to therapy. Based on such findings, indications for conventional MR imaging can be as follows:
- 1.
To differential diagnose other dementias.
- 2.
To identify concurrent diseases that may induce dementia.
- 3.
To quantify brain atrophy. This is performed in daily practice by subjective visual estimation, but automated tools exist that allow an accurate estimation of regional brain volume and atrophy rates.
- 4.
To perform early diagnosis of degenerative disease.
The latter aim is challenging because early changes in degenerative diseases are clinically silent and patients undergo MRI only if at least mild cognitive impairment (MCI) is present. On the other hand, conventional techniques have a low sensitivity for mild volume loss: only gross structural changes are assessed in routine practice. In conclusion, routine MRI neuroimaging may be unsuitable for the latter points, especially if the acquired sequences are not appropriately designed to provide morphometric information.
18.3 Advanced Magnetic Resonance Techniques
In the last decade, introduction of high-field (3 T) and ultra-high-field (7 T) MRI scanners has provided several advantages over lower-field magnets: first, these scanners increase signal, spatial resolution or scan time, respectively, by keeping other parameters constant; second, they enhance susceptibility effects (T2* effects), which are useful for assessing blood products and for the blood oxygen level-dependent (BOLD) technique (on which functional MRI is based); and third, they increase the chemical shift effect, which is the basis of MR spectroscopic techniques. Subtle changes in several different indicators can be investigated through the use of advanced MRI techniques, and these indexes may provide complementary information regarding tissue alterations.
18.3.1 Volumetry
In patients with AD, assessment of brain volume and presence of atrophy in the entorhinal cortex, hippocampus and amygdala have been extensively investigated through a variety of volumetric techniques [34–41]. MRI volumetry is relatively easy to perform, since it relies on conventional morphological images. Three-dimensional acquisitions with high spatial resolution provide, of course, more accurate estimates of regional volumes, especially since the introduction and diffusion of 3 T scanners.
There is a very high correlation between hippocampal volumes assessed with MRI and number of neurons measured in histology samples, demonstrating that volumetric measurements of the whole hippocampal formation obtained by using MRI can reach a high accuracy [42], and for this reason, they provide reliable indexes for longitudinal monitoring of brain tissue atrophy, globally or in temporal regions of interest.
Hippocampal atrophy, in particular, is generally considered as the most characteristic finding in AD, and several studies have also reported its presence in many subjects with MCI. Thus, measurements of hippocampal volumes have been proposed as reliable markers for improving diagnostic accuracy since the earliest stages of AD [43, 44]. The introduction of large clinical cohorts, such as the Alzheimer’s Disease Neuroimaging Initiative (ADNI) [45], stimulated a refinement of the methods used for quantification of hippocampal atrophy (for an extensive review, see [46]). However, sensitivity and specificity estimates of hippocampal atrophy reported for the differentiation of patients with AD from cognitively normal subjects rarely exceed 90 %. Furthermore, for what concerns for early diagnosis of AD or the identification of subjects with an increased risk to develop the disorder, hippocampal atrophy still appears to be rather limited in sensitivity and specificity, with values not exceeding 80 %.
Most recent studies have concluded that hippocampal volume measurements can provide meaningful clinical insight and added value if the analysis procedure takes into account longitudinal information [47], which is in line with the latest update to AD diagnostic criteria, suggesting that MRI measures are more suitable for disease monitoring than for early disease diagnosis [8].
In conclusion, with current available acquisition techniques and processing methods, the assessment of hippocampal atrophy suffers from pitfalls that limit its use for screening purposes and/or for substituting other clinical examinations [41]. These limitations are not only methodological, since other pathological processes, different from dementia, might hamper hippocampal integrity.
An alternative to specific region-of-interest approaches, in the search for AD neuroimaging correlates, is represented by whole-brain methods, such as Voxel-based morphometry (VBM), which is based on T1-weighted images. In VBM, a voxel-by-voxel comparison is carried out across the entire brain, to search for regions in which tissue density is different between patients and a reference control group [48]. By using VBM, patients can be monitored over time in order to assess progression rates of density reduction [49–51]. With currently available tools, components of the brain (WM, CSF and grey matter (GM)) can be segmented automatically, and relative volume loss can be assessed in different brain regions without any a priori hypothesis on where to find group differences [52–54]. Corrections with total intracranial volume can be performed in order to reduce interindividual variability, although intracranial volume is not associated with AD [55, 56].
Estimation of brain atrophy has helped in predicting conversion from MCI to AD [50, 57]. Comparison over time of atrophy after registration of serial MRI might be a potentially powerful method to monitor progression of AD in clinical trials [58, 59]. Cortical pattern matching (CPM) is a more accurate method, in which homologous areas of the brain are compared between two groups. CPM uses brain sulci as references for defining homologous areas of the brain, overcoming interindividual variability of brain anatomy [60].
A recent meta-analysis of VBM studies about the neurostructural predictors of conversion from MCI to AD [61] comprised a total of 429 MCI subjects, of which 142 converted to AD. A significant cluster of GM volumetric reduction was found in MCI patients who converted to AD, located in the left hippocampus and parahippocampal gyrus. Authors concluded that left medial temporal lobe atrophy is the most consistent neurostructural biomarker to predict conversion from MCI to AD.
18.3.2 Diffusion Imaging
DWI depicts random motion of water molecules, which varies according to the number of microscopic structures hindering this motion. Diffusion is restricted in cytotoxic oedema, in which water goes from interstitium to intracellular spaces, where diffusion is hindered, reducing the size of the interstitium. Thanks to brain tissue characteristics, DWI represents the best technique to study WM microstructure in vivo. For this reason, it has been widely used in the search for further insights into the microstructural vulnerabilities associated with preclinical, prodromal and advanced AD.
In addition to simple quantification of water motion, gradient-encoded sequences measure water diffusion in several directions. Using spatially encoded DWI scans, the prevalence of diffusion along a direction, e.g. along a fibre bundle, can be expressed in terms of anisotropy. The most diffuse technique for DWI processing is diffusion tensor imaging (DTI), which allows for the extraction of parameters like fractional anisotropy (FA), a value between 0 and 1 indicating the degree of diffusion anisotropy at each voxel associated with integrity of myelinated fibre bundles (i.e. the diffusion along intact fibre bundles, or axial diffusivity (DA), is greater than diffusion perpendicular to fibre bundles, or radial diffusivity (DR)), and mean diffusivity (MD), which reflects the integrity of microstructures like cellular membranes.
Albeit AD has traditionally been described as a disorder mainly affecting brain GM, WM damage has also been reported, not only in advanced stages but also earlier in the disease (i.e. in MCI patients and individuals at high risk of AD). There are two principal theories that aim to motivate this phenomenon: the first one, known as “retrogenesis hypothesis”, postulates that WM degeneration begins in tracts that myelinate later in ontogenetic development, due to loss of oligodendrocytes and myelin breakdown in AD [62, 63]. The second model, known as “Wallerian degeneration”, posits that the progression of axonal damage parallels adjacent GM pathology (i.e. atrophy) [64].
In general, AD has been associated with widespread reductions in FA and increases in MD in several brain regions. In particular, the WM of frontal and temporal lobes seems to be the most affected, with evidence of axonal injury also found in major WM tracts, such as the corpus callosum, the cingulum, the uncinate and superior longitudinal fasciculi, and, in general, in tracts associated with the medial temporal lobe [65, 66]. DTI studies have reported that, in the early stages of the disease, individuals with AD had more severe WM abnormalities in the late-myelinating association fibre pathways, compared with early-myelinating fibres, in accordance with the retrogenesis hypothesis [67]. On the other hand, other studies concluded, instead, that the patterns of WM damage in AD seems more suggestive of the Wallerian degeneration process [68, 69]. Thus, evidence from existing literature does not highlight a clear winner between the two theories.
For what concerns MCI, currently considered a prodromal stage of AD, FA and MD differences have been found, compared to healthy controls, that largely mirror the results seen in AD, but they are not as extensive nor reproducible across different studies. In fact, inconsistent results have been reported in MCI, ranging from no significant changes in FA [70, 71] to specifically localised and isolated reductions [72] and to more widespread alterations [73, 74]. A recent meta-analysis [75] reviewing DTI studies in patients with AD and MCI found that FA was decreased in AD in all regions except parietal WM and internal capsule, while patients with MCI had lower values in all WM regions except in parietal and occipital lobes. MD, instead, was increased across all brain WM in AD, while in MCI occipital and frontal regions were spared.
It has also been suggested, as a possible explanation to inconsistencies across studies, that FA alone may be an insensitive measure for assessing early WM damage or disease progression in patients with AD [76, 77]. To investigate further the potential of DTI scalars of unravelling WM pathology in AD, values of axial and radial diffusivities have also been included in diffusion analysis of WM in MCI and AD [78, 79].
However, it is worth reminding that DTI is an oversimplified model of diffusion; hence, the interpretation of scalar indexes derived from the tensor (FA, MD, DA, RD) may become uncertain in those brain regions where complex fibre configurations occur (e.g. crossing fibres) [80]. Tract-based spatial statistics (TBSS) is a technique that allows comparison of DTI metrics over the major WM tracts. It was introduced [81] to partially overcome not only imprecise modelling of diffusion due to complex fibre configurations but also misalignment across images from the different subjects that have to be compared. By combining multiple DTI-derived indices, recent TBSS investigations have attempted to distinguish between WM tract changes induced by Wallerian degeneration and those that support the retrogenesis models of MCI and AD [67, 82, 83], reporting interesting findings. In particular, TBSS analysis in AD patients confirmed the widespread decreases in FA along tracts already identified in the literature [65, 66]. FA abnormalities in MCI, instead, lied in an intermediate range between controls and patients with AD [84]. Values of MD, DA and DR were found increased in tracts associated with the memory circuit in AD. The pattern of changes in diffusivity measures was more widespread than the pattern characterising FA reductions. In support of Wallerian degeneration, WM disruption in AD was predominantly adjacent to regions with reduced GM densities [76]. On the other hand, reduced FA and higher DR were also found, likely reflecting demyelination in late-myelinating association fibres, and have been demonstrated in AD, supporting the theory of retrogenesis [67].
Another approach that can be used to increase the interpretability of DTI indexes is to focus on highly directional, large WM bundles, thus partially avoiding the incidence of voxels with crossing fibres. This is similar to TBSS, which involves whole-brain WM tracts but requires the definition of a specific tract as region of interest. Among all the fibre bundles in the brain, the corpus callosum has the unique characteristic of conveying fibres that connect several different cortical areas between the two hemispheres. Thus, analysis of its midsagittal profile can provide useful information, albeit indirect, regarding the topographical distribution of alterations in the cortex. By combining VBM and DTI, it was found that AD patients compared to healthy subjects presented alterations in volume and diffusion characteristics that were widespread in the bundle: in particular, WM density was reduced in the genu, posterior midbody and splenium, FA and DR were altered in the anterior portion, and DA was increased in the posterior subregion. In contrast, patients with MCI showed only reduced WM density in the anterior corpus callosum, suggesting an earlier involvement of this portion, in line with the retrogenesis hypothesis (frontal fibres myelinate later in physiological brain development), while Wallerian degeneration in posterior subregions of the corpus callosum occurs when AD pathology reaches a more advanced stage [85].
In the last few years, the most advanced methodological approaches designed to overcome DTI limitations have been named high angular resolution diffusion imaging (HARDI) techniques [86]. Most of these, however, showed no feasibility in clinical settings, due to the extremely long acquisition times. Diffusion kurtosis imaging (DKI) is, of all HARDI techniques, the most promising and the most frequently employed to study neurodegenerative diseases [87, 88], since it is acquirable within the timeframe of clinical examinations, even on 1.5 T scanners [89]. Briefly, DKI extends the concept of conventional DTI by estimating the diffusional kurtosis [90], i.e. the non-Gaussian component of water diffusion. Large kurtosis reflects a high degree of microstructural complexity (e.g. crossing fibres, presence of different populations of cells), and it increases with diffusion heterogeneity (i.e. the presence of distinct water compartments with different diffusion properties). DKI can provide complementary information to that carried by conventional DTI, with potentially improved sensitivity to pathological changes as well as better characterisation of various brain regions [91]. So far, DKI has outperformed DTI under several aspects: in the study of mainly isotropic GM regions, where FA meaningfulness is limited, in providing a better description of microstructural tissue organisation and in interpreting changes in a more meaningful fashion from a neurobiological point of view [92–94].
A recent investigation combined both DKI and DTI indexes in AD, MCI and healthy controls [88] and found that DKI indexes in the anterior corona radiata could discriminate MCI patients from controls and that DA in the hippocampus was the best overall discriminator of MCI from AD patients. This study, along with others employing DKI [94], suggests that this novel method may be useful in developing biomarkers for the clinical staging of AD.
18.3.2.1 Whole-Brain Structural Network Disruptions in AD
Diffusion imaging also represents the basis for fibre-tracking techniques, which aim to reconstruct major WM pathways assuming that the preferential direction of water diffusion is parallel to nervous bundles. Both deterministic and probabilistic fibre-tracking approaches have been utilised in MCI and AD [95–101]. Tractography is useful for improving knowledge about the topographical distribution of diffusion indices along the entire profile of the major limbic and association pathways. Moreover, probabilistic tractography could help to adequately evaluate diffusion changes in regions characterised by of crossing fibres [102]. By using DTI-based tractography to reconstruct all possible links between different brain regions (whole-brain tractography), a surrogate indicator of structural connectivity can be obtained. This is of particular interest, since AD has increasingly been recognised as a disconnection syndrome, characterised by large-scale structural disruptions of the brain pathways, which results in cognitive impairment that involves several different functions. Since the notion of the human connectome has been introduced to define the structural and functional connectivity of the brain, system-level methods have been used to study the pathogenesis of prodromal and syndromal AD. In the framework of graph theory, the brain is idealised as a complex network (i.e. graph), composed of nodes (i.e. brain regions) connected by links (i.e. connectivity between regions). Complex networks are also characterised by a certain number of highly connected nodes (named “hubs”) [103, 104]. The graph theoretical approach allows the analysis of several quantitative measures never exploited before, which characterise brain topology in terms of network efficiency (global or local), aggregation and segregation (for a more detailed explanation of the metrics, see Chap. 8). Graph theoretical methods have been used in DTI datasets to demonstrate the presence of abnormal topological properties in whole-brain structural brain networks in MCI and AD. The main findings of these studies suggest that loss of efficiency in communication between distinct brain regions occurs in AD, a loss that could be driven by altered nodal efficiency (i.e. importance of the node for communication within the network) of frontal and temporal regions (Fig. 18.3) [104, 105].

Studies of disrupted global network organisation in MCI [106] suggest that global changes in brain network topology are seen in late MCI, whereas more subtle and localised changes in brain network topology are seen in earlier stages of AD or when cognitive impairment in MCI is limited to one domain.
Using DTI tractography on APOE ε4 carriers versus noncarriers, several connectivity abnormalities were found in the precuneus, medial orbitofrontal and lateral parietal cortices of these individuals at high risk of AD [107]. Using graph analysis, also increased amyloid burden was found to affect connectivity measures of whole-brain networks in the preclinical stages of AD [108].
18.3.2.2 Caveats for Network Analysis
Network analyses offer a promising new approach to track and understand disease progression. However, one has to bear in mind that the analysis of complex brain network depends on the methods used to estimate structural connectivity between different regions. In order to estimate the extent to which different tractography methods could influence graph theory results in AD, a recent study compared several tractography and feature extraction methods to see which ones gave best diagnostic classification for 202 subjects with AD, MCI or normal cognition, all part of the ADNI project [109]. Authors carried out a computationally heavy task, in which they computed whole-brain tractography using nine different methods – probabilistic and deterministic, based on DTI or HARDI reconstructions of diffusion data. Classification performance, however, seemed not influenced by the different algorithms used to reconstruct brain networks. However, performing principal component analysis on networks helped classification in some cases.
18.3.3 Other Advanced Techniques
Several other MRI techniques might be useful indicators of microstructural changes. Magnetisation transfer is based on signal loss induced by macromolecules. MT ratios in the hippocampus and cortical grey matter are significantly lower in patients with AD than in those with non-AD dementia and in control subjects [110–113].
Magnetic resonance perfusion is based on signal changes during the passage of contrast material or spin-labelled protons through a slice with a T2*-weighted scan. A significant blood flow reduction has been observed in AD patients in respect to healthy controls [114, 115].
Absolute T1 and T2 maps may be useful to increase reproducibility and to perform comparisons over time. In addition, relaxation values have been used for automatic segmentation of brain structures, which is particularly useful for quantifying atrophy.
Molecular and metabolic imaging with MR spectroscopy (MRS) quantifies several biochemical markers. AD is associated with decreased metabolism of the brain. MRS (Fig. 18.4) shows a reduction of N-acetylaspartate over time before volume reduction occurs [116–119] and an increase in myo-inositol [120, 121], suggesting these markers are predictors of cognitive impairment [122]. However, MRS techniques are limited by poor spatial resolution, and precise quantification is cumbersome. In addition, unless absolute quantification is performed, no references exist, and the voxel values are expressed through ratios within and between voxels.

Fig. 18.4
MR spectroscopy obtained with a 3 T MR scanner with a TE = 135 ms sequence, clearly showing the reduction of N-acetylaspartate/creatine peak ratios compared to normal individuals
Differences of extension and signal intensity of cortical activation in functional MRI (fMRI) were observed between MCI, AD patients and control groups [123, 124] and between groups of patients with different phenotypes [13, 125]. Functional MRI might provide substantial information for assessing disease progression in groups and predicting neuromodulation and effects of drugs. However, group analysis results can hardly be transferred in single individuals for clinical routine. Hardware should be suitable for such investigations, operators should be experienced in fMRI, and image scanning and analysis are expensive for uncertain responses. In the last few years, the concept of human connectome was applied to fMRI data to assess functional connectivity [126]. In this case, connections between brain regions are not represented by “virtual fibres” reconstructed through a tractography algorithm but by correlations between the time series extracted from any pair of regions. Functional connectomics has the advantage, above its structural counterpart, of being less computationally heavy and thus easier to perform. Very recently, the brain’s functional network architecture was investigated using resting-state fMRI (rs-fMRI) [126] to analyse whole-brain topological organisation in patients with AD APOE ε4 carriers and noncarriers. Whole-brain graph analyses revealed that, in APOE ε4 carriers, significantly disrupted whole-brain topological organisation was present. Interestingly, changes in network topology exhibited significant correlations with the patients’ cognitive performances.
Related posts:
 High-Field Neuroimaging in Parkinson’s Disease
 7 T MR: From Basic Research to Human Applications
 Use of fMRI Activation Paradigms: A Presurgical Tool for Mapping Brain Function
 3.0 T Perfusion MRI Dynamic Susceptibility Contrast and Dynamic Contrast-Enhanced Techniques
 3.0 T MR Angiography
 Standard 3.0 T MR Imaging
Stay updated, free articles. Join our Telegram channel

Full access? Get Clinical Tree


