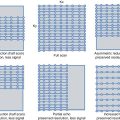
DSC
DCE
ASL
Full term
Dynamic susceptibility contrast
Dynamic
contrast enhanced
Arterial spin labeling
Bolus handling
Bolus tracking
Bolus passage
Bolus tagging
Acquisition point
First pass of contrast agent
Accumulation of contrast agent
Accumulation of tagged blood
Exogenous/endogenous
Exogenous
Exogenous
Endogenous
Contrast agent
Gadolinium chelate
Gadolinium chelate
Without contrast agent
Tracer model
Nondiffusible blood pool tracer
Flow or permeability-limited diffusible tracer
Diffusible tracer
Relaxation mechanism
T2/T2* relaxation
T1 relaxation
Magnetic labeled blood T1 relaxation
Effect
Increased susceptibility effect
T1-shortening effect
Blood magnetization inversion
Signal behavior
Decreased signal
Increased signal
Subtracted signal
The first group of techniques (exogenous tracer methods) includes dynamic susceptibility contrast (DSC)-MRI and dynamic contrast-enhanced (DCE)-MRI, while the second group (that uses endogenous tracer) includes arterial spin labeling (ASL) [5].
Exogenous tracer methods for perfusion MRI (DSC and DCE) use a model assuming that the tracer is confined to the intravascular compartment and does not diffuse to the extravascular space [1, 3–5]. Both techniques involve the rapid intravenous injection of a magnetic resonance contrast agent (gadolinium chelate) and the serial measurement of induced signal modification. Both DSC and DCE are patterned after tracer kinetic models of tissue perfusion, which utilize a tracer (gadolinium chelate), track the tracer through the tissue, and then analyze its ingress/egress [5].
DSC utilizes the T2* effect of a bolus of gadolinium chelate and measures the transient decrease in signal intensity during the passage of the bolus through the vasculature.
On the other hand, DCE relies on the observation that gadolinium-chelate contrast agents, after the transient T2* effects, cause relative T1 shortening within the blood pool (and within any extravascular space in which the contrast agent accumulates because of leakage across the blood-brain barrier or the blood-tumor barrier), causing the increase in signal intensity [5]. In DCE T1-weighted images are acquired dynamically before, during, and after bolus injection of contrast medium.
Contrast-based perfusion imaging methods require a high-temporal resolution to capture the pass of the bolus, particularly when most of the contrast agent remains intravascular.
Endogenous tracer methods in perfusion MRI (ASL) use a model that assumes that the tracer diffuses freely from the intravascular compartment into the tissue compartment. This model is similar to the one used in PET measuring the regional accumulation of the tracer, which is influenced by regional blood flow and its half-life [1].
In ASL water protons within inflowing arterial blood are magnetically labeled (or “tagged”) by application of a special radiofrequency pulse designed to invert spins in a thick slab proximal to the slice of interest [1], taking advantage of using the magnetically labeled blood itself as an endogenous tracer.
By comparing tagged and untagged baseline images, qualitative or quantitative images can be obtained.
The modeling of ASL is similar to that used in the analysis of PET perfusion imaging, since in ASL methods arterial blood water is labeled as an endogenous diffusible tracer that can detect functional deficiencies in a way similar to PET [1] and permitting a quantitative measurement of the real cerebral blood flow, giving absolute values of perfusion of tissue by blood.
This chapter illustrates the gadolinium-based techniques, focusing primarily on the DSC, which currently has greater widespread clinical application than DCE.
9.1 Dynamic Susceptibility Contrast (DSC)-MRI
Dynamic susceptibility contrast perfusion (DSC)-MRI, also called dynamic susceptibility-weighted perfusion imaging or first-pass bolus tracking perfusion MRI, is the most widespread, clinically applicable MR technique for estimating cerebral hemodynamic parameters, especially in stroke, but also for tumor imaging and other research applications.
This technique is based on the passage of a bolus of contrast medium through the arterial and capillary circulation and on the transient changes it produces in vessels and surrounding tissues (Fig. 9.1).
Fig. 9.1
Series of T2*-weighted images from a single axial slice during the passage of a bolus of contrast agent. When the bolus arrives, it produces signal attenuation (*)
Under normal perfusion conditions, in the presence of an intact blood-brain barrier (BBB), the contrast medium remains confined within the vascular network and does not diffuse in the extravascular space. While passing through the cerebral vasculature, a short bolus of contrast material produces local magnetic field inhomogeneities that lead to a reduction in the transverse relaxation time of the tissue. This susceptibility effect can be recorded by a series of ultrafast T2*- or T2-weighted sequences using gradient-echo and spin-echo sequences, respectively. The signal intensity-time curves can be converted to concentration-time curves, which allow the calculation of hemodynamic parameters such as blood volume, blood flow, and transit time (Fig. 9.2).
Fig. 9.2
The inversion proportion between signal drop and concentration of contrast agent permits the calculation of the relative concentration from the signal intensity curve
In pathological perfusion conditions, e.g., hyperacute ischemic lesion, the signal reduction is attenuated or delayed, whereas in brain tumor, the signal varies in relation to grade.
Perfusion imaging requires (1) rapid administration of the contrast agent, (2) acquisition of ultrafast sequences, and (3) post-processing of the native images to calculate the intensity-time curve and obtain perfusion maps.
Infusion of the gadolinium-chelated agent must be as rapid as possible to ensure correct mixing of the agent with blood and a sharp signal drop profile. This requires using a large intravenous line (18 or, preferably, 16 gauge), an automatic injector, a dose of up to 0.2 mmol/kg of body weight (or less at 3.0 T, see below), and a bolus injection rate of 3–5 ml/s, followed by a 25 ml (range 10–30 ml) saline flush at the same rate, to push the bolus toward the heart.
Bolus injection of the gadolinium chelate should commence after about 20-second delay from the start of the DSC sequence.
Imaging sequences must be sufficiently fast to allow accurate measurement of the rapidly changing signal from the first pass of the bolus and have adequate temporal resolution ( < 2 s for the entire brain) [1]. The most widely applied imaging sequences for these studies are T2*-weighted gradient-echo single-shot echo-planar imaging (EPI) and T2-weighted spin-echo EPI (Table 9.2).
Table 9.2
Exogenous agent perfusion techniques: imaging sequences
DSC | DCE | |
|---|---|---|
Acquisition | 2D or 3D dynamic acquisition | 2D or 3D dynamic acquisition |
Sequences | Common: 2D single-shot GE EPI | Common: 3D GE (FSPGR, FLASH, THRIVE) |
TR | Intermediate TR < 2 s | Shortest TR < 0.5 |
TE | Intermediate TE = 30–40 ms for GE | Shortest TE < 10 ms |
Flip angle | Intermediate FA = 60–90° | Small FA = 20° |
Total scan duration | Relatively short ( < 2 min) | Long ( = 5–6 min) |
Spin-echo EPI sequences display excellent sensitivity for the susceptibility effect produced by 5 μm capillaries. Gradient-echo EPI sequences are generally more sensitive up to a vessel diameter of 7 μm. Spin-echo sequences are thus inherently weighted toward the microvasculature and are therefore less sensitive to larger vessels.
Gradient-echo EPI sequences are currently those used most frequently [37–40]. They are characterized by superior sensitivity in detecting the signal change produced by the passage of the contrast material and therefore require smaller doses of the agent. Their drawback is their high sensitivity not only to the microvasculature but also to the macrovasculature, including large arteries and veins on the brain surface. Susceptibility effects are elicited not only by the passage of contrast material but also by hemoglobin degradation products, the interfaces between different tissues, and age-related iron accumulation in the extrapyramidal nuclei. These effects are much more pronounced at high field intensities [40].
The decrease in signal intensity produced by the passage of a bolus of gadolinium chelate allows a signal intensity-time curve to be obtained by calculating the change in signal intensity in a single voxel (or in a single region of interest) as a function of time. This curve is then converted to an agent concentration-time curve.
The sum of all the concentration-time curves of all the voxels in a given slice generates perfusion maps from which various hemodynamic parameters can be calculated, including cerebral blood volume (CBV), cerebral blood flow (CBF), mean transit time (MTT), and time to peak (TTP) (Figs. 9.3 and 9.4) (Table 9.3).
Fig. 9.3
Concentration-time curve (rCBV cerebral blood volume, MTT mean transit time, TA arrival time, TTP time to peak)
Fig. 9.4
Intensity-time curves are correlated to cerebral perfusion, better visualized in the CBV map: perfusion is greater in gray than in white matter and is reduced or absent in the ischemic area
Table 9.3
Exogenous agent perfusion techniques. Mechanism and quantitative parameters
DSC | DCE | |
|---|---|---|
Mechanism | Gd distorts magnetic field and reduces T2/T2* around vessel | Gd causes dipole-dipole interactions and produces signal enhancement |
Quantitative parameters | rCBF CBV MTT | Ktrans Kep Ve Vp |
These parameters are dependent on the specific features of the bolus injection (injection rate, amount, and concentration of contrast material) and on specific variables of the patient being imaged (total body vascular volume and cardiac output) [1, 3]. As a result, hemodynamic parameters cannot be directly compared between different subjects and may even differ between examinations of the same individual performed at different times [1, 3].
Thus, relative values can be obtained using an internal standard of reference such as normal-appearing gray or white matter (Figs. 9.5 and 9.6) [1, 3].
Fig. 9.5
CBV and MTT maps
Fig. 9.6
Intensity-time curves and CBV maps in normal tissue and in focal ischemic area
For diffuse processes, in which the internal reference may also be affected, absolute quantitation is required. Absolute quantitation of CBV and CBF has been attempted using methods that measure arterial input to the brain, but their accuracy is debated [1, 3].
9.1.1 Cerebral Blood Volume
Cerebral blood volume (CBV) is the fraction of each imaged voxel comprising the intravascular space and therefore the volume of the blood vessels within a volume of brain tissue. It is measured as milliliters of blood per 100 g of tissue; since brain tissue approximates water in density (1 g/mL), this can also be expressed as a percent value.
Typical values for the brain are between 3 % and 5 %. Only a small fraction of CBV is arterial, most of it being divided between capillaries and veins, and its changes are related to autoregulatory vasodilatation of the capillaries and/or veins [6, 7, 38]. CBV is a potentially sensitive indicator of vascular endothelial response to changes in local CBF and tissue metabolism.
Relative CBV can be measured as the area under the curve of the voxel concentration versus time. Absolute CBV can be determined by dividing the area under the curve by a “reference” voxel known to contain 100 % blood, such as the superior sagittal sinus [7, 39].
Unfortunately several technical factors can impair the accuracy of this relatively simple measurement [1, 3, 41]. The first is that dynamic susceptibility contrast arises from spin diffusion in the space surrounding the blood vessels, making it difficult to determine a reference 100 % blood-filled voxel [41]. Secondly, the effects of contrast recirculation must be eliminated or minimized. Thirdly, CBV measurement can be erroneous if the gadolinium chelate leaks through a disrupted BBB. This is of particular concern when imaging tumors, since several tumors cause BBB disruption, yielding a bright signal on post-contrast T1 images [7, 42] (Fig. 9.7).
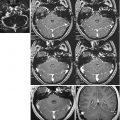
Fig. 9.7
(A, B) Low-grade astrocytoma: SE T1 after contrast agent administration (a) and CBV map (b); (C, D) glioblastoma: SE T1 after contrast administration (c) and CBV map (d). The CBV is reduced in the low-grade astrocytoma (b) and in the cystic component of the glioblastoma (d), whereas it is increased in the solid part of the glioblastoma (d)
DSC perfusion MRI model assumes that the contrast agent remains confined in the intravascular space throughout image acquisition. If the BBB is leaky, the DSC data can be compromised as the relative shortening of the T1 of water, due to parenchymal contrast extravasation, counteracts or mutes the T2* effect and the relative signal intensity decreases [8].
Comparative studies have shown that a “preload” of gadolinium chelate, given before the actual bolus dose for DSC data acquisition, can reduce the deleterious impact of a BBB breakdown on the perfusion data [8]. The preload reduces the T1 leakage effects by saturating the leaky tissues with contrast agent, thereby dampening the T1-shortening effects of the main bolus during DCS data acquisition [8].
New molecules, such as superparamagnetic iron-oxide particles, dendritic compounds saturated with gadolinium atoms, or reversible protein-binding gadolinium-based agents, have a longer half-life in blood [7, 43–45]. These so-called “blood pool” agents offer higher SNR for measuring CBV using steady-state susceptibility contrast that circumvents many of the problems outlined earlier.
9.1.2 Cerebral Blood Flow
Cerebral blood flow (CBF) is the amount of arterial blood delivered to brain tissue per unit of time. It is most commonly measured as milliliters of blood per 100 g of tissue per minute. Characteristic values for gray matter are 60 ml/min/100 g and 15 ml/min/100 g for white matter. CBF control is via control of the diameter of the feeding arterioles.
CBF is the primary rate constant controlling the supply of nutrients and removal of waste products from the brain. Below a threshold level, duration multiplied by the absolute CBF level can predict tissue infarction [7].
While CBV measurement with intravascular tracers is relatively straightforward, the measurement of CBF is more challenging [7, 46], as it requires delicate deconvolution methods.
In particular, one method tries to deconvolve the effects of a bolus of finite width (as estimated from the arterial signal near a large feeding vessel, such as the anterior communicating artery). This arterial input function is taken to represent the profile of the bolus at its point of entry into each individual voxel based on the assumption that every voxel has the same arterial input function. This is clearly an oversimplification, and uncertainties about regional changes in the profile and timing of the bolus can cause significant errors in CBF evaluation [7, 47].
Good absolute CBF correlation with H2 15O PET has been shown in anesthetized healthy pigs [48], and an excellent relative CBF correlation has been reported in an experimental model of ischemia [49]. However, in diseased brain, where collateral pathways are more common, intravascular tracer CBF measurements that do not account for variations in bolus delay (caused by arterial stenosis and occlusions) and dispersion are inaccurate [7, 46, 50].
9.1.3 Mean Transit Time
Mean transit time (MTT) is the average amount of time the blood spends in the capillary bed. A capillary bed is made up of numerous capillaries of different lengths, so the time spent in the tissue has a distribution. The unit of measurement is seconds. Typical values for the normal brain are in the range of 3–5 s, whereas in acute cerebral infarction, MTT is increased.
According to the central volume principle, it is important to note close relationship between the CBF, CBV, and MTT. This relationship is:
CBF = CBV/MTT.
This relationship can easily be explained with the simple case of flow through a single capillary. Flow is defined as the motion of a volume of fluid over time and velocity as distance over time. If the distance is measured along the capillary vessel, and the velocity is the speed of the fluid in this vessel, this relationship can be multiplied by the cross-sectional area of the capillary. This converts the distance to a volume and the velocity to a flow.
9.1.4 Time to Peak
Time to peak (TTP) is the time the blood takes to reach the maximum intensity, from the start of the bolus injection to the peak concentration of contrast agent; it is defined as the time point of maximum intensity loss after the passage of the contrast agent. It is calculated in seconds and reveals any delays in transit time, enabling quick quantification of perfusion deficits. Ischemic areas are characterized by a delay of tracer arrival and a TTP increase [6, 51, 52]. A study of patients with acute cerebral ischemia postulated that TTP values of 0–3.5 s are related to normal perfusion; values ranging from 3.5 to 7 s may indicate a perfusion disorder, whereas values above 7 s indicate a high risk of ischemic tissue injury and watershed infarcts in border zones [51].
Despite these difficulties in determining the absolute values of volume and flow, relative values of CBV and CBF are extremely useful in clinical practice, especially in stroke evaluation.
It is generally accepted that tissue with abnormalities on both perfusion and diffusion-weighted imaging has already undergone irreversible ischemia.
However, tissue with perfusion abnormalities but normal diffusion is thought to be consistent with reversible ischemia. This area of diffusion-perfusion mismatch, also called ischemic penumbra, is a region of decreased perfusion that is potentially reversible because it is above the critical level for the maintenance of the Na+ K+-ATPase pump [1]. Exact evaluation of the tissue that can be rescued is critical in assessing the risk-benefit ratio of possible therapies, since patients with no mismatch are considered unlikely to benefit from thrombolytic therapy.
Time-dependent perfusion thresholds were first established using H2 15O PET to distinguish underperfused tissue evolving toward infarction ( < 12 ml/min per 100 g) from penumbral flow with functionally compromised but viable tissue (12–20 ml/min per 100 g) [1–3].
The exact role of each hemodynamic parameter (CBV, CBF, MTT, and TTP) in the correct evaluation of brain perfusion changes, and which of them is more representative of salvageable tissue and predictive of final infarct size is still debated.
It appears that MTT maps generally show the largest area of abnormality and often overestimate final infarct size, while CBV maps tend to underestimate this size.
In one study comparing CBV maps, CBF maps, and MTT maps with change in size from initial infarct size to final infarct size, a mismatch between initial CBF maps and a diffusion abnormality predicted more often the growth of infarct than did a mismatch between initial CBV maps and diffusion abnormality [41]. In that study, however, CBV maps best correlated with change in infarct size from initial to follow-up imaging [41].
A recent study comparing TTP maps and thresholds in patients with acute ischemia using CBF data acquired with PET, assumed as the gold standard, indicated that TTP is a useful estimate of ischemic injury but entails considerable methodological limitations that have to be considered in routine use of MRI for stroke [52].
Relative TTP maps are only indirect surrogates of CBF and do not represent the best application of MRI perfusion imaging. They are used in clinical routine because they are simple; they clearly delineate hemodynamic alterations, yield satisfactory results compared with quantitative methods, and do not rely on deconvolution algorithms, calibration with PET data, or selection of adequate input functions [52].
However, TTP maps may be inappropriate, since simple visual analysis is more prone to errors related to individual subjectivity [52].
A quantitative observer-independent measure such as TTP thresholds has proved to be more indicative of underperfusion stated by PET for a CBF value of < 20 ml/min per 100 g [52].
The best estimate of penumbral flow was found for a TTP delay of > 4 s (sensitivity 84 %, specificity 77 %); it best identifies the volume of penumbra and should be used to define the mismatch volume. The volume of a TTP delay of > 4 s was correlated with clinical deficit, whereas the volume of a TTP delay between > 5 and > 8 s was strongly associated with infarct growth [52].
The lack of a complete match between PET and TTP thresholds is partly explained by method-specific properties. TTP only yields a relative estimation of CBF as it indicates the time point of maximum signal intensity loss during the passage of the tracer within several seconds. H2 15O PET assesses the “true” CBF as the concentration of a partly diffusible tracer integrated over a scanning time of several minutes. TTP data are therefore more prone to movement artifacts, collateral flow, or individual hemodynamic properties [1, 52].
However, even the TTP threshold with the best sensitivity and specificity seems to include a large portion of tissue with only modest hemodynamic damage; particularly in small ischemia, TTP tends to overestimate the true extent of the “tissue at risk” [52].
9.2 High-Field DSC
Currently, most MR perfusion studies are acquired on 1.5 T machines, but MR systems operating at higher-field strengths are increasingly becoming available in clinical practice [4, 5, 8]. In general, imaging at higher magnetic field strengths offers at least a linear SNR increase, but its utilization is impaired by problems related to magnetic susceptibility artifacts.
Since magnetic susceptibility increases with field strength, at 3.0 T image distortion may be critical, particularly if EPI pulse sequences are used, as in most protocols for DSC perfusion studies. In fact, with EPI sequences the trade-off is increased B 0 inhomogeneity and magnetic susceptibility differences at air-tissue interfaces, leading to signal dropout and geometric distortions, most notably in the phase-encode direction [53].
Image quality may thus be severely impaired by distortion and blurring around tissue interfaces, especially in patients who have undergone neurosurgery, and assessment of signal intensity at the passage of a bolus of contrast agent may be inaccurate.
Other drawbacks inherent with T2* susceptibility are systematic overestimation of perfusion because of the different relaxivity of the paramagnetic contrast agent in the larger vessels (from which the input function is obtained) and in capillaries, problems in defining a good input function because of low spatial resolution on T2*-weighted EPI, and finally problems in assessing a damaged BBB. The latter is a critical element in the evaluation of brain tumor perfusion, because relaxivity is different when the contrast agent is confined to a small compartment as opposed to distributed in the interstitial space [54].
Related posts:
Stay updated, free articles. Join our Telegram channel

Full access? Get Clinical Tree


