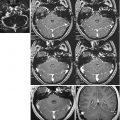
Fig. 17.1
Representation of anatomical and functional changes occurring in patients with PD. Alterations are observed at three levels: I mesencephalic (EPI diffusion-weighted image), II basal ganglia (spin-echo T2-weighted image) and III cortical (functional MRI, motor task)
At each of these three levels, MRI can further and significantly contribute to evidencing the anatomical and functional changes induced by PD.
Acquisition of MRI scans that are also highly sensitive to PD-induced changes is particularly difficult, both for the technical limitations of the scanners and for the reduced size of the structures involved. As regards the former, the high intracellular iron content of SN dopaminergic neurons, which is an essential element of their metabolic processes [3], enhances the contrast between the structures and surrounding tissue. However, the iron deposits also play a significant role in the cascade of events that lead to apoptotic cell death [4]. With regard to the small size of the structures, the mesencephalon contains important bundles of ascending and descending myelin fibres, nuclear structures such as red nuclei and the third pair of cranial nerves, SN and reticular substance. In normal individuals, SN usually measures only a few square millimetres, emphasising the crucial importance of spatial resolution for its precise quantification, since in patients the size of the structure might be further reduced.
Data obtained using low-, medium- and high-field MRI are presented below in relation to each anatomical and functional level involved in PD and the potential of 7.0 T MRI imaging is illustrated.
17.1.1 Mesencephalic Level
17.1.1.1 Low- and Medium-Field MRI
The mesencephalon, in particular SN, is the area where focal neuronal degeneration electively takes place. Several acquisition techniques have been applied using low- and medium-field magnets to try and define the parameters for the identification and quantification of SN. These studies, performed in a small number of patients, have demonstrated that identification of the borders and dimension of SN is difficult in healthy as well as PD subjects. These modest results have discouraged large-scale application of such methods in clinical practice but have had the merit of demonstrating that the integrated use of multiple acquisition techniques capable of enhancing and showing the different mesencephalic component structures is essential to identify and quantify SN.
Hutchinson et al. [5, 6] used T1-weighted inversion recovery with two different inversion times to suppress the mesencephalic white and grey matter signal, respectively. The ratio of the signals obtained with the two inversion times allowed the quantification of SN in healthy subjects and the assessment of focal neuron loss in PD patients. Being based on a semiautomatic method, these investigations, which were performed in a small number of subjects and patients, have proved difficult to reproduce. Hu et al. [7] demonstrated that positron emission tomography (PET) with (18)F-dopa was more effective than MRI with inversion recovery in discriminating patients with PD from controls in only 83 % of cases.
Oikawa et al. [8], using dual-echo, spin-echo and short inversion time inversion recovery sequences, failed to show significant differences in SN dimension between PD patients and control subjects. Other studies have been unable to find significant differences in SN volume using diffusion-weighted imaging (DWI) sequences [9, 10]. Finally, indices of SN neuron depletion were calculated in healthy and PD individuals using magnetization transfer ratio (MTR), an MRI parameter that is based on the energy transfer from protons bound to macromolecular structures like myelin to free-water protons [11]; other researchers have proposed using the measurement of brain iron by means of T2* maps obtained using gradient-echo sequences [12, 13].
Due to their spatial resolution, these low- and medium-field MRI studies have demonstrated limited accuracy in SN evaluation. The slice thickness used was 3–4 mm, which is insufficient to measure the modest quantitative differences induced by the loss of dopaminergic neurons.
17.1.1.2 High-Field MRI
One of the main advantages of high-field, 3.0 T MRI is the higher achievable spatial resolution, which consequently allows for increased accuracy in the definition of brain anatomy. However, as in the case of lower-field scanners, recent volumetric studies using manual segmentation have reported discordant results, highlighting that different MR contrasts identify different regions in the SN and that volumetric measurements are highly dependent on the contrasts, not to mention the inter- and intra-rater variability that characterise manual segmentation of small structures. Overall, volumetric measurements are only moderately accurate at spatial resolutions typical for 1.5 T and 3 T [14].
In addition, magnetic susceptibility artefacts due to the iron selectively deposited in SN are enhanced by the higher magnetic field, so that spin-echo sequences can be more efficiently used for acquiring proton density- and T2/T2*-weighted images with 0.9 mm3 × 0.9 mm3 × 2 mm3 voxels in a few minutes (Fig. 17.2).

Fig. 17.2
Left spin-echo T2 axial images of SN (Siemens Allegra, 3.0 T). Right schematic 3D representation of SN and its anatomical relationships with red nuclei and cerebral peduncles
As the number of patients that underwent 3.0 T MRI increased, the quantification of iron deposits using relaxometry was facilitated, since this technique greatly benefits from high magnetic fields.
Furthermore, in the last few years, the importance of simultaneously analysing different MRI sequences has been stressed out. In fact, the information conveyed by multimodal MRI-derived metrics has a complementary nature, since different indexes are sensitive to different tissue characteristics, in particular at the macroscale (grey and white matter density, morphometric indexes) or associated to microstructure of the brain (diffusion tensor imaging [DTI] metrics, iron deposition quantification). Recent studies [15, 16] focused on the potential of extracting information from different sequences (such as T1 and T2 mapping or DTI measures rather than volumetric MRI only), in order to improve the accuracy in identifying PD patients. Moreover, by simultaneously measuring volume, DTI scalars and T2* relaxation rates in deep grey matter structures, including SN and red nuclei, a different group of researchers was able to assess changes occurring in the nigrostriatal system in patients with Parkinson’s disease with respect to healthy controls [17].
The enhanced scans that can be acquired at 3 T also allowed researchers to investigate midbrain structures from a functional point of view, using resting-state or task-based functional MRI (fMRI). Very recently, researchers were able to distinguish, in healthy humans, SN from the ventral tegmental area based on differences in resting-state connectivity, i.e. the spontaneous fluctuations of brain activity when no task performance is required. The same authors were also able to construct a probabilistic midbrain atlas [18], which could prove very useful in the development of fully automated methods for SN integrity assessment, avoiding the time-consuming procedure of manually delineating midbrain nuclei on MRI scans.
As stated before, the nigrostriatal degeneration in PD induces a change in the functional connectivity between SN and basal nuclei. This change is held to be associated with a reduction in anatomical connectivity among brain regions, and fibre-tracking techniques have been employed to assess it. Tractography allows the reconstruction of the course of axon bundles on DTI (or on more sophisticated diffusion protocols) images by estimating the preferential direction of the diffusion of water molecules. Tractography highly benefits from a high signal-to-noise ratio (SNR) and therefore from high field intensities (Fig. 17.3). However, the use of this technique, which shows considerable potential for connectivity at whole-brain level, is limited in the mesencephalon by its scarce sensitivity to the minimum deviations of fibre bundles that are found in PD and by susceptibility artefacts induced by the anatomical area, which is adjacent to the air-filled cavities of the splanchnocranium and petrous bones.

Fig. 17.3
Nigrostriatal tractography. Tractographic images are superimposed on EPI T2-weighted slices (Siemens Allegra, 3.0 T)
To date, fibre tracking in the study of SN has been mainly used for the automated identification and segmentation of pars compacta and pars reticulata. In fact, tractography was able to distinguish an internal region mainly connected with basal ganglia, anterior thalamus and prefrontal cortex (i.e. a large part of pars compacta) from an external region mainly connected with the posterior and ventral thalamus and the motor cortex (mostly corresponding to the pars reticulata) [18]. In this study, the SN volumes in PD were generally reduced, particularly in the right SNR.
Taken together, these studies highlight the fact that not only conventional techniques cannot resolve SN structure with sufficient diagnostic accuracy but also that most of the advanced MRI protocols may not be sensitive enough to quantify the disease-induced alterations in such a small structure.
Very recently, a novel imaging method has been proposed that relies on a neuromelanin-sensitive contrast. Neuromelanin is a by-product of dopamine and noradrenaline metabolism, and it is thought to protect neurons from oxidative stress [20]. In vivo imaging of this pigment is feasible because of its paramagnetic properties, which result in a high signal on specific T1-weighted MRI sequences [21, 22]. This novel method has been recently used to study both drug-naïve [23] and treated patients with PD [24]. In order to obtain quantitative measures from the T1 high-signal region, the area and the maximal length of the SN can be assessed semiautomatically [23]. In both treated and untreated patients with PD, these metrics have been found significantly reduced, suggesting neuronal depletion is present at the early stages but does not worsen as disease duration increases.
Neuromelanin-sensitive MRI is indeed a promising technique, which is currently being the object of several studies at higher field strengths, as will be described in the next section.
17.1.1.3 Higher Field Strengths
Very recently, the midbrain SN and ventral tegmental area have been successfully imaged in healthy humans at 7.0 T [25]. In fact, ultra-high field MRI has provided the increase in both spatial resolution and contrast needed to detect changes in SN morphology, changes otherwise not achievable with lower-field magnets and that may provide further insight into the pathology of PD [14].
Damier and colleagues demonstrated that, in human SN, dopaminergic neurons form distinct compartments known as nigrosomes 1–5 (calbindin poor) and matrix (calbindin rich) [26] and that the nigrosome-1 is the site of the earliest loss of dopamine neurons in Parkinson’s [27]. Nigrosomes penetrate deep into SN pars reticulata, which contains higher levels of iron than the pars compacta. Therefore, while neuromelanin-sensitive MRI is suitable to delineate the pars compacta, T2*-weighted contrasts are better at detecting the pars reticulata. However, for the currently achievable voxel resolutions, there is a significant overlap between the areas identified by the two imaging modalities.
The principal morphological changes that could be identified by imaging the SN of PD patients at 7 T, using T2*-weighted images, were the following: loss of nigrosome-1 hypersignal, abnormal SN contours and increased area of reduced signal intensity [14].
At ultrahigh field strengths, the nigrosome-1 appears hyperintense on T2*-weighted images in the SNc of healthy subjects. In PD, the area of high signal intensity is no longer visible as a result of the increase in iron load in nigrosome-1 [28–30]. This suggests that in PD, the low-signal area in T2*-weighted scans includes not only the SN but also the SNc. Based on 7 T results, loss of nigrosome-1 was also detected using 3D susceptibility-weighted images at 3 T [31].
For what concerns the potential clinical utility of imaging SN at 7 T, the diagnostic accuracy of nigrosome-1 visualisation in the SN was high, reaching 100 % sensitivity and negative predictive value, 87–100 % specificity and 91–100 % positive predictive value [29, 30]. Intra- and interobserver agreement was also high, suggesting that already the simple visual evaluation of the SN at 7 T may aid the diagnostic process. Using susceptibility-weighted images at 3 T, a diagnostic accuracy of 91–96 % was obtained, with a high sensitivity (85.7–100 %) and specificity (95–100 %), suggesting that loss of nigrosome-1 may be used in 3 T clinical scanners [31, 32].
In summary, the introduction of 3.0 T MRI scanners has allowed researchers to provide further insight into the pathological processes that affect the midbrain. However, the development of robust methods at ultrahigh field and technical advances in image processing are still needed in order to accurately assess the neuronal and axonal depletion that characterises PD at the midbrain level.
17.1.2 Basal Ganglia Level
17.1.2.1 Low- and Medium-Field MRI
Since PD induces nigrostriatal axon degeneration, dopaminergic deafferentation and pre- and postsynaptic disruption of the basal ganglia, the latter do not undergo neuron depletion but synaptic and metabolic alterations. At this level, nuclear medicine-based techniques such as PET and single-photon emission tomography (SPECT) employed with specific tracers selectively binding to pre- or postsynaptic dopaminergic receptors have demonstrated their progressive loss, which is related to disease severity [33].
As regards MRI, studies of the basal ganglia (globus pallidus, caudate nucleus and putamen) based on morphological evaluation, size and metabolic parameters have yielded contradictory results. In the first attempts to characterise PD pathology, quantification of the iron deposits, which provides a metabolic index of the pre- and postsynaptic disruption of the basal ganglia, had been the main goal of the largest number of studies of PD (see [4] for a review). In MRI, the presence of iron in brain parenchyma induces a reduction in transverse relaxation times that can be measured on T2- and T2*-weighted sequences. When comparing PD patients with a control group, this reduction was mainly observed at the level of globus pallidus [12, 34] and putamen [12, 34, 35]. However, Graham et al. observed increased putaminal transverse relaxation times induced by the reduction in iron content in patients with PD [13, 36]. In a recent study, Kosta et al. confirmed these data by demonstrating an increase in T2 transverse relaxation times in globus pallidus and putamen. In patients who have had the disease for more than 5 years, the putaminal surface was also increased compared with patients with shorter disease duration, presumably reflecting gliotic neuroreparative phenomena [37].
MRI diffusion techniques have been applied to assess subcortical neurodegenerative disorders such as PD and multisystem atrophy (MSA). Schocke et al. showed that analysis of mean diffusivity (MD, or apparent diffusion coefficient (ADC)) in the basal ganglia allowed PD patients to be distinguished from MSA patients [38] based on a greater MD – an indirect measure of neuronal depletion and of associated reactive gliosis – in the putamen of the latter [10, 38, 39]. Seppi et al. documented a MD increment in globus pallidus and putamen in patients with progressive supranuclear palsy (PSP) compared with PD patients [40]. MRI diffusion techniques are thus effective in discriminating PD from other subcortical diseases (MSA, PSP) but are unable to differentiate PD patients from control subjects of comparable age without neurological disorders [10, 39].
For what concerns non-motor symptoms, which are always more investigated with the aim of identifying early markers of PD, higher MD values were found in the hippocampus of PD patients even in absence of cognitive impairment [41]. In this study, a negative correlation between hippocampal MD values and the scores on memory test was revealed, suggesting that not only striatal structures are involved in the pathophysiological framework underlying PD.
With the introduction of high angular resolution diffusion imaging (HARDI) techniques, metrics similar to MD and FA were applied to MRI data from PD patients. The difference with DTI studies is that such indexes are extracted from more appropriate models of diffusion. One study of diffusion kurtosis imaging (DKI), for example, suggested that DKI measures in the basal ganglia and SN have higher sensitivity and specificity than conventional DTI-derived metrics in detecting differences between PD patients and healthy controls [42].
Magnetization transfer imaging (MTI), or the study of MTR maps, is another technique capable of quantifying the degree of myelination [19] and has been used by Eckert et al. to assess neuronal depletion in basal ganglia [11]. The authors observed significant differences in globus pallidus between PD patients and control subjects in 75–80 % of cases. This technique has not been further applied to PD, and these data have not been reproduced in other studies.
The main investigations into basal ganglia dopaminergic deafferentation in PD have used various MRI techniques with contrasting results. None of the methods used at low and medium fields can reliably differentiate PD patients from control subjects.
17.1.2.2 High-Field MRI
In the basal ganglia circuit, measurement of the iron deposits drew great benefit from the advantages of high magnetic fields (Fig. 17.4). Compared with SN, where iron deposition is characteristic of the physiological activity of dopaminergic neurons [13, 37], in the basal ganglia, these deposits are an indirect parameter of the neuronal metabolic changes induced by dopaminergic deafferentation.

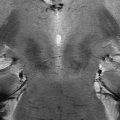
Fig. 17.4
Relaxometry using GE with different echo times (6 s, 12 s, 20 s, 30 s, 45 s, 60 s)
Despite the development of several, advanced image processing techniques, advanced MRI methodologies have also been employed, over the past decade, to quantify the pattern of structural alterations typical of PD, searching for brain abnormalities in many cortical and subcortical regions, in particular, the basal ganglia and SN [43–47]. Also, pathological brain changes were also searched for in drug-naive patients with PD (de novo-PD) albeit in both cases results found in literature are rather inconsistent [48–54].
What existing studies at 3.0 T seem to suggest is that PD-related changes in the brain are not accurately detectable by morphological or whole-brain approaches. On the other hand, in order to characterise shape, and not volume, of subcortical structures, a region-of-interest (ROI)-based technique, called shape analysis, has been recently applied to MRI data of patients with PD at different disease stages. Shape analysis has proven superior to whole-brain and volumetric approaches in patients with PD [45, 47, 51]. The majority of these studies found alterations of striatal shape, in agreement with nuclear medicine findings, with the putamen earlier involved than caudate. Very recently, differences were found in the topographical distribution of putaminal shape alterations between patients with unilateral and patients with bilateral dopamine-transporter abnormalities on SPECT, suggesting a progression of disease-related changes from the medial to the lateral surface of the structure [55].
Among the first study to simultaneously consider multimodal MRI metrics, which could provide complementary information of tissue integrity, Péran and colleagues found that compared to control subjects, patients with Parkinson’s disease displayed significantly higher R2* in the SN, lower fractional anisotropy (FA) in the SN and thalamus and higher MD in the thalamus and in the striatum. The combination of three markers was thus sufficient to obtain a 95 % global accuracy in discriminating patients with PD from controls, remarkably, by combining three predictive markers extracted from the nigrostriatal structures that characterise PD pathophysiology [17].
In the basal ganglia, DWI sequences allow the estimation of local axonal depletion and provide the data required to track SN dopaminergic fibres [56]. Also at this level, tractographic techniques suffer from scarce spatial resolution and from susceptibility artefacts, induced by surrounding structures and by the iron deposits themselves, which reflect disease progression.
17.1.3 Whole-Brain and Cortical Level
17.1.3.1 Low- and Medium-Field MRI
As illustrated above, the prefrontal cortical changes induced by PD are essentially functional and are a consequence of dopaminergic deafferentation in the basal ganglia. The altered cortical activity, i.e. the functional deafferentation due to the dysfunction of striatofrontal circuits, would be the cause of the motor and cognitive deficits characteristic of PD. The classic scheme of Alexander et al. describes the different parallel, independent and recurrent striatofrontal circuits connecting specific prefrontal cortical areas with specific striatal and pallidal regions [2]. Evidence of dementia-like cognitive deterioration in some PD patients in the course of disease suggests that the functional changes in the striatocortical circuits progress towards brain atrophy. The recent introduction of cerebral cortex quantification techniques (voxel-based morphometry) using volumetric acquisitions has not provided univocal data in PD patients in terms of factors predictive of dementia. For instance, some researchers have observed a reduction in the volume of the frontal cortex [57] and others of the hippocampal cortex, superior temporal gyrus and cingulum in non-demented PD patients [58]. MRI morphological studies of the cortex are therefore scarcely informative in this disorder, whereas functional investigations using PET, SPECT and functional MRI imaging (fMRI) have confirmed the hypothesis of motor and cognitive cortical functional deafferentation.
The early fMRI studies of patients with PD performing a simple motor task have clearly demonstrated reduced activation (reflected in reduced regional cerebral blood flow) at the level of the main cortical regions that receive afferents from the basal ganglia: supplementary motor area (SMA) [59–62], dorsolateral prefrontal cortex [59, 60, 63] and anterior cingulate gyrus [59, 60]. In the same patients, other cortical areas, functionally related to the former, exhibited increased activation: primary sensorimotor, lateral premotor and parietal cortex [60]. It has been demonstrated that reduction in SMA activity is sensitive to dopaminergic drugs in that it is detected in PD patients not receiving treatment and regresses with therapy administered in the acute phase [61], whereas it is not observed in those receiving chronic dopaminergic treatment [62]. In the first fMRI study of PD patients [64], the authors documented a complex cortical activation during a motor task, confirming on the one hand the results obtained with nuclear medicine techniques [60, 61] showing reduced activation of the rostral portion of SMA and on the other evidencing increased activation in the caudal portion of SMA, anterior cingulum and primary sensorimotor cortex and parietal cortical areas. This pattern of cortical activation was reversible with administration of L-dopa both at the level of the rostral SMA and of the other cortical areas, such as primary sensorimotor cortex, lateral premotor and parietal cortex [65].
Overall, these studies have demonstrated the hypothesis of reversible functional deafferentation induced by altered striatal modulation in prefrontal cortical area; this in turn is associated with a complex pattern of cortical activation with reorganisation of the areas involved in the planning and execution of movements.
17.1.3.2 High-Field MRI
High-field MRI has opened up new prospects for the study of the functioning of striatofrontal circuits in PD. On the one hand, fMRI with EPI sequences affords greater spatial and temporal resolution. This enables cortical activation during simple or complex motor tasks to be studied more easily in PD patients (Fig. 17.5). In addition, fMRI data can be correlated to structural studies using dedicated protocols both at the level of the mesencephalon and of the basal ganglia (Fig. 17.5). Identification of activated cortical areas during fMRI can allow the course of corticostriatal circuit fibres to be tracked and their possible depletion in PD to be quantified. Other techniques for the quantification of the extent of deafferentation, like relaxometry, can exploit the better SNR afforded by 3.0 T fields.

Fig. 17.5
 High-Field 3 T Imaging of Alzheimer’s Disease
 7 T MR: From Basic Research to Human Applications
 Use of fMRI Activation Paradigms: A Presurgical Tool for Mapping Brain Function
 3.0 T Perfusion MRI Dynamic Susceptibility Contrast and Dynamic Contrast-Enhanced Techniques
 3.0 T MR Angiography
 Standard 3.0 T MR Imaging


fMRI with motor task (Siemens Allegra, 3.0 T). Hyperactivation of contralateral SMA, primary sensorimotor and premotor areas in a PD patient receiving dopaminergic therapy compared with a control subject
Related posts:
High-Field 3 T Imaging of Alzheimer’s Disease
7 T MR: From Basic Research to Human Applications
Use of fMRI Activation Paradigms: A Presurgical Tool for Mapping Brain Function
3.0 T Perfusion MRI Dynamic Susceptibility Contrast and Dynamic Contrast-Enhanced Techniques
3.0 T MR Angiography
Standard 3.0 T MR Imaging
Stay updated, free articles. Join our Telegram channel
Full access? Get Clinical Tree
