Fig. 19.1
This figure slows the geographic distribution and cumulative number of partial and full downloads of Slicer 4 in early spring 2012. 3D Slicer has a large number of active, committed users around the world
The use of an open-source strategy based on a curated and continually tested software object library. This means not just that Slicer-based software is fully transparent to the end user but also that its robustness and reliability are freely inspectable and testable.
A vibrant and growing user community, which supports Slicer’s core principles and works to extend Slicer capability to serve the evolving needs of the research and clinical users.
A core belief that an untrained user who is not a computer scientist should be able to use the system successfully with appropriate training. This differentiates Slicer from many very effective and useful platforms for advanced image data processing, which must be operated by experts, generally for research purposes which may use specialized computing architectures or high-bandwidth communications.
Slicer is supported on Windows, Macintosh, and Linux. It can be run effectively on commodity personal computers and is easily embedded in larger systems for, for example, real-time data acquisition and processing.
3D Slicer Technology
3D Slicer is a free open-source software platform distributed under a BSD-style license for the analysis and visualization of biomedical images. It is modular and extensible and used for research and application development in medical diagnosis, staging, and therapy guidance.
3D Slicer supports several different plug-in mechanisms, with a variety of complexities and capabilities. Correspondingly, platform developers may work at any level of the system to implement changes. Slicer is available for Windows, MAC OSX, and Linux operating systems and built on VTK [9], ITK [10], and other packages comprising the NA-MIC Kit [11]. All Slicer versions from 4.0 on provide native 64-bit capability. 3D Slicer then consists of an assembly of compatible, modular toolkits, tools, and methodologies. Documentation and tutorials may be downloaded from the Slicer website [7], which also provides information about a variety of uses.
The users of Slicer span a range of interests and capabilities. At one extreme are users who desire a stable and robust platform for basic image analysis and display functions but wish to use certain features of Slicer, such as the ability to know exactly how the data are processed, the ability to add simple upgrades and improved functions as they may be useful, and the participation in the Slicer community. Users with more complex needs may wish to modify program operations, add specialized processing or interfaces, or even re-architect the overall system. Slicer has evolved to accommodate this range of users by implementing an increasingly sophisticated support infrastructure while adhering to its core principles (Fig. 19.2).
Fig. 19.2
The main elements and working relationships of the 3D Slicer community. The user accesses training and support from the Slicer community and downloads the basic software package and extension modules appropriate to his or her task. Developers create new functions which may be included in the module repository for any user download. The leadership sets strategy (architecture, new release planning, etc.), maintains the continuous validation process which validates elements of the code repository, and organizes training and community events such as “Project Weeks.” Openness and feedback are primary characteristics of the Slicer community
The components of a Slicer session are organized into the “MRML tree” [12]. The MRML tree is organized hierarchically with nodes, which contain such content as volumes, 3D models, and transforms. Nodes also store window level, layout parameters, and related factors. “Sceneviews” capture the complete MRML tree, encompassing the build of Slicer code, including layouts, volumes in the slice viewers and their visibilities, and the 3D viewers. For example, distinctions are made between objects which are made visible (labeled with a specific color) or which is made transparent. Sceneviews offer a convenient process to capture complex configurations for reviews, meetings, presentations, or review of a clinical therapy plan. While Slicer itself is written as an interactive program for subject-specific analysis, many of the Slicer modules can be run from the command line so they may be used in processing pipelines for offline automated analysis of larger studies. Slicer can also be applied to the prototyping of workflows. A first generation of workflow engines is being developed to support this use case [13].
The successful operation of Slicer depends on a process infrastructure to ensure robust and repeatable computational performance. A number of specialized software tools were developed and are employed for this purpose: git, a web-based source code repository [14], manages contributed source code; cmake [15] manages compilation of the source code on a variety of operating system platforms. Automated testing is performed on each platform every day after the source code has been compiled. This is accomplished by a software package called ctest [15]. Cdash [16] is a web-based interface that presents the results of the nightly compile/test cycle on all the platforms in which Slicer has been compiled. With several platforms (Windows, Linux, Mac) and several hundred tests per compilations, cdash provides an interactive interface for managing the complexity underlying this approach. This system enforces the key Slicer requirement that every element of code in the Slicer library is fully functional, compatible with the other code elements, and accurate.
New stable releases of Slicer occur biannually. As of early 2012, the stable release is 4.1. Compared to its predecessor, key functional features of this release include improved data processing and rendering speeds and a more intuitive and powerful user interface toolkit. Slicer 4.1 has a simpler user interface, more flexibility in configuring the layout with multiple viewers, a more robust volume-rendering module, integral charting abilities, and greatly improved support for DICOM. Under the hood, the GUI was migrated to Qt, and the source code tree was reorganized and pruned. Support for Python, a powerful and popular scripting language, was strengthened. Significantly improved support for web technologies is possible through WebKit, a web browser engine which is available as part of Qt. Slicer 4 also relies on CTK, a new toolkit for UI components. Particular new capabilities relevant to image-guided therapy are the ability to specify Slicer operating modes in terms of a procedure workflow and improved interfaces with external devices. Finally, the underlying code has been reorganized and streamlined for greater performance.
Using Slicer
3D Slicer [7], is a software platform which continually evolves to serve the requirements of end users and computer scientists. While Slicer began several years ago as a master’s thesis project at MIT [17], today it is a widely used platform for scientific and clinical medical image processing applications.
We distinguish two communities supported by the Slicer platform:
General Users. Use Slicer as a tool to conduct basic, clinical, and translational research and clinical applications. A typical task might consist of loading a data set and processing it using multiple segmentation algorithms, then comparing and displaying the results. Key attributes for this medical-user community are ease of use, adaptability, support for translation to clinical demonstrations and technology transfer, and robust algorithms that accommodate anatomic and pathologic variations. Many of the supporting core technical capabilities are also effective in nonmedical applications; users work on the Slicer platform in fields ranging from 3D design to complex geology data reduction, often adding extensions to fit their purposes. Slicer is often used at the investigational stage of clinical validation of a new research, diagnostic, or therapeutic approach. Because 3D Slicer-based systems are both robust and flexible, they enable investigators to rapidly implement and prove out new concepts, explore options, and gather data for subsequent analysis.
Computer Science Users. A worldwide open community of software developers and scientists is constantly extending and improving 3D Slicer. A web-based software engineering methodology has been used and evolved to ensure that each individual’s contribution is respected and also that the integrated total capability maintains functionality and transparency.
Running Slicer as a Workstation
3D Slicer was initially intended (and is widely used today) as a workstation with static data sources. Slicer can run directly on a conventional desktop or laptop. Data is loaded, analyzed, and displayed, and the task (such as a diagnostic analysis, image biomarker quantification, or the planning of a surgical procedure) is completed.
When beginning a new project, the user configures and runs an initial build of standard Slicer modules from the curated Slicer library [8]. Nonstandard modules (“extensions”) may also be loaded. The resultant “work platform” will include an overall workflow and modular elements for I/O, data preprocessing, data processing, subsequent analysis and modification (such as 3D model construction), and, at several of these stages, display. The operator controls the progress through the workflow, selects options, and inputs parameters with the GUI and keyboard. All processing is local to the end user. Trust issues associated with transmission of confidential patient information on a nonlocal infrastructure such as the Internet or “cloud” server are thus avoided.
Typically Slicer is used as a package, but it may be adapted to the user’s purposes using an interactive editing capability. The user need load only the modules relevant to his or her task, so the hardware is used efficiently. To work with modern diagnostic images, computers must have significant amounts of memory and a powerful graphics accelerator board. Here we describe some of the primary elements of a 3D Slicer build.
Graphical User Interface (GUI)
Slicer has a flexible layout with a panel for shortcuts at the top and a wide panel on the side that is used for displaying module-specific information. These modules provide access to the majority of the specific functions that control most of the processing (see Fig. 19.3).
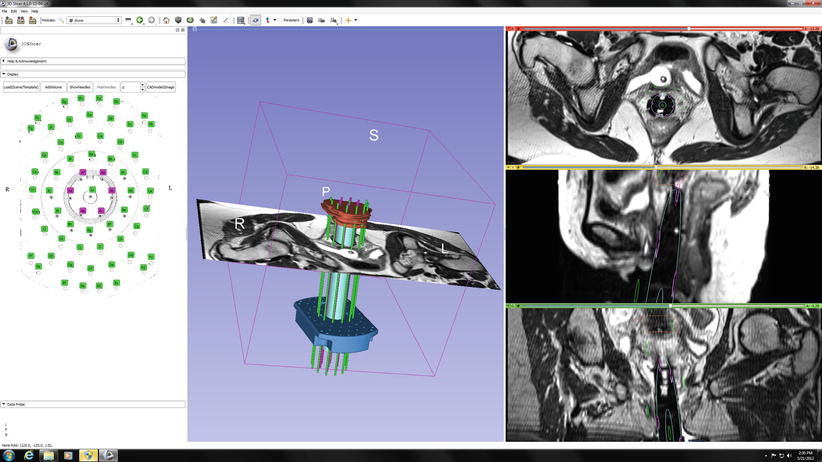
Fig. 19.3
Typical Slicer 4 implementation, which shows an intraprocedural planning display, made during MR-guided cervical cancer brachytherapy. On the left is the template to guide the brachytherapy insertion needles, showing the channels in use. The center shows a 3D rendering of the needle guide system around the central obturator, with a registered axial MR image which may be positioned as desired by the physician. The axial, sagittal, and coronal images are shown on the right; these may be located independently to optimize visualization of the tumor and its relationship to the therapeutic needle system (Credit, X. Chen, et al., see Chap. 34)
Data Input
Slicer can load data in a variety of image formats, including DICOM [18], with the number of volumes loaded limited only by the memory available to the program. Slicer provides a GUI to import DICOM data from disk and query/retrieve data from a PACS system and, in addition, can add a variety of data formats popular in research, including NIFTI, NRRD, TIFF, and raw raster data. Slicer has integral support for a number of more specialized formats including label maps, tensor data, triangulated surface models, and diffusion-weighted images. Volumes can be associated with “look-up tables” (LUT) that can be used to assign colors and names to particular values in the volume. Slicer comes with a number of built-in LUTs and can also load customized LUTs. See also the discussion below regarding use of Slicer with real-time data.
Display
Images are typically displayed in 2D viewers which display three volumes: foreground, background and a label map, and a variety of combinations of blending and overlays of the three selected volumes. The images can be zoomed and panned. The contents of each of the 2D viewers can also be displayed in 3D viewers that can display triangulated surface models, cross-sectional slices, volume renderings, and a number of other specialized graphics such as glyphs for representing tensors and scalar fields associated with surface models (e.g., results of processing of brain images with www.freesurfer.net). In the 3D viewers, users can combine generated 2D and 3D displays. Also available are “compare” viewers (Fig. 19.4) that are configure to compare different images whereby a number of slices are arranged in a horizontal or vertical array. The layout manager provides a number of predefined configurations with combinations of 2D and 3D viewers.
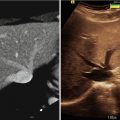
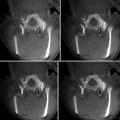
Fig. 19.4
These images from prostate therapy planning show the power of 3D Slicer in displaying multiple images using the “compareview” layout
Core Functions: Segmentation, Registration, and Volume Rendering
Segmentation
Segmentation is the process of labeling each image element in a data set to permit the grouping of like elements into regions or volumes. Thus, if a tumor appears dark in a data voxel, all dark elements might be labeled “tumor” and made, for example, a different color when the image is displayed. Slicer’s interactive framework includes the Editor described below and a number of semiautomated algorithms such as region growing [19] and fast marching [20]. The automated algorithms include a comprehensive EM segmentation framework and some level-set capabilities focused on segmentation of tubular structures. The EM segmenter can be used for segmentation of a number of objectives. A library of sample solutions provides ready-to-use solutions and starting points for modifications (see [21] for more information). VMTK, a processing package focused on segmentation and analysis of vessels, is available as an extension to Slicer. The modules contain tube-sensitive filters (for preprocessing) and level sets for the actual segmentation [22]. Atlas data libraries may also be loaded (Fig. 19.5).
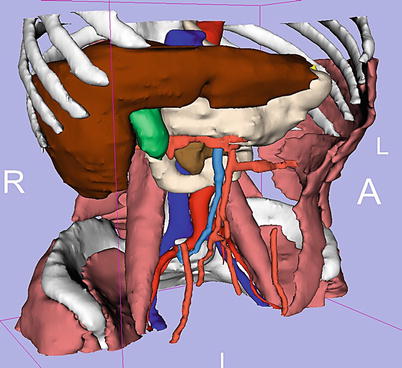
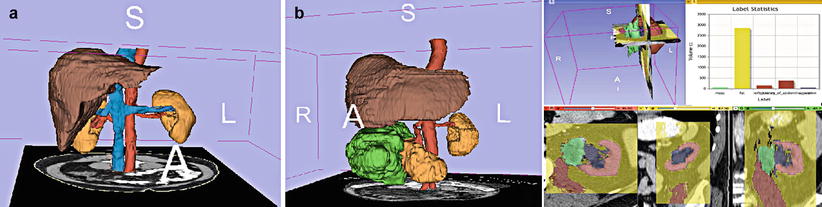
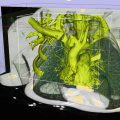
Fig. 19.5
Anatomic atlases play an important role as prior data to improve the speed of advanced segmentation. This abdominal atlas was created by the Slicer community and is available for free download
The Interactive Editor [23] is a framework for interactive segmentation of volumetric scalar data that contains a variety of tools called “effects.” Effects include a variety of capabilities from painting, polygonal outlining, and thresholding through many connectivity and morphology tools to a novel competitive region-growing algorithm called GrowCut [24] (see Fig. 19.6). Typically, a grayscale volume such as a structural MRI is used for the segmentation, and the results of the process are deposited in a “label map.” An informatics capability has been integrated into the Editor to allow it to split, edit, and merge multiple labels. A specialized module, ModelMaker, establishes a pipeline for generating multiple surface models from a label map. Names and colors are inherited from the label map LUT, and parameters allow for tuning the extent of smoothing and triangle reduction performed on the models [25]. The 3D extent of segmented structures can be used as a starting point for further analysis. For example, the label statistics module can be used to calculate the volumes of organs or tumors or to assess the distribution of signal intensities of a grayscale image with a user-defined region of interest.