Midline sagittal T1WI through the level of the central pons.
Osmotic Demyelination Syndrome
Primary Diagnosis
Osmotic demyelination syndrome
Differential Diagnoses
Acute infarction
Demyelinating disease
Central variant of posterior reversible encephalopathy syndrome (PRES)
Brainstem tumor
Imaging Findings
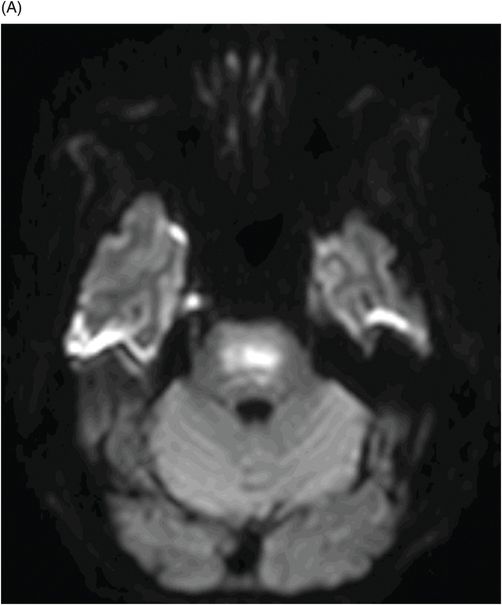
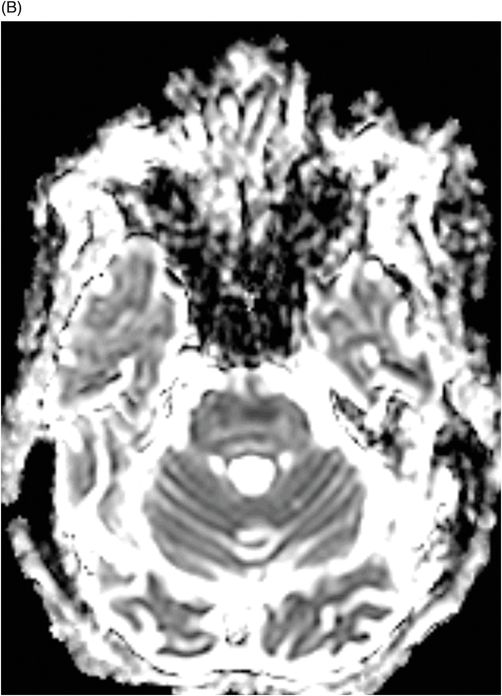
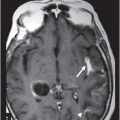
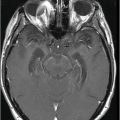
Fig. 80.1: Midline sagittal T1WI image demonstrated diffuse area of T1 hypointensity involving the central pons with relatively sparing of the peripheral aspect. Fig. 80.2: Axial FLAIR image through the middle of the pons demonstrated increased area of T2 signal within the central pons with relative sparing of the peripheral pons. Fig. 80.3: (A) Axial DWI and (B) ADC map through the same level demonstrated diffusion restriction at the central pons, in the area of abnormal T2 signal. Fig. 80.4: Axial FLAIR image through the basal ganglia demonstrated abnormally increased FLAIR signal involving bilateral putamen, as well as the head of the caudate nuclei.
Discussion
In this patient and clinical setting, the constellation of imaging abnormalities are diagnostic of osmotic demyelination syndrome (ODS). The rapid correction of hyponatremia in an ICU setting, with rapid-onset altered mental status is highly suspicious of ODS. Diffusion restriction and abnormal FLAIR signal at the central pons with sparing of the periphery is a typical imaging appearance associated with ODS. Abnormal FLAIR signal in the basal ganglia further suggests extrapontine involvement and diffusion restriction is conformational of the diagnostic acuity.
Although acute demyelinating plaque can have similar signal characteristics, the plaques are more commonly peripheral with variable extension to the central pons and the clinical context is different. Central variant of PRES is due to hypertensive emergency or other predisposing factors (see Part V: Case 62), unlike the predisposing factors causing ODS. The absence of mass effect and the clinical presentation is not suggestive of tumor.
Osmotic demyelination syndrome is a rare CNS disorder of unknown prevalence. Although it can involve patients of any age, the most common age of presentation is between 30 and 60 years, with a slight male predominance. The most common predisposing factor for ODS is rapid correction of hyponatremia. The exact mechanism of how the rapid change of natremic status induces demyelination is not known. Other common causes are alcoholism, liver transplantation, anorexia, and following hemodialysis in end-stage renal disease.
Patients typically present with rapid-onset confusion and seizures. This may be associated with bulbar or pseudobulbar palsy. Patients may have atypical movement if basal ganglia are involved. They may go through an intermediate improvement of symptoms as the natremic status reaches near to normalcy and then rapidly deteriorates again. With appropriate treatment, all of the symptoms can completely reverse. However, in severe cases, the patient may be in a coma for an extended period, may become quadriparetic, or may even die. If ODS is due to causes other than abnormal hematologic sodium levels, stabilization of the predisposing condition is necessary.
In the early phase of ODS, CT scans may appear completely normal. Evaluation of the pons with CT is limited because of artifacts. If there is strong clinical concern, then MRI should always be performed. In the acute stage, diffusion restriction may be the only finding, as other sequences appear normal. Over time, there is gradual development of T1 hypointensity and T2 hyperintensity that typically affects the central pons with sparing of the peripheral pons that may have a bat-wing pattern of involvement due to the sparing of the corticospinal tracts and the transverse pontine fibers. Hemorrhage is not a feature. Extrapontine abnormalities can be seen in up to 50% of cases and typically involves the basal ganglia.
Stay updated, free articles. Join our Telegram channel

Full access? Get Clinical Tree


