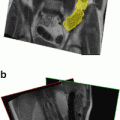
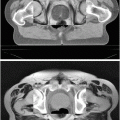
Fig. 1
CT data from a patient with congestive heart failure visualized using the Osirix DICOM viewer. The middle and right panels show the segmentation of the ascending aorta (enlarged)
For technical reasons, the IB method requires that neighboring points on the boundary be spaced apart no more than 1∕2 of the computational lattice meshwidth in order for the boundary not to leak. Consequently, the cross-section perimeters produced by segmentation are re-discretized so that interpoint distances are slightly less than 1∕2 of the intended lattice meshwidth and are uniform around the perimeter. All subsequent references here to discretized boundaries should be understood to mean boundaries re-discretized in this way.
Figure 2(upper) shows oblique views of two neighboring cross-sections of the ascending aorta just below the aortic arch. The aortic surface between these two perimeters can be defined by triangulation. We find a good triangulation by the following heuristic procedure. On each perimeter choose any point to be the first point and then compute the aggregate arclength to each subsequent point. The perimeter is periodic, so the last point is also the first point. Normalize so that the arclength from first point to last point is 1.0. Logically, the points from both perimeters could be thought of as coexisting on a line segment of length 1.0. We are going to connect points of one perimeter to points of the other, and it is convenient to maintain a pointer on each perimeter to the “current point”, which is the last point on that perimeter which has been connected to another point. Identify either perimeter as perimeter one and the other perimeter as perimeter two. Connect the current point of perimeter one to each point of perimeter two which has an arclength greater than that of the current point of perimeter two and which also has an arclength less than or equal to the arclength of the next point on perimeter one (or arclength = 1.0 if the current point of perimeter one is its last point). With each new connection, the current point of perimeter two is incremented. After making these connections, interchange perimeter identities, so the perimeter which had identity one now has identity two, and vice-versa. The cycle of connecting points and interchanging identities continues until the two last points are connected. These connections define the edges of a triangulation whose other edges lie on the perimeters. The aggregate length of the inter-perimeter edges depends on which points are chosen as the first points. We test all possible pairs of first points and choose the pair which results in the shortest aggregate length of the inter-perimeter edges. Figure 2(middle) shows this set of inter-perimeter edges for the perimeters in Fig. 2(upper). Figure 2(lower) shows the resulting surface triangulation.
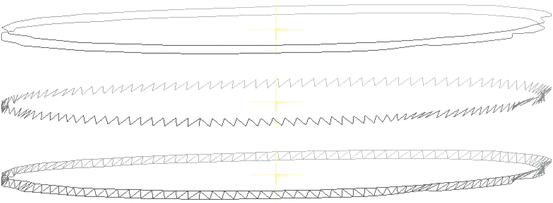

Fig. 2
Upper panel: oblique view of two neighboring cross-sections of the ascending aorta just below the aortic arch; Middle panel: set of edges having minimal aggregate length joining points of the discretized cross-sections; Lower panel: triangulation of the surface between the cross-sections
Applying this procedure to the entire data set results in triangulated surfaces for the major anatomical structures at end-systole: aorta and pulmonary artery; superior and inferior vena cava and pulmonary veins; right atrium; left atrium and appendage; right ventricle; left ventricular endocardium; left ventricular epicardium; the epicardium of the entire heart. The valves are produced by a procedure described later. In addition, we require a surface in the left ventricle, midway between the endocardium and epicardium. For each level at which there are both endocardial and epicardial cross-sections, a midwall cross-section can be constructed by averaging along line segments connecting the two cross-sections, drawn normal to the endocardial cross-section. In all cases the region of the apex is approximated by the plane of the most apical cross-section of the data set. Figure 3(L) shows the three surfaces (endocardial, midwall, epicardial) of the left ventricle (LV) with the front and rear clipped away to improve visibility.
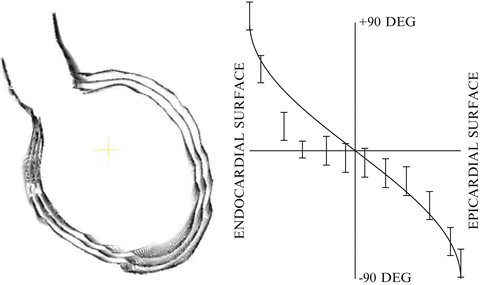

Fig. 3
Left panel: left ventricular endocardial, midwall and epicardial triangulated surfaces based on CT data. Right panel: fiber-angle distribution in the LV wall. Continuous curve is predicted by the asymptotic theory of Peskin [3], and vertical bars represent the observations of Streeter, et al. (ref. [7], Fig. 4, curve a) plotted with a tolerance of ± 10 o . Horizontal axis is radial distance through the wall with midwall at zero and epicardial and endocardial surfaces as indicated. Vertical axis is angle between cardiac fibers and a plane perpendicular to the axis of the left ventricle
3 Construction of Model Heart Fibers
The model heart is comprised of three types of structures in each of which fibers are constructed using variations on the same general theme: geodesics on surfaces. The three types of structure are: thick-walled (the LV), thin-walled (all other chambers and the great vessels), and valvular.
3.1 Model Left Ventricular Muscle Fibers
At the present time the technology for directly imaging cardiac muscle fibers (e.g., diffusion tensor MRI) is not sufficiently developed for our purposes. Instead, we approximate the muscle fibers in the left ventricle using a method motivated again by the observations of Streeter, et al. [6] and by an asymptotic analysis of Peskin [3]. From measurements on the hearts of macaques, and treating the left ventricle as a nest of ellipsoidal surfaces of revolution, Streeter observed that muscle fibers in the left ventricle follow trajectories that are approximately geodesic paths on those surfaces. Using an asymptotic approach, also treating the wall of the left ventricle as a nest of surfaces (but not necessarily ellipsoids) of revolution, Peskin was able to derive the relation between the angle made by the geodesics as a function of their distance from the midwall surface. The angle is measured relative to the latitude lines of an appropriate coordinate system constructed on the surface of revolution. Figure 3(R) (redrawn from [3]) shows the relation between angle and distance from the midwall surface.
We treat the midwall surface shown in Fig. 3(L) as if it were a surface of revolution, even though it is not. A coordinate system is constructed on this surface consisting of geodesic curves which radiate out from the apex and terminate at the upper cross-sections of the data set, above the mitral or aortic valve ring. These coordinates can be thought of as lines of longitude. Lines of latitude are constructed by joining points of equal arclength measured from the apex along the lines of longitude. It is an interesting theorem of differential geometry that the latitudes and longitudes so constructed form an orthogonal net, even when the surface on which the above construction is done is not a surface of revolution. Because the midwall surface is not in fact a surface of revolution, some of these longitude lines intersect. When a pair of longitude lines intersects, the longer of the longitudes is terminated at the intersection. This insures that when following a line of constant latitude there is a monotonic change in longitude.
Following Streeter’s observation, and the theoretical curve of Fig. 3(R), muscle fibers are parallel to the lines of latitude on the midwall surface. We construct families of model fibers by computing geodesic paths on the CT scan midwall surface, starting at locations equally spaced on, and initially parallel to, a line of constant latitude. Geodesics paths are computed in both directions (increasing longitude and decreasing longitude), terminating whenever a valve ring is encountered. When a geodesic crosses a longitude line, its angle with respect to the latitude line is calculated, and the intersection point is projected toward the epicardial or endocardial surface by the distance given by the theoretical curve of Fig. 3(R). In this way model muscle fibers fill the space between the epicardial and endocardial surfaces, and have an angular distribution through the wall which matches the observed distribution.
How are geodesics constructed? Recall that the surface is triangulated. Each triangle in such a structure “knows” which triangles are its neighbors. Each triangle shares each of its edges either with another triangle or with nothing (in the case of edges on the upper end of the CT scan). No triangle shares any two of its edges with the same other triangle. It is straightforward to construct a map that indicates the other triangles with which any triangle shares edges. A triangle is a plane figure, so on each triangle a local coordinate system may be constructed having one unit vector normal to the plane of the triangle and two unit tangent vectors in the plane of the triangle. If a line is drawn from a point within any triangle in a known direction in the plane of the triangle, its intersection with one of the edges of the triangle is easily calculated. From these considerations geodesic curves on the surface are constructed as follows: draw a straight line or ray emanating from a point on a latitude line in one direction along the latitude line. Call the triangle containing the starting point “the current triangle”. The drawn ray, straight and in the plane of the triangle, is a geodesic of the triangle by definition. Calculate the intersection point of the drawn ray with an edge of the current triangle (there can be only one such point). Determine which triangle shares that edge with the current triangle, and call that triangle “the next triangle”. The vector in the direction of the drawn ray intersecting the edge can be decomposed into two components, along the edge and normal to the edge within the current triangle, and then recomposed along the edge and normal to the edge within the next triangle. The component along the edge is unchanged since the edge is shared; the component which was normal to the edge within the current triangle retains its magnitude but changes its direction to be normal to the edge within the next triangle. The ray drawn in the next triangle line has a known starting location (on the edge) and a known direction. Rename the next triangle as the current triangle, and repeat the drawing process just described. The result is a piecewise linear geodesic path on a triangulated surface. Note that the path is not necessarily the globally shortest path between the endpoints, but is the shortest path given the particular starting direction, which is sufficient for a geodesic path.
Figure 4 (upper row) shows the lines of longitude on the midwall surface (left panel), and a family of midwall-surface geodesics starting on a latitude line near the apex (right panel). Notice that even though geodesics are initially perpendicular to longitude lines (near the apex), they become more longitudinal as they rise (toward the base). Figure 4 (middle row, left panel) shows several families of geodesics on the midwall surface, each family arising from one of a set of regularly spaced latitude lines.
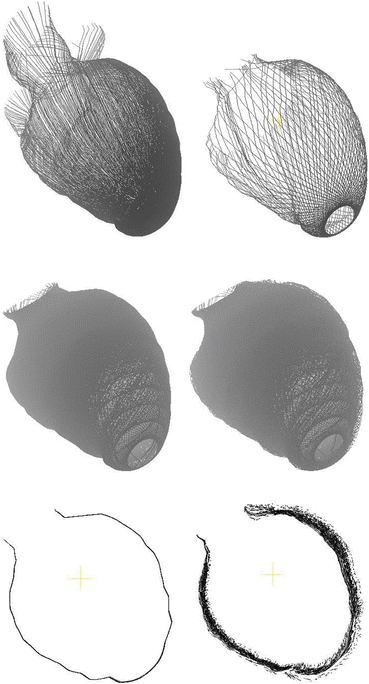

Fig. 4


Upper left panel shows midwall-surface longitude lines; upper right panel shows a family of midwall-surface geodesics arising from a latitude line near the apex; middle left panel shows families of midwall-surface geodesics arising from several regularly spaced latitude lines; middle right panel shows fibers inflated from the midwall-surface geodesics to fill the LV wall; lower left panel shows a thin cross-section through the midwall-surface geodesics; lower right panel shows a thin cross-section through the inflated fibers
Stay updated, free articles. Join our Telegram channel

Full access? Get Clinical Tree


