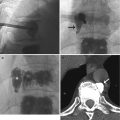
Fig. 15.1
(a) US image of the left lobe of the liver shows the stomach obscuring the aorta and inferior vena cava. (b) Coronal contrast-enhanced reconstructed CT image shows a large aortocaval lymph node metastasis
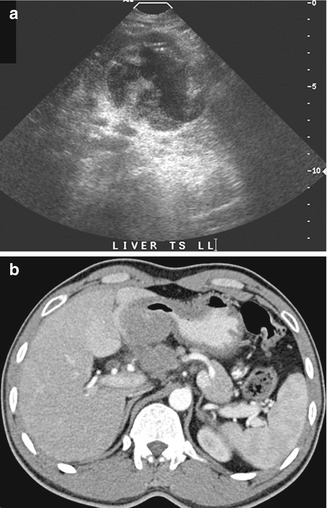
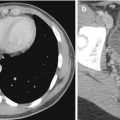
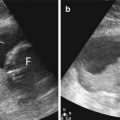
Fig. 15.2
(a) US image of the liver shows a mass that was interpreted as an exophytic tumor arising from the left lobe. Note that the small tail from the cystic area appears to continue into another structure. (b) Axial contrast-enhanced CT image performed contemporaneously shows that the mass is a stomach tumor that presses into the liver but does not apparently invade the liver parenchyma
The optimal setting of ultrasound parameters is necessary to avoid artifacts that can lead to misdiagnosis. One example that can happen is if the setting for contrast is poor and background noise is too high. If the gain is persistently set too high (Fig. 15.3a), the practitioner will fail to appreciate a hypoechoic thrombus (Fig. 15.3b). The use of color Doppler imaging helps to show patency in blood vessels but has its own challenges (Fig. 15.4a). The position of the main portal vein is often parallel to the sound beam (Fig. 15.4b). This can result in a lack of Doppler signal that is an artifact rather than a true pathology (Fig. 15.4c). Unless there is meticulous attention to technique, it is easy to misinterpret the images acquired (Grant et al. 1992).
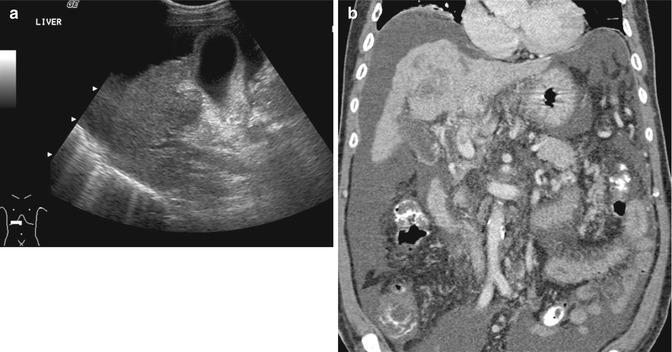
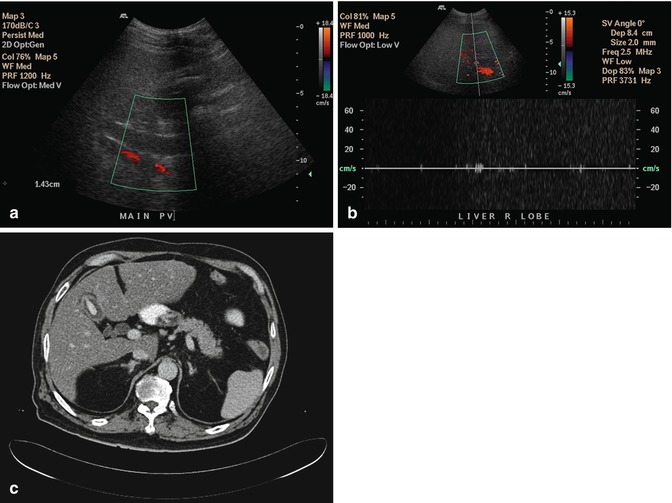
Fig. 15.3
(a) US image of the liver shows that the portal vein is hypoechoic in appearance but was interpreted as being normal. (b) Coronal contrast-enhanced reconstructed CT image done contemporaneously shows a small thrombus in the main portal vein as well as a tumor in the cirrhotic liver. The ascites is consistent with liver failure
Fig. 15.4
(a) US image of the liver shows that the portal vein does not show color signal and is hypoechoic in appearance. This was interpreted as portal vein thrombosis. (b) The use of pulsed-wave Doppler does not show signal in the portal vein as the angle of insonation is perpendicular to the blood flow. This reinforced confirmation bias that there was a portal vein thrombosis. (c) Axial contrast-enhanced CT image done contemporaneously shows no portal vein thrombosis and that the US image was interpreted erroneously
The surface of the liver can be evaluated for the presence of nodules in the diagnosis of cirrhosis (Allan et al. 2010). Routine scans with a lower-frequency transducer (Fig. 15.5a) may not show the surface nodularity (Fig. 15.5b) that characterizes this disease. Subtle changes in echogenicity due to pathology can be difficult to discern (Fig. 15.6). Harmonic imaging can enhance native tissue contrast (Tanaka et al. 2000). A different issue can occur when the lesion is so large that it fills the field of view (Fig. 15.7a). The lack of a border between normal and abnormal tissue makes it difficult to recognize alterations in echotexture (Shin et al. 2010) (Fig. 15.7b).
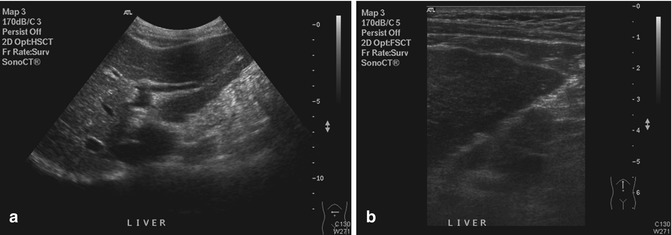
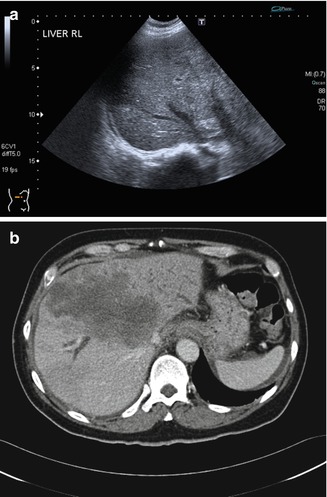
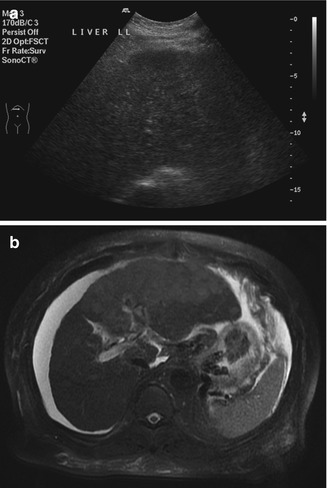
Fig. 15.5
(a) US image shows that the anterior surface of the left lobe of the liver appears as a smooth echogenic line. (b) High-resolution US image of the same liver shows the surface nodularity in greater detail
Fig. 15.6
(a) US image of the liver shows a subtle change in the echotexture of the right lobe in segment 8 (between the right and middle hepatic vein). This was not appreciated by the individual performing and interpreting the scan. (b) Axial contrast-enhanced CT image done contemporaneously shows a large metastasis in the liver. Note that there is also bile duct dilatation
Fig. 15.7
(a) US image of the liver shows that the left lobe appears nodular in echotexture. This was interpreted as being consistent with a known diagnosis of cirrhosis. (b) Axial T2-W MR image shows that most of the left lobe has been replaced by a tumor. Unless there is normal tissue for comparison, it can be difficult to discern that an infiltrative process has occurred
The ultrasound imaging characteristics of focal liver lesions have been described relative to normal liver parenchyma. However, many patients have diffuse liver disease that can change the background echogenicity (Konno et al. 2001). For example, a hemangioma in a fatty liver can appear hypoechoic instead of hyperechoic (Fig. 15.8a). Unlike CT and MRI, intravenous contrast agents are not used routinely in most abdominal ultrasound scans, so the use of the enhancement characteristics is not possible (Fig. 15.8b). A possible solution is to perform a contrast-enhanced ultrasound scan with microbubble agents such as SonoVue (Bartolotta et al. 2007) or Sonozoid.
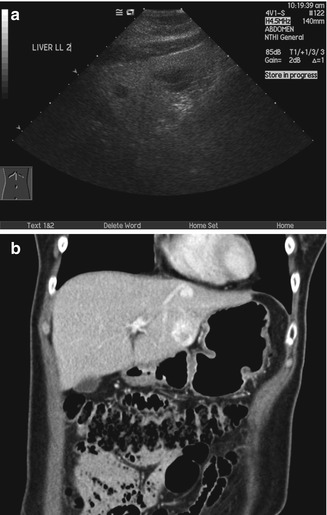
Fig. 15.8
(a) US image of the liver shows two hypoechoic nodules in the left lobe. The liver shows increased echogenicity due to fatty change. (b) Coronal multiphase reconstructed CT image shows that both lesions enhance in the portal venous phase. The pattern of enhancement over time was typical of hemangiomas (not shown)
Being sensitive to transient changes in liver pathology can be an advantage. For example, in acute hepatitis, decreased liver echogenicity results in prominence of the portal triads (Needleman 1988). This may show changes (Fig. 15.9a) even when the CT image appears normal (Fig. 15.9b). Stability of focal liver lesions is often used to decide if it is benign. However, this should not override the imaging characteristics. Even some benign lesions can show rapid growth. In this illustrative case of multiple potential pitfalls, the initial ultrasound image showed a hypoechoic lesion on a background of fatty liver (Fig. 15.10a). When the MRI was performed, a diagnosis of focal nodular hyperplasia was made on the basis of the enhancement characteristics (Fig. 15.10b). On follow-up, the lesion gradually increased in size (Fig. 15.10c). Although there was no other feature to suggest otherwise, this was taken to indicate malignancy (Choi and Freeny 1998). After resection, the final diagnosis was focal nodular hyperplasia.
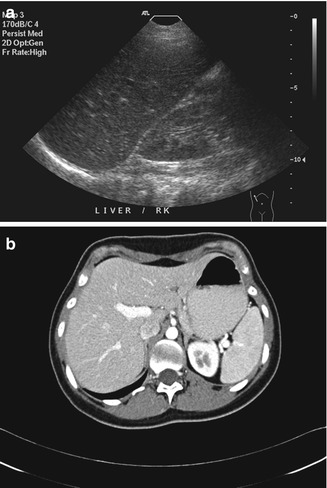
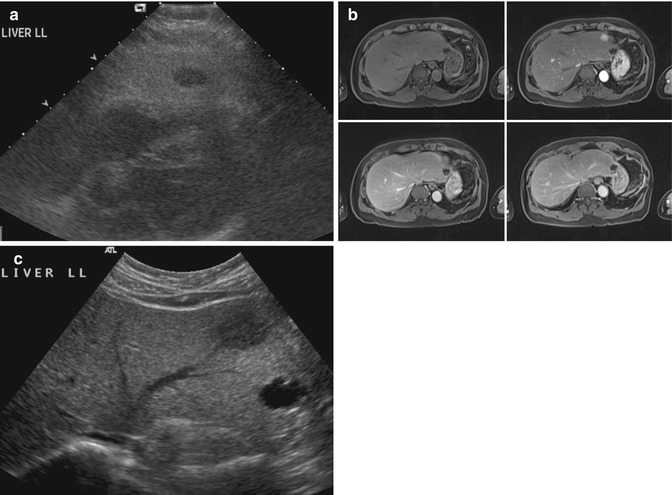
Fig. 15.9
(a) US image of the liver taken during acute hepatitis shows prominence of the portal triads. The finding is believed to be due to decreased liver echogenicity. Note that the liver and the kidney are similar in echogenicity. (b) Axial contrast-enhanced CT image done contemporaneously shows no discernible abnormality
Fig. 15.10
(a) US image of the liver shows a small hypoechoic nodule on a background of fatty change. (b) Axial contrast-enhanced fat-suppressed T1-W MR images show that the lesion has immediate homogeneous enhancement that becomes isointense with the rest of the liver in the other phases. This was interpreted as being consistent with focal nodular hyperplasia. (c) Follow-up US image done 2.5 years after the index scan shows an increase in the size of the lesion
15.2.2 Gallbladder
The gallbladder is an area where ultrasound imaging shows excellent spatial resolution. Unusual presentations of disease can mimic other conditions. For example, acute hepatitis is known to cause marked gallbladder wall edema. This can mimic tumor (Teefey et al. 1991) (Fig. 15.11a). The use of higher-frequency transducers improves axial resolution and allows demonstration of the striated thickened wall (Fig. 15.11b), a feature that is more commonly seen in inflammation (Joo et al. 2013). Certain pathologies are well demonstrated with ultrasound imaging. The typical features of adenomyomatosis can be seen with ultrasound imaging (Fig. 15.12a). The lower resolution of CT means that the dilated Rokitansky-Aschoff sinuses are not clearly seen (Fig. 15.12b). MR images show greater detail due to the ability to use different pulse sequences that are sensitive to different types of tissue (Fig. 15.12c). The use of the twinkling artifact (Fig. 15.12d) is a unique technique that helps to confirm the presence of small stones in the dilated Rokitansky-Aschoff sinuses (Yu et al. 2012).
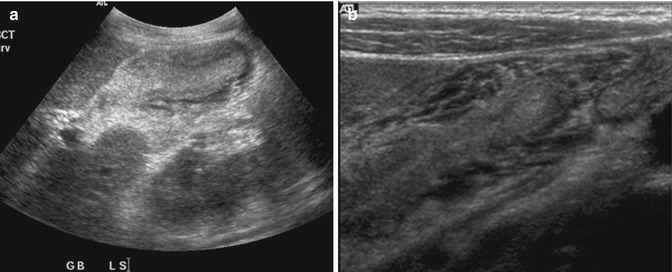
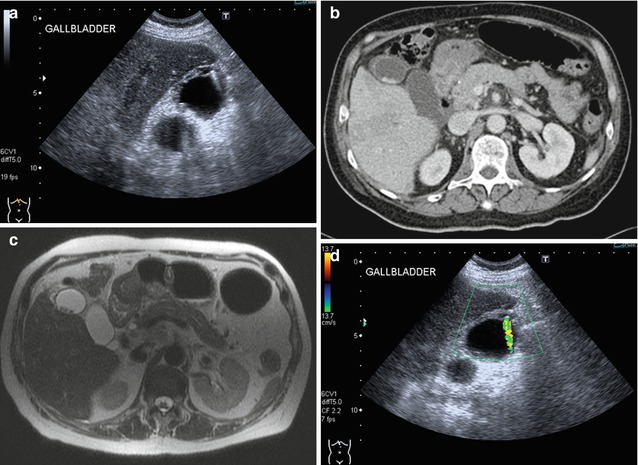
Fig. 15.11
(a) US image shows that the gallbladder is small in volume and the lumen is collapsed. The wall appears hypoechoic in the periphery and hyperechoic centrally. (b) High-resolution US image of the same gallbladder shows the striated edematous wall in greater detail. This appearance is more commonly seen in edema than tumor, especially if the lumen has been compressed by the thickened wall
Fig. 15.12
(a) US image of the gallbladder shows a thick-walled fundus with comet tail artifacts arising from the wall due to dilated Rokitansky-Aschoff sinuses. Gallstones are seen in the fundus. (b) Axial contrast-enhanced CT image done contemporaneously shows the wall thickening and gallstones but does not have sufficient spatial or contrast resolution to show the dilated Rokitansky-Aschoff sinuses. (c) Axial T2-W MR image done contemporaneously shows wall thickening and gallstones. In addition, the use of a T2-weighted sequence shows small fluid collections within the thick-walled fundus that are due to dilated Rokitansky-Aschoff sinuses. (d) Color Doppler US image shows a twinkling artifact arising from the thickened wall. This helps to distinguish a Rokitansky-Aschoff sinus with a stone inside it from a thickened wall
Due to the superior contrast resolution of ultrasound imaging, small gallbladder masses can be better depicted. A small fundal mass that may be difficult to appreciate on CT (Fig. 15.13a) is obvious on ultrasound imaging (Fig. 15.13b). Appropriate weight should be placed on the most worrying imaging feature seen in clinical decision making. Attention to scanning parameters is important. The presence of bile provides excellent contrast between the lumen and the wall. The excessive use of overall gain to increase signal can worsen the signal-to-noise ratio and obscure pathology. Even gallstones, which have inherently high signal-to-noise ratio, can be overlooked if the scanning parameters are poor (Fig. 15.14). The use of harmonic imaging can restore the signal-to-noise ratio by reducing side lobe artifacts (Oktar et al. 2003).
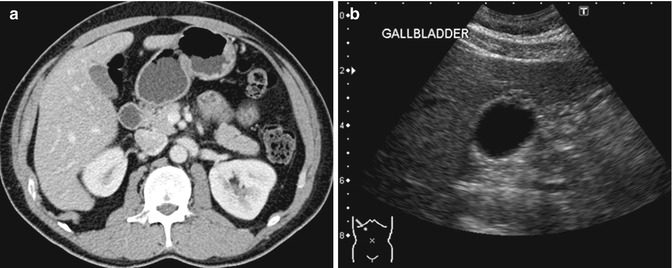
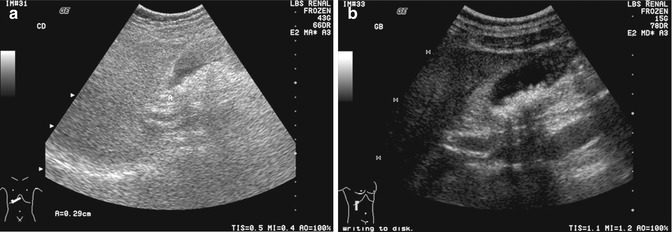
Fig. 15.13
(a) Axial contrast-enhanced CT image shows slight thickening of the fundus of the gallbladder. (b) Corresponding US image shows a focal thickening with small cystic spaces within the mass. The cystic spaces are not seen in the CT image. This finding is consistent with an adenomyoma of the gallbladder
Fig. 15.14
(a) US image of the gallbladder shows that the gallstones are obscured by the use of excessive overall gain. Note that the fluid-filled structures, e.g., the gallbladder, common duct, and portal vein are hypoechoic instead of anechoic in appearance. (b) US image is optimized by reducing the field of view to improve spatial resolution, using harmonic imaging to reduce side lobe artifacts and reducing the overall gain from 43 to 15 dB
15.2.3 Pancreas
The pancreas is usually partly obscured in transabdominal ultrasound scans. This is due to the stomach and bowel loops that often move in and out of the field of view as they undergo peristalsis. Despite this, the head and body can be visualized in most patients. A failure to remember a fixed mass should be evaluated further can lead to a failure to appreciate a large pancreatic head mass (Bondestam 1983) (Fig. 15.15a). It is worthwhile to spend time examining the pancreas in detail as it is often a location of symptomatic pancreatic and biliary disease (Fig. 15.15b).
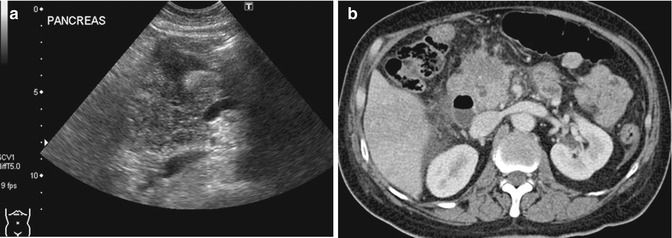
Fig. 15.15
(a) US image shows that the head of the pancreas is enlarged and has a heterogeneous appearance. The presence of multiple loops of bowel in the adjacent region can be distracting as they often show peristalsis. (b) Axial contrast-enhanced CT image done contemporaneously shows an enlarged pancreatic head with an infiltrative hypodense mass and mild dilatation of the common duct
15.2.4 Kidneys
The kidney is relatively easier to evaluate with ultrasound imaging compared to the pancreas and the liver. Usually, the entire kidney can be seen, as the acoustic window available for imaging does not get obscured by the ribs or bowels. Many of the same pitfalls that occur in the liver can also occur in the kidney (Kang and Chandarana 2012). A renal tumor may be difficult to detect when it merges with the rest of the renal tissue (Fig. 15.16). Optimization of scanning parameters and a high index of suspicion are required to avoid such errors. Although there was a pertinent history of gross hematuria, the initial interpretation of the kidney was normal as it was erroneously believed that a renal tumor would be hypoechoic and mass-like.
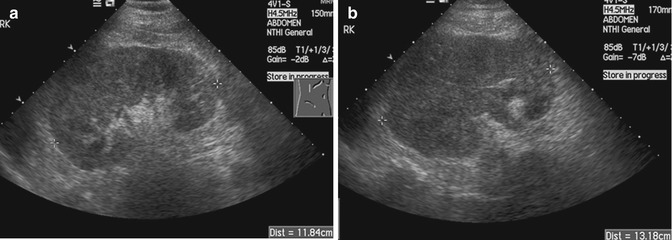
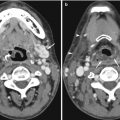
Fig. 15.16
(a) US image of the right kidney shows eccentric thickening of the renal cortex. There is loss of corticomedullary differentiation. (b) Follow-up US image done 4 months later shows progression of the tumor. There is an increase in the size of the kidney, greater loss of corticomedullary differentiation, and extension into the renal vein
The renal pelvis is often evaluated with ultrasound imaging for the diagnosis of hydronephrosis (Jeffrey and Federle 1983). Errors in diagnosis are often due to an overcall, i.e., making a diagnosis when the disease is not present. In patients with acute pyelonephritis, mild separation of the renal pelvis and mucosal edema should not be mistaken for true obstruction (Fig. 15.17). Hydronephrosis should be evaluated before and after the patient has emptied the urinary bladder. Otherwise, reversible pelvicalyceal distension will be mistaken for hydronephrosis (Fig. 15.18).
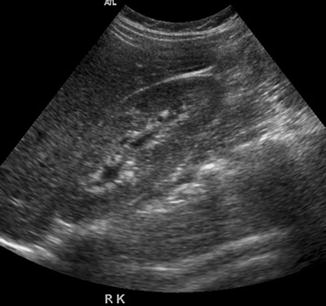
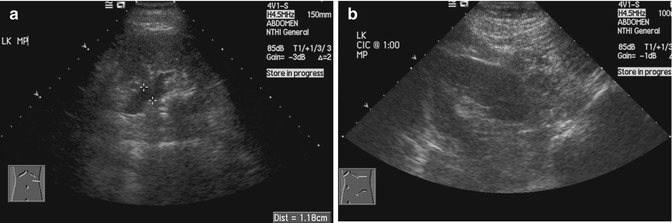
Fig. 15.17
US image of the right kidney in a young woman with pyelonephritis shows mild separation of the renal calyces with thickening of the mucosa due to edema
Fig. 15.18
(a) US image of the kidney shows dilatation of the renal pelvis (between cursors) in this patient with spinal cord injury. (b) US image done after self-catheterization and emptying the urinary bladder shows that the renal pelvis has collapsed and no more dilatation is seen
15.3 CT and MRI
Lesion detection on CT relies on a differential attenuation between the lesion and the surrounding visceral organ parenchyma or intra-abdominal fat. Intravenous (IV) administration of an iodinated contrast agent is indicated in most instances, with the exception of CT KUB where the primary aim is to look for calculi within the urinary systems. In multiphasic CT studies of the solid visceral organs, specifically of the liver, kidneys, and pancreas, a non-enhanced CT is mandated. This serves as a baseline for evaluation of the presence of enhancement within a lesion (Fig. 15.19). The need for oral contrast administration is controversial; high accuracy rates of diagnosis have been shown in patients with acute appendicitis and blunt abdominal trauma without using oral contrast in CT, as well as in oncology patients undergoing imaging follow-up (Lee et al. 2006, 2013; Anderson et al. 2009; Harieaswar et al. 2009) (Fig. 15.20). Modern-day CT scanners all provide high spatial resolution, thus allowing for multiplanar reformatted images to enable better appreciation of the anatomic relations, particularly for large masses and for lesions that lie in close proximity to vascular structures (Fig. 15.21). CT is the imaging modality of choice for most acute conditions because of its high temporal resolution.
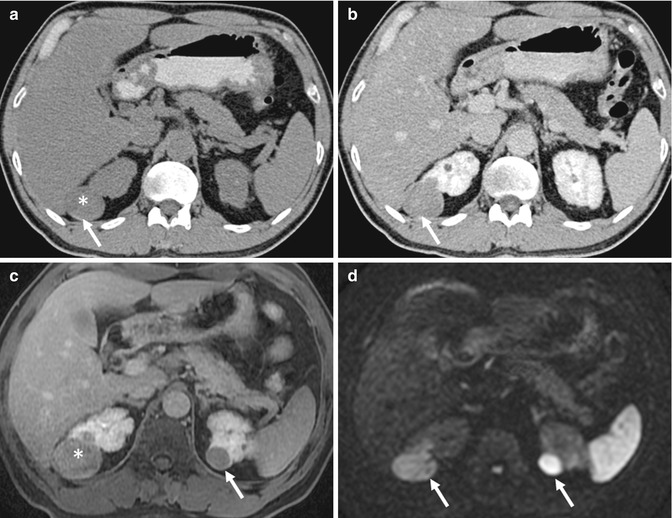
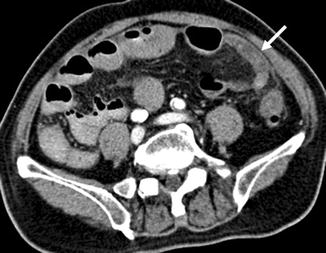
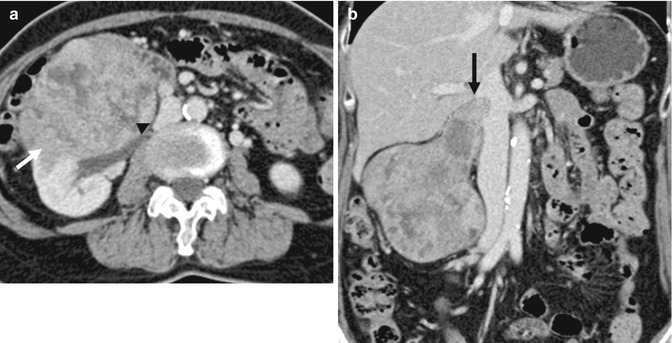
Fig. 15.19
(a) Axial non-enhanced CT (NECT) image shows a well-circumscribed hypoattenuating lesion (asterisk, 30 HU) in the upper pole of the right kidney that has a thin rim of calcification (arrow). This was perceived to be a hyperdense cyst with a thin layer of calcium in the dependent portion. (b) Axial contrast-enhanced CT (CECT) image shows the lesion to remain diffusely hypoattenuating, with rim enhancement. This was mistaken to be a complicated cyst. However, when the Hounsfield density was measured, there was a rise of 25 HU following contrast administration, compatible with an enhancing solid lesion. (c) Axial contrast-enhanced gradient-echo T1-W MR image performed during follow-up 3 years later shows the lesion (asterisk) in the upper pole of the right kidney, along with a new lesion in the upper pole of the left kidney (arrow). These are poorly enhancing as well. (d) However, the lesions (arrows) are hyperintense on axial diffusion-weighted (DW) MR imaging, consistent with restricted diffusion. Biopsy of the lesions confirmed the diagnosis of papillary renal cell carcinoma
Fig. 15.20
Axial CECT image shows a blind-ending bowel loop in keeping with a dilated vermiform appendix (arrow). There is stranding of the periappendiceal fat consistent with acute inflammation. The appendix is located in the left iliac fossa due to non-rotation of the bowel. CT has very high sensitivity and specificity in the diagnosis of acute appendicitis
Fig. 15.21
(a) Axial CECT image shows a large infiltrative mass (arrow) that involves the right kidney and is displacing the inferior vena cava (arrowhead). (b) Coronal reconstructed CECT image shows the mass to invade along the right renal vein into the inferior vena cava (arrow). The imaging findings are consistent with a renal cell carcinoma but the histology returned as leiomyosarcoma. This most likely arose from the right renal vein
MRI, by virtue of its superior soft tissue contrast, is able to depict soft tissue lesions, often without the use of gadolinium contrast agent. Nevertheless, routine IV administration of gadolinium chelate contrast agents for imaging of the abdomen should be performed, unless the patient has renal impairment at risk for nephrogenic systemic fibrosis (Willicombe and Cunningham 2008). For rectal and prostate imaging, IV contrast administration is not necessary, unless it is for perfusion imaging. MRI is usually better able to depict subtle enhancement; this is by virtue of its better soft tissue contrast. Like on CT, a pre-contrast T1-weighted image should also be performed, since proteinaceous or hemorrhaging contents within lesions result in inherently high relaxivities and T1 signal intensity (Fig. 15.22). MRI may also allow for assessment of diffusivity of water molecules (diffusion-weighted imaging, DWI) that is usually, but not always, reduced in malignant lesions that tend to be more cellular in nature (Padhani et al. 2009) (Figs. 15.23 and 15.24). Spatial resolution on MRI can be comparable to CT, although through plane resolutions are typically poorer, due to limitations of scan time. This is countered by the fact that MRI allows for multiplanar acquisition, thus allowing the in-plane resolution to be good in all orthogonal planes. MRI scans take significantly longer than CT. MRI is considered to be the “problem-solving” modality for characterization of lesions found on ultrasound imaging or CT.
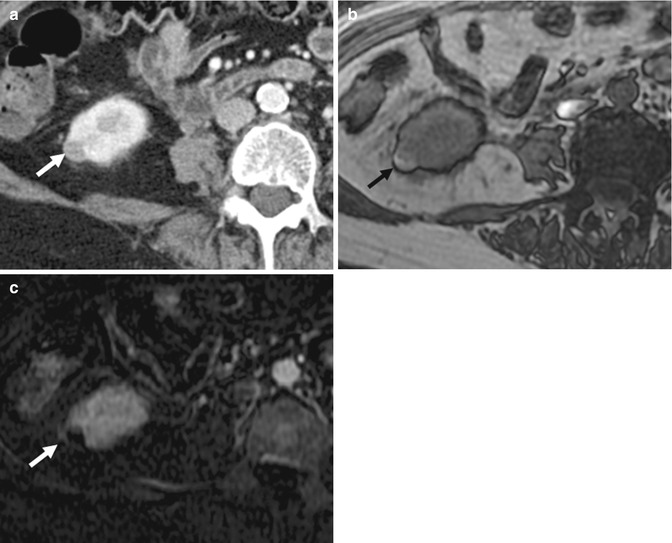
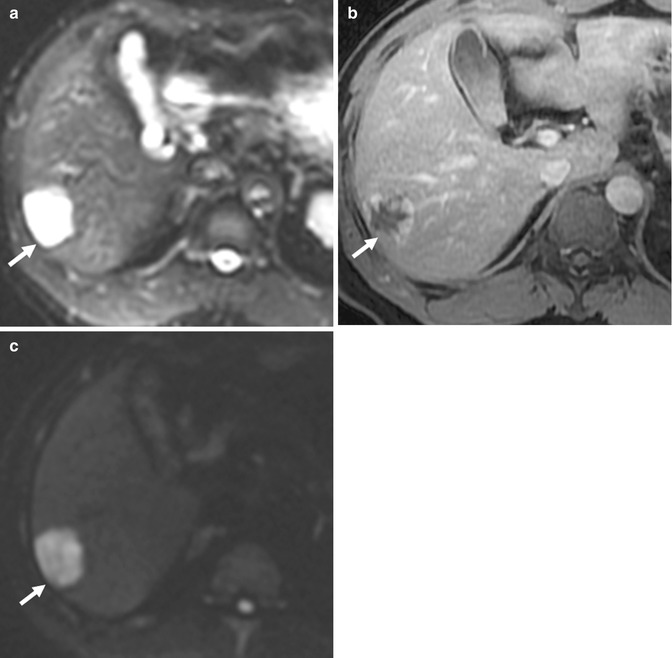
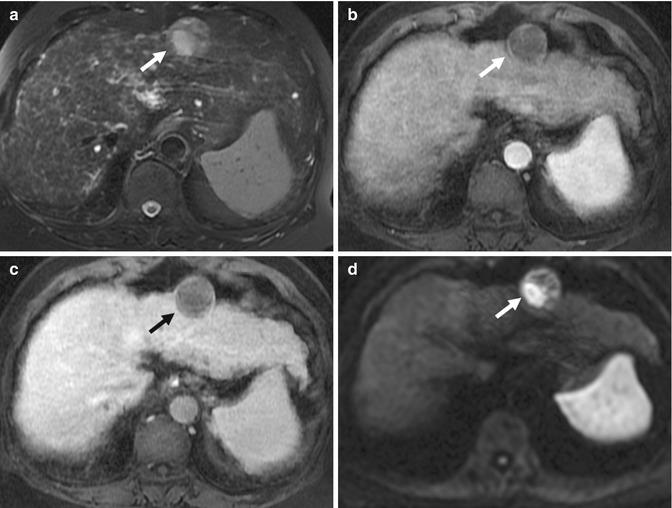
Fig. 15.22
(a) Axial CECT image of the lower pole of the right kidney shows a small well-circumscribed lesion (arrow) that is hypoattenuating compared to the renal parenchyma. (b) Axial opposed-phase gradient-echo T1-W MR image shows the same lesion (arrow) as a hyperintense structure. It is devoid of fat. (c) Axial subtracted contrast-enhanced T1-W MR image of the same lesion (arrow) shows absence of enhancement. This is consistent with a hemorrhagic cyst
Fig. 15.23
(a) Axial fat-suppressed echo-planar T2-W MR image of the liver shows a profoundly hyperintense lesion in the right lobe (arrow). (b) Axial contrast-enhanced T1-W MR image of the lesion (arrow) shows classic peripheral nodular enhancement of a hepatic hemangioma. (c) Axial DW (b = 1,000) MR image of the same lesion (arrow) shows increased signal. The ADC value in the lesion was 36 × 10−3. This overlaps with the ADC value seen in some malignant lesions
Fig. 15.24
(a) Axial fat-suppressed fast spin-echo T2-W image of the liver shows a hyperintense nodule (arrow) in the lateral segment of the left lobe. (b) Axial contrast-enhanced T1-W MR image of the lesion (arrow) shows lack of arterial enhancement. The surrounding liver parenchyma shows features of cirrhosis. (c) Axial contrast-enhanced T1-W MR image of the lesion (arrow) in the portal venous phase shows a persistent hypovascular appearance. (d) Axial DW (b = 1,000) MR image of the same lesion (arrow) shows a focus of hyperintensity. Biopsy confirmed hepatocellular carcinoma
15.3.1 Liver
The liver is the major organ for metabolism of nutrients delivered via the portal vein. Hepatic steatosis is a common finding, especially in patients from developed countries. Diagnosis of steatosis of the liver can be made on ultrasound scans (diffuse parenchymal hyperechogenicity), CT (diffuse parenchymal hypoattenuation), and MRI (diffuse parenchymal loss of signal on opposed phase of dual-echo T1 gradient sequence) (Cassidy et al. 2009; Ma et al. 2009). Occasionally, fatty infiltration or fat sparing may present as nodular lesions that may be mistaken for mass lesions. In these cases, MRI should be performed to make the definitive diagnosis and to avoid invasive percutaneous biopsy. On dual-echo imaging, the presence of iron deposition in the liver parenchyma may pose as a confounder, given the T2* effects of iron on gradient-echo imaging (Sirlin and Reeder 2010) (Fig. 15.25). Therefore, it is important for the inphase acquisition to occur at a later point in time compared to the opposed-phase acquisition (Merkle and Nelson 2006).
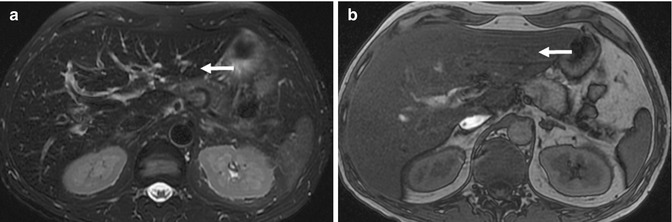
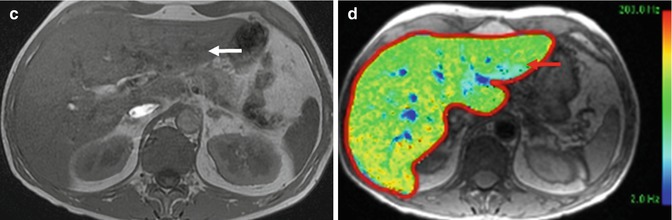
Fig. 15.25
(a) Axial fat-suppressed fast spin-echo T2-W image of the liver (arrow) shows diffuse hypointensity of the liver parenchyma. This is highly suggestive of iron deposition. (b) Axial opposed-phase gradient-echo T1-W MR image shows signal loss in the liver (arrow) consistent with fat deposition. (c) Axial inphase gradient-echo T1-W MR image shows diffuse low signal in the liver (arrow) consistent with iron deposition. In the presence of both fat and iron deposition, evaluation becomes more difficult. (d) Axial multi-echo T1-W gradient MRI map of the liver (arrow) confirms mild diffuse iron deposition
Definitive diagnosis of focal hepatic lesions is often challenging in clinical practice, particularly in an asymptomatic patient, and when the clinical and laboratory findings are not helpful. In patients at risk for hepatocellular carcinoma (HCC), i.e., chronic hepatitis B or C and/or cirrhosis due to any cause, any lesion greater than 1 cm in size that shows early (arterial) enhancement and (delayed) washout is considered to be HCC (Bruix et al. 2011). This will allow treatment to proceed without a histologic diagnosis. In clinical practice, common focal hepatic lesions in the liver that show early enhancement include hemangiomata, focal nodular hyperplasia (FNH), and hepatocellular adenoma. Hemangiomata and FNH can usually be diagnosed with certainty, obviating the need for biopsy. Less well-described features would be atypical hemangiomata and FNH that show interval change in size (Fig. 15.26).
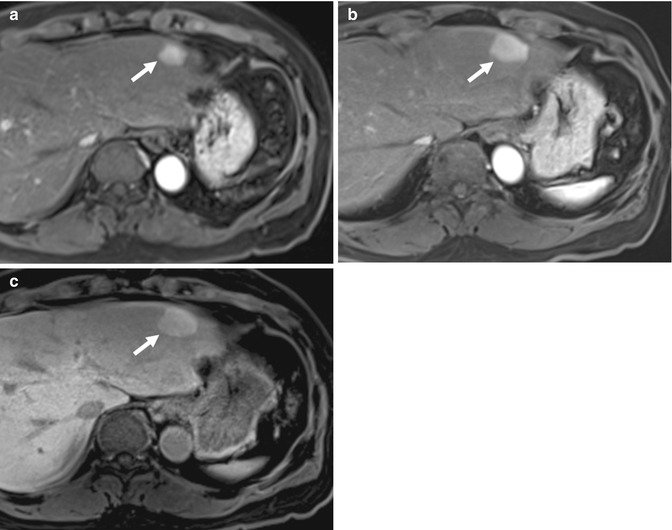
Fig. 15.26
(a) Axial contrast-enhanced T1-W MR image of the liver shows an arterial-enhancing nodule (arrow) in the lateral segment of the left lobe. (b) Axial contrast-enhanced T1-W MR image of the same lesion done 2 years later shows an interval increase in size. (c) Axial contrast-enhanced T1-W MR image of the lesion taken in the hepatobiliary phase shows homogeneous uptake of hepatocyte-specific contrast agent (gadoxetic acid, Primovist), in keeping with focal nodular hyperplasia. This was confirmed histologically
Additionally, small HCCs do not always show classic features of arterial enhancement and washout. In some cases, use of hepatocyte-specific contrast gadolinium chelate agents (gadobenate dimeglumine, MultiHance, Bracco, and gadoxetic acid, Primovist, Bayer) and correlation with diffusion-weighted images may help to confirm the diagnosis of HCC (Park et al. 2013) (Figs. 15.27 and 15.28). However, increasing experience with the use of such contrast agents have led to many exceptions to the rule, where even non-hepatocyte-containing lesions such as focal eosinophilic infiltration can show retention of contrast material, albeit through a different mechanism of action (Chung et al. 2013) (Fig. 15.29). Where necessary, biopsy should be considered to avoid missed diagnosis of HCC, which can be treated successfully in the early stages through local ablation or resection (Sherman 2010; Tan et al. 2011).
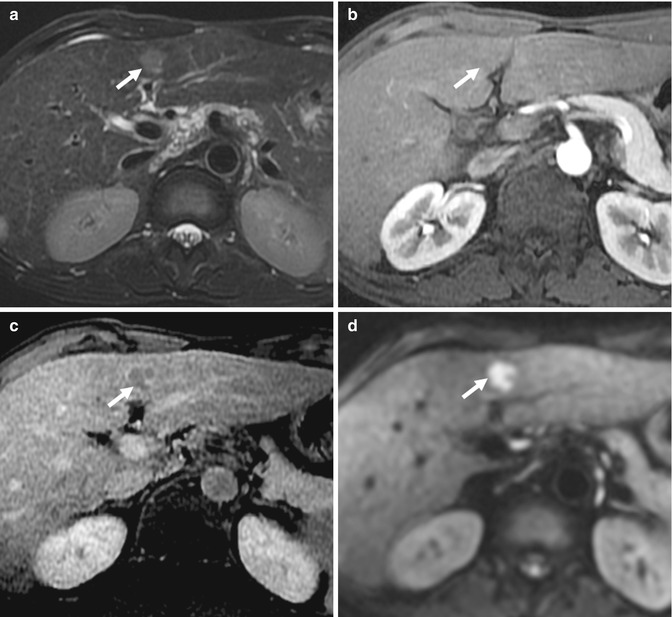
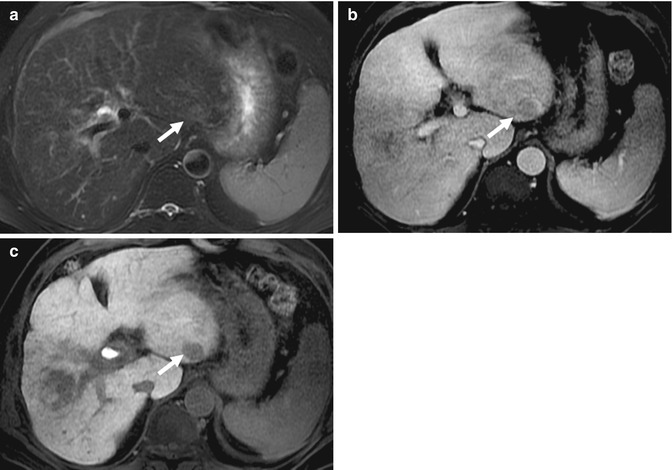
Fig. 15.27
(a) Axial fat-suppressed fast spin-echo T2-W image of the liver shows a T2 intermediate signal intensity nodule (arrow) adjacent to the falciform ligament. (b) Axial contrast-enhanced T1-W MR image of the same lesion (arrow) in the arterial phase shows no enhancement. (c) Axial contrast-enhanced T1-W MR image of the same lesion (arrow) in the equilibrium phase shows a nodular lesion with washout. The liver parenchyma shows features of cirrhosis. (d) Axial DW MR image of the lesion (arrow) shows restricted diffusion. Biopsy diagnosis was hepatocellular carcinoma
Fig. 15.28


(a) Axial fat-suppressed fast spin-echo T2-W image of the liver shows a faintly T2-hyperintense nodule (arrow) in the lateral left lobe. (b) Axial contrast-enhanced T1-W MR image of the same lesion (arrow) in the equilibrium phase shows a questionable lesion in the presence of an aortic pulsation artifact. There was no arterial enhancement (not shown). (c) Axial contrast-enhanced T1-W MR image of the same lesion (arrow) in the hepatobiliary phase 20 min after IV administration of gadoxetic acid. The lesion does not take up the contrast agent. This was biopsied and shown to represent hepatocellular carcinoma
Related posts:
Stay updated, free articles. Join our Telegram channel
Full access? Get Clinical Tree
