Fig. 11.1
Hypoattenuation in the fissula ante fenestram in an 8-year-old patient. (a) Axial CT image shows faint area of hypoattenuation anterior to the oval window (arrow). (b) Coronal CT image shows curvilinear appearance of the hypoattenuation focus (arrow)
The other area of hypoattenuation from normal variation in young children is at the petrous apex, just anteromedial to the basal turn of the cochlea. Moser et al. (2008) stated that this hypoattenuation focus is always found in the presence of the hypoattenuation at the fissula ante fenestram and correlated to a cancellous bone protruding from the middle layer of otic capsule with a cartilaginous cap on histology. This hypoattenuation focus is observed in all infants younger than 4 months of age and could be observed in up to the age of 6 months (Moser et al. 2008). It is related to the developmental process of the petrous apex and should not be misinterpreted as pathology. On occasion, the normal developmental process of the bony labyrinth could result in very thin bony covering of the lateral aspect of the lateral semicircular canal which can appear dehiscent on CT. This normal variant should be kept in mind, and evaluation of bony erosion from the cholesteatoma at this region should be made with caution (Curtin et al. 2011).
11.2.2 Persistent Foramen Tympanicum (Foramen of Huschke)
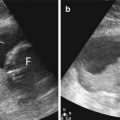
At birth, the formation of the external ear canal (EAC) is not yet complete. After the complete ring of the EAC is formed by fusion of two bony prominences of the U-shaped tympanic bone at 1 year of age, the foramen tympanicum is formed medial to the bony fusion and inferior to the EAC (Lacout et al. 2005; Prowse et al. 2011). Normally, the foramen tympanicum becomes smaller and involutes by 5 years of age. Persistent foramen tympanicum after the age of 5 years is considered to be normal variation and has been found in about 4.6–7.2 % of subjects (Lacout et al. 2005; Wang et al. 1991).
On CT, the persistent foramen tympanicum appears as a unilateral defect or bilateral bony defects at the anteroinferior wall of the medial aspect of EAC (Fig. 11.2). Since the location of the foramen tympanicum is closely associated with the temporomandibular joint (TMJ), the TMJ soft tissue may herniate into the foramen and produce TMJ pain. CT and magnetic resonance imaging (MRI) can demonstrate the soft tissue herniation and confirm the diagnosis (Lacout et al. 2005). This bony gap is also prone to injury of the EAC during TMJ arthroscopy (Applebaum et al. 1988). The bony defect in the typical location of persistent foramen tympanicum should not be misinterpreted as bony fracture or bony destruction, especially in the patients without history of trauma or no associated tumor at the region of the foramen tympanicum.
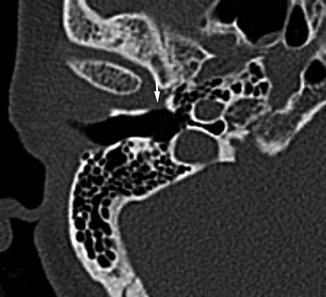
Fig. 11.2
Persistent foramen tympanicum in a 56-year-old patient. Axial CT image shows a bony defect at the anteroinferior wall of the medial aspect of the right external ear canal (arrow) which is the typical location of the foramen tympanicum
11.2.3 Asymmetric and High-Riding Jugular Bulbs
Asymmetry of the jugular bulbs is common, sometimes being high riding on the larger side. The turbulent flow or slow flow in the high-riding or large jugular bulb may produce internal signal intensity on the spin-echo MRI instead of flow void and have intense enhancement on contrast-enhanced MRI, mimicking tumor (Fig. 11.3). CT can demonstrate that the jugular plate is intact. Using flow-sensitive techniques on MRI or MR angiography can show that the jugular bulb has no pathology (Caldemeyer et al. 1997). On the other hand, the high-riding or large jugular bulb may have flow void within it on the spin-echo MRI and contrast-enhanced studies due to high flow. In this instance, the signal intensity within the jugular bulb may be equal to the adjacent bone‑, being misinterpreted as absent or hypoplastic rather than being enlarged.
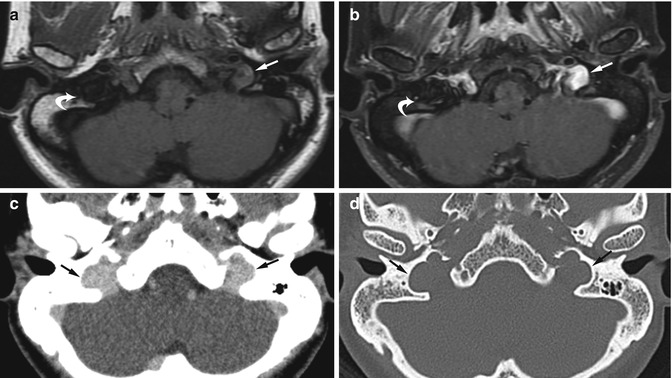
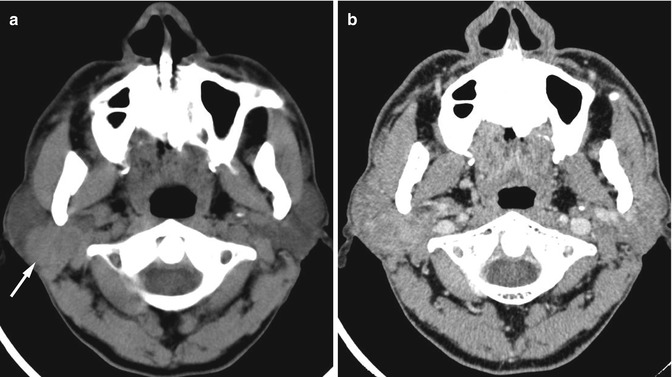
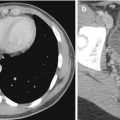
Fig. 11.3
Large bilateral jugular bulbs in a patient with left pulsatile tinnitus. Axial (a) T1-W and (b) contrast-enhanced fat-suppressed T1-W MR images show slight hyperintense signal in the left jugular bulb from slow flow with intense enhancement raising concern for a highly vascular mass at the jugular bulb (arrow). The right jugular bulb has flow void signal similar to the adjacent bone on both non-contrast- and contrast-enhanced images (curved arrow) and was thought to be hypoplastic. (c) Contrast-enhanced and (d) bone window CT images show enlarged bilateral jugular bulbs with homogeneous enhancement (arrows), with no evidence of tumor in the left jugular bulb. The jugular plates are intact on the bone window setting (arrows)
11.2.4 Intralabyrinthine Schwannoma
A schwannoma arising primarily in the membranous labyrinth is rare. It can arise within the cochlea, vestibule, or semicircular canals, according to the nerve origin within these structures which are intralabyrinthine branches of the vestibulocochlear nerve. The cochlea is the most common location for the intralabyrinthine schwannoma. CT has limited ability to detect the intralabyrinthine schwannoma since the tumor is usually small and limited to the bony labyrinth at detection. However, widening of the basal cochlear turn and erosion of the cochlear promontory may be found on CT (Mafee et al. 1990). On MRI, the tumor may be confused with the labyrinthitis ossificans. On T1-weighted MR images, the tumor may be slightly hyperintense compared to the intralabyrinthine lymphatic fluid. On T2-weighted MR images, the high signal intensity fluid in the membranous labyrinth is replaced by the hypointense tumor and shows strong contrast enhancement which has sharp borders and contrast enhancement limited to a small focus or just part of the cochlea, vestibule, or semicircular canal (Fig. 11.4a). A longer segment of enhancing tumor conformed within the intralabyrinth may be confused with the enhancement in the labyrinthitis ossificans. In the labyrinthitis ossificans, the enhancement is typically faint (Swartz and Hagiwara 2011), has less well-defined margins, and is more diffuse in all or larger parts of the cochlea, vestibule, and semicircular canals (Fig. 11.4b). The degree of contrast enhancement is decreased or disappears on the follow-up study in the labyrinthitis ossificans, but the contrast enhancement persists on follow-up in intralabyrinthine schwannoma or is even more extensive if the tumor becomes larger (Tieleman et al. 2008).
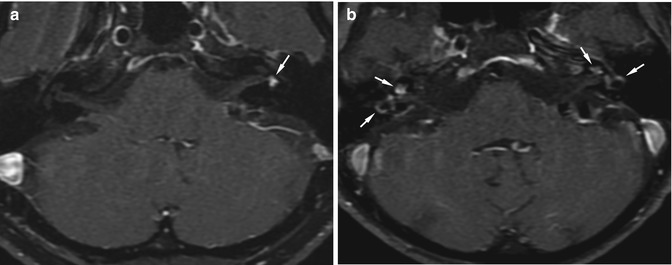
Fig. 11.4
Intralabyrinthine schwannoma versus labyrinthitis ossificans. (a) Axial contrast-enhanced fat-suppressed T1-W MR image shows a small, sharply marginated, intense enhancing mass in the left vestibule (arrow). Biopsy showed intralabyrinthine schwannoma. (b) Axial contrast-enhanced fat-suppressed T1-W MR image in a patient with labyrinthitis ossificans shows diffuse enhancement in the cochlea and semicircular canals on both sides (arrows). The enhancement is not strong as that of schwannoma and has ill-defined margins
11.2.5 Incomplete Skull Base Ossification
At birth, some parts of the skull base and the nasal septum are not completely ossified and still be cartilaginous, such as the cribriform plate and the nasal septum. These structures continue to ossify as the patients get older. The ossification process of the cribriform plate starts at age 2–8 months. Naidich et al. (2011) found that 14 % of the patients aged less than 1 year have no midline anterior cranial fossa ossification on the CT and may simulate a skull defect (Fig. 11.5). Black et al. (1998) reported two cases of neonates with choanal atresia that had fluid accumulation in the nasal cavity abutting the cartilaginous anterior cranial fossa, resembling masses in the nasal cavity that extended from intracranium through the skull base defect. The patients were misdiagnosed as having nasal cephaloceles. Radiologists should know about this potential pitfall and not overinterpret the area of incomplete ossification as a bony defect, especially in the patients who are younger than 1 year. In questionable cases, MRI is helpful in demonstration of continuation of the soft tissue mass from the intracranium into the nasal cavity in the case of cephalocele.
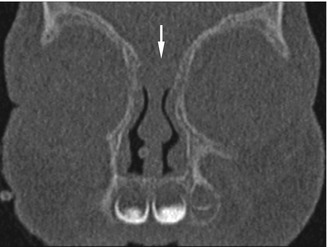
Fig. 11.5
Incomplete skull base ossification. Coronal CT image in a 2-month-old patient shows incomplete skull base ossification at the cribriform plate, resembling a skull base defect (arrow)
11.3 Paranasal Sinuses
11.3.1 Importance of Window Setting on CT
When evaluating CT images of the paranasal sinuses, both bone window settings and soft tissue window settings should be evaluated. The bone window setting provides more accurate bony wall evaluation and better demonstrates mild mucosal thickening or small soft tissue masses that may not be seen on the soft tissue window setting. The nasal septum may appear perforated on the soft tissue window setting but is actually intact on the bone window setting (Fig. 11.6). Some parts of the sinus wall or bony canal related to the sinus may appear dehiscent on the soft tissue window setting but is still intact on the bone window setting (Fig. 11.7). In addition, the bony sinus wall may appear thickened on the soft tissue window and be interpreted as wall sclerosis, suggestive of chronic sinusitis, while appearing normal on the bone window setting. The soft tissue window setting is also useful and should not be ignored in the case of sinusitis. Small calcific densities in fungal sinusitis are better seen on the soft tissue window setting and may be overlooked on the bone window setting (Fig. 11.8). Tumors may be incidentally found within the opacified sinus in the patients with sinusitis and can be observed only on the soft tissue window setting. The soft tissue outside the paranasal sinuses is often being ignored when radiologists read the CT images looking for sinusitis, and sometimes, the pathology outside the paranasal sinuses may be missed (Fig. 11.9).
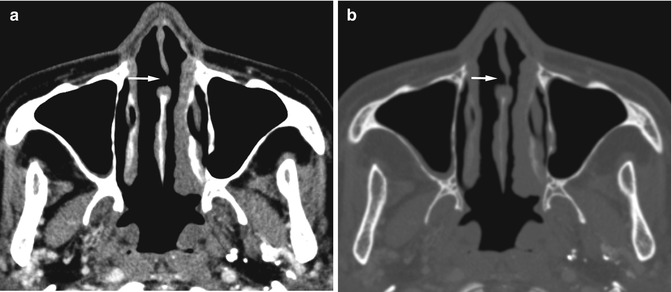
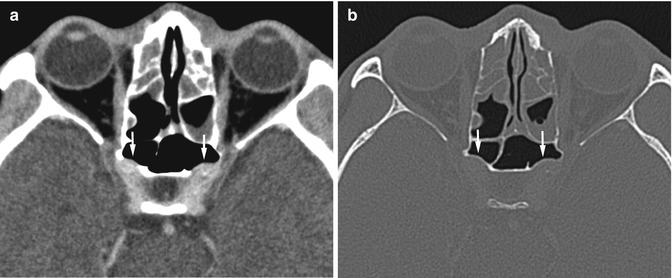
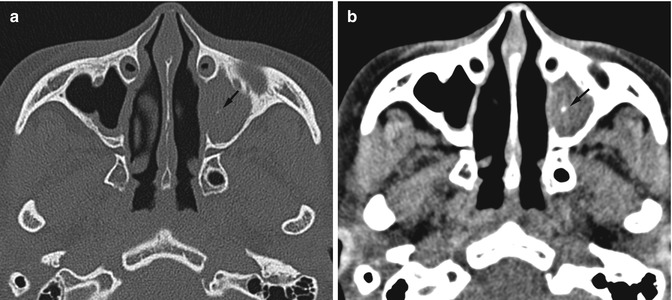
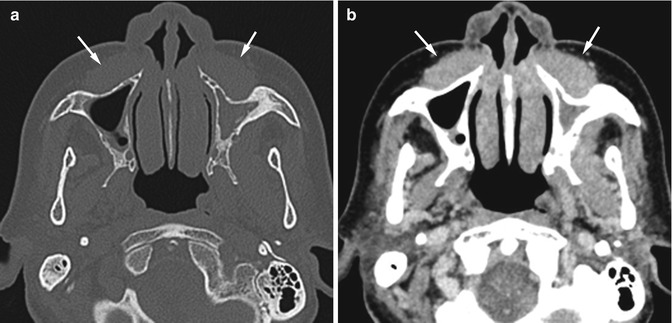
Fig. 11.6
Pseudoperforation of the nasal septum on axial CT. (a) An apparent nasal septal defect is observed on the soft tissue window setting (arrow). (b) Bone window setting shows thin soft tissue in the area observed in (a), and no perforation is seen (arrow)
Fig. 11.7
Pseudodehiscent carotid canal on axial CT. (a) Soft tissue window setting shows apparent loss of bony canal covering the internal carotid artery on both sides (arrows). (b) Bone window setting shows that the carotid canals are intact (arrows)
Fig. 11.8
Fungal sinusitis on axial CT. (a) Bone window setting shows soft tissue density opacification in the left maxillary sinus with a subtle calcific density (arrow). (b) Soft tissue window setting shows an obvious small calcific density in the maxillary sinus (arrow). A fungal ball was found at surgery
Fig. 11.9
Missed lymphoma. Patient presented with facial fullness and underwent CT for evaluating sinus disease. Inflammatory change in the sinuses was found on the first CT. The thick soft tissue anterior to bilateral maxillary sinuses (arrows) was not well seen on the (a) bone window setting but was apparently present on the (b) soft tissue window setting. However, the soft tissue mass was overlooked on the first and the second sinus CTs which were read by two different radiologists. The mass was discovered by the third radiologist who read the follow-up CT scan 1 year 5 months later when the patient had obvious facial swelling. The mass had increased in size on the third CT. Biopsy showed non-Hodgkin lymphoma
11.3.2 Sinusitis
In the setting of sinusitis, the inflammatory process induces resorption of calcium from the sinus wall. This may result in disappearance of the sinus wall on radiographs, and radiologists may interpret the radiographic image as having “aplasia of sinus” instead of having “sinusitis” (Fig. 11.10). Comparison with the old radiographic or CT images can help in detection of wall resorption in such cases. In fungal sinusitis, the fungal material and the desiccated secretion may totally fill the sinus and cause signal loss on MRI (Michel 2004), hence leading to possible interpretation as aerated sinus. This may result in inadequate treatment. To avoid this pitfall, one should always correlate the findings with CT, if available. On occasion, the invasive fungal sinusitis may produce only subtle changes of the sinus but obvious involvement of the adjacent structures (Aribandi et al. 2007). The aggressive mass-like appearance located out of the confines of the sinus may be interpreted as malignant tumor, and radiologists may not be aware of the primary sinus disease (Fig. 11.11). The appearance of a hyperattenuating mass on non-enhanced CT or low signal intensities on T1-weighted and T2-weighted MR images located adjacent to the sinuses should raise the possibility of fungal infection.
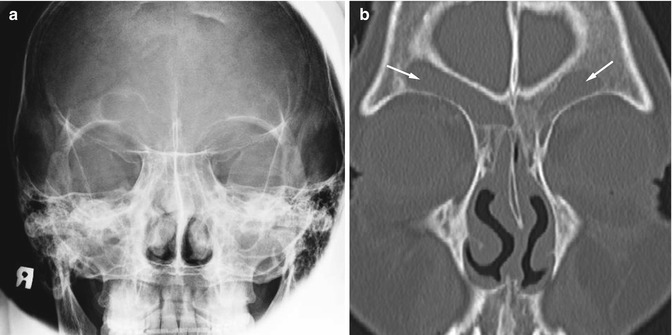
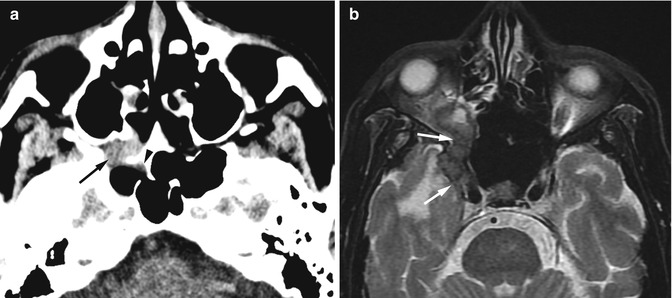
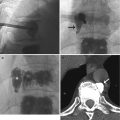
Fig. 11.10
Sinusitis with sinus wall resorption. (a) Caldwell view radiograph shows absence of the left frontal sinus mimicking frontal sinus aplasia. (b) Coronal CT image shows presence of the left frontal sinus with sinus opacification on both sides (arrows). The left bony sinus wall is ill defined due to calcium resorption
Fig. 11.11
Invasive fungal sinusitis mimicking tumor in a patient with right visual loss for 1 month. (a) Non-enhanced CT image shows a high-attenuation mass in the right pterygopalatine fossa causing destruction of the sphenoid sinus wall (arrow) with mild mucosal thickening in the right sphenoid sinus (arrowhead). (b) Axial T2-W MR image shows a hypointense mass infiltrating into the right orbital apex and right cavernous sinus (arrows) which was interpreted as malignancy. The pathologic diagnosis was aspergillosis
11.3.3 Mucocele Mimic
An odontogenic cyst arising from the maxillary tooth can project into the maxillary sinus. Part of the tooth is usually observed within the cyst. If small, a thin bony rim can be observed around the cyst within the sinus, and making a diagnosis is not difficult. If large, the cyst may expand the maxillary sinus and may erode the sinus wall. If the tooth is not obviously seen within the cyst, the diagnosis of mucocele may be made. Carefully searching for the thin bony cystic wall surrounded by the bony sinus wall, creating the “double-wall” sign (Som and Brandwein 2011), as well as looking for the part of the tooth that is associated with the cyst can help avoid a misdiagnosis (Fig. 11.12).
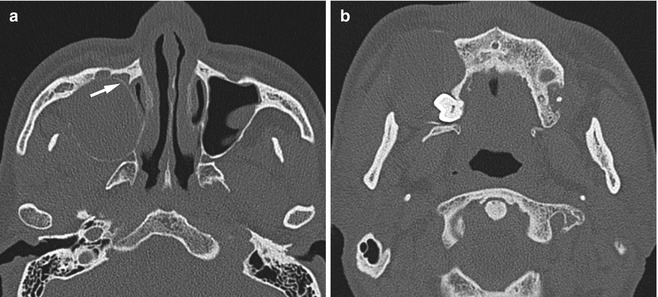
Fig. 11.12
Odontogenic cyst mimicking mucocele. Axial CT done at another hospital was interpreted as a maxillary sinus mucocele due to expansion of the sinus. (a) Thin double-wall appearance is observed at the medial aspect of the right maxillary sinus (arrow) on reviewing the CT image. (b) The lower part of the cyst shows the crown of an unerupted third molar tooth projecting into the cyst cavity, confirming its odontogenic origin
11.3.4 Tumors and Mimics
On occasion, a long-standing sinonasal polyp that has less water content may have high attenuation on CT, mimicking a tumor. Tumors such as inverted papilloma may have a polypoid component projecting through the posterior choana into the nasopharynx with little evidence of aggressiveness, giving the appearance of an antrochoanal polyp (Fig. 11.13a). Careful evaluation of the soft tissue window setting on CT may help, if the polypoid mass has the high attenuation of soft tissue density or enhancement on post-contrast study. However, some inverted papilloma may have rather low density or less contrast enhancement or occurs with polyps, and differentiation may then be difficult (Fig. 11.13b). MRI of the sinus is helpful in such problematic cases.
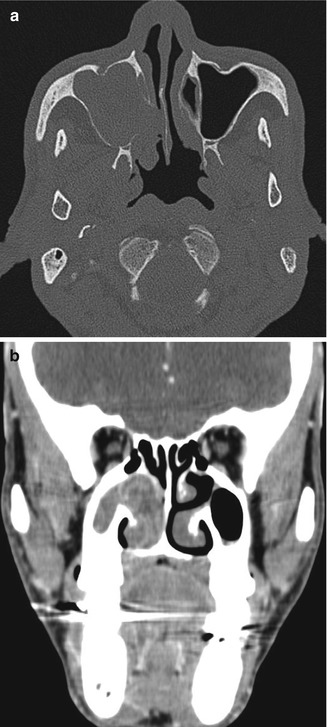
Fig. 11.13
Inverted papilloma mimicking antrochoanal polyp. (a) Axial CT image shows a polypoid mass filling the right maxillary antrum and projecting through the widened infundibulum into the posterior choana, giving the appearance of an antrochoanal polyp. Biopsy showed an inverted papilloma. (b) Coronal contrast-enhanced CT image of another patient shows a low-density polypoid soft tissue with peripheral, curvilinear enhancement in the right maxillary sinus and nasal cavity. The diagnosis of an antrochoanal polyp was made based on CT findings. Biopsy showed an inverted papilloma
An organized hematoma of the maxillary sinus may have appearances on that mimic aggressive tumors clinically and on imaging. However, the process is benign and does not need aggressive treatment or extensive surgery. In the paranasal sinuses, organized hematoma has been reported to occur only in the maxillary sinus (Lee et al. 2007). The patients usually present with recurrent epistaxis and/or nasal obstruction. The organized hematoma appears as a soft tissue mass that usually expands the sinus cavity and causes sinus wall erosion, and the mass may extend into the nasal cavity. The appearance on non-enhanced CT is a heterogeneous mass that has higher attenuation than muscle (Lee et al. 2007). Internal calcifications may be present. Heterogeneous nodular enhancement is observed on contrast-enhanced CT (Fig. 11.14). The mass has a hypointense rim with internal heterogeneous signal on T2-weighted MRI and irregular nodular enhancement that is quite characteristic (Kim et al. 2008).
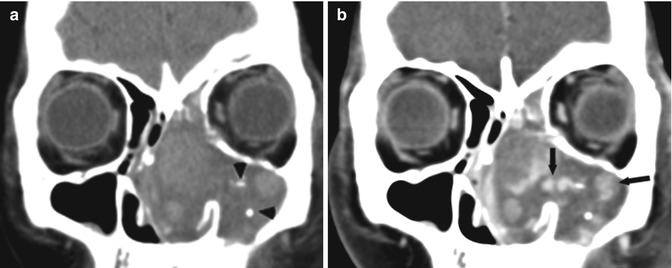
Fig. 11.14
Organized hematoma mimicking malignant tumor. (a) Coronal unenhanced CT image shows a heterogeneous mass with internal calcifications (arrowheads) in the left maxillary sinus and left nasal cavity causing nasal cavity expansion. (b) Coronal contrast-enhanced CT image shows heterogeneous nodular enhancement within the mass (arrows) which is characteristic for this condition
11.3.5 Postoperative Change
After a Caldwell-Luc procedure, there are typical changes in the maxillary sinus which should not be confused with residual inflammatory disease. This procedure is used in patients with sinusitis or tumor which requires removal of the sinus mucosa. Puncture of the lower anterior maxillary wall is done to access the antrum, and then a defect at the medial wall of the maxillary sinus is created to connect the maxillary cavity to the inferior meatus. As a result of periosteal injury from mucosal stripping, the bony wall become thickened and contracted, and the sinus cavity is filled with soft tissue from fibrosis. On CT, the bony wall thickening may be sclerotic or have normal bone density (Fig. 11.15). Lobulation of the inner wall of sinus can be seen. Depression of the anterior wall with bony defects is present. The maxillary antrum may be partially or totally opacified with fibrotic soft tissue (Kim et al. 2002). With these typical appearances in asymptomatic patients who had undergone Caldwell-Luc surgery, radiologists should not misinterpret the opacified sinus with a thickened bony wall as being due to chronic sinusitis.
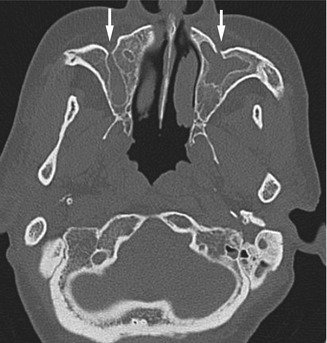
Fig. 11.15
Post-Caldwell-Luc surgery change. Axial CT image shows defects at the anterior wall of the lower maxillary sinus on both sides (arrows). The sinus walls are thickened and contracted. There is soft tissue opacification of the sinus from fibrosis. This is the typical appearance of post-Caldwell-Luc surgery change and should not be confused with chronic sinusitis
11.4 Salivary Glands
11.4.1 Accessory Parotid Tissue
An accessory parotid tissue overlying the masseter muscle is commonly found and should not be misinterpreted as being a tumor. It lies above and adjacent to the Stensen duct. Its excretory duct drains directly into the Stensen duct. The accessory parotid tissue has similar CT attenuation and MRI signal intensity to the major parotid gland (Fig. 11.16). The diseases that occur in the major parotid gland can also arise in the accessory tissue.
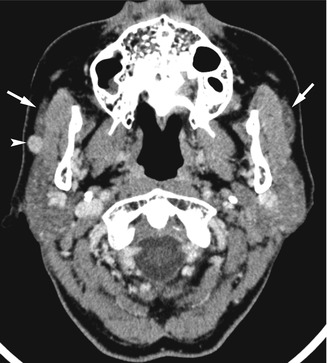
Fig. 11.16
Tumor arising in accessory parotid tissue. Axial contrast-enhanced CT image shows bilateral accessory parotid tissue superficial to the masseter muscles (arrows). A small enhancing mass arises from the right accessory parotid tissue (arrowhead). The differential diagnosis of this lesion should be the same as in the major parotid gland
11.4.2 Stensen Duct Mimic
The Stensen duct or the main parotid duct appears on CT or MRI as a small tubular-shaped soft tissue leaving the parotid gland at its anterior aspect, courses over the masseter muscle, and pierces the buccal fat pad before ending in the buccal space opposite to the second upper molar tooth. The entire course of the Stensen duct can be well demonstrated on axial images and should not be confused with the zygomaticus major muscle (Fig. 11.17). The zygomaticus major muscle is a muscle of facial expression attaching from the zygomatic arch to the angle of the mouth. The zygomaticus major muscle may appear as a thin linear soft tissue that may be mistaken for the Stensen duct on cross-sectional imaging. However, the zygomaticus muscle is located more anteriorly and has a different attachment from the Stensen duct.
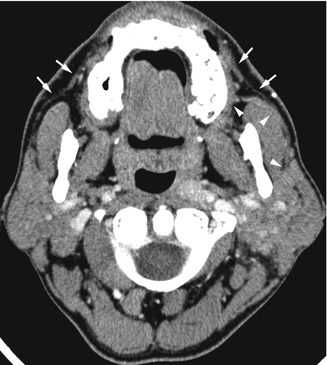
Fig. 11.17
Stensen duct and zygomaticus major muscle. Axial contrast-enhanced CT image shows the course of the left Stensen duct arising from the anterior aspect of the left parotid gland and opening into the buccal mucosa opposite to the second upper molar tooth (arrowheads). The zygomaticus major muscle has the same curvilinear appearance on the axial image, but the course is more anterior (arrows). The muscle attaches from the zygomatic arch to the buccal space
11.4.3 Submandibular Gland Swelling: Pseudofractures
The submandibular gland has a connective tissue capsule with internal septa between each lobe and lobules. The normal internal septa within the gland are not routinely observed on imaging. With pathologic change causing glandular swelling, such as in the acute sialadenitis, internal septa may be thickened and can be observed on imaging (Park et al. 2005). Each lobe of the gland may appear separated between the thick low-density septa, mimicking fracture lines; and if the clinical history was not available or equivocal, the swollen gland may be suspicious for fracture (Fig. 11.18). A true fracture of the submandibular gland is very rare and usually is accompanied by a mandibular fracture. A laceration through the gland parenchyma resulting in branching low density within the gland can be observed on CT (Tonerini 2002). With a history of trauma, the diagnosis of fracture can be made with confidence.
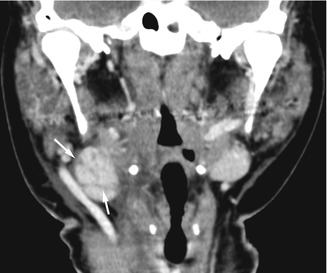
Fig. 11.18
Pseudofracture of submandibular gland. Coronal contrast-enhanced CT image of a patient with mump sialadenitis shows thickening of the internal septa within the right submandibular gland mimicking fracture lines (arrows)
11.4.4 Salivary Gland Tumors
Pleomorphic adenoma is the most common benign tumor of the salivary gland. The typical imaging appearance is a smoothly marginated solid mass that tends to have a lobulated contour, when large enough. Some cystic areas may be observed within the solid component, representing old hemorrhage, necrosis, or mucoid material. The tumor may be difficult to observe on routine contrast-enhanced CT but is better defined on the delayed contrast-enhanced CT due to increased degree of enhancement (Lev et al. 1998). However, pleomorphic adenoma can be well demonstrated on MRI and has the typical appearances of a benign tumor. On occasion, pleomorphic adenoma may have a predominant cystic component, and the radiologist may prefer the diagnosis of Warthin tumor rather than pleomorphic adenoma. The solid component in the pleomorphic adenoma may be tiny, and the tumor may appear totally cystic on imaging, mimicking a salivary cyst (Nishimura et al. 1994) (Fig. 11.19).
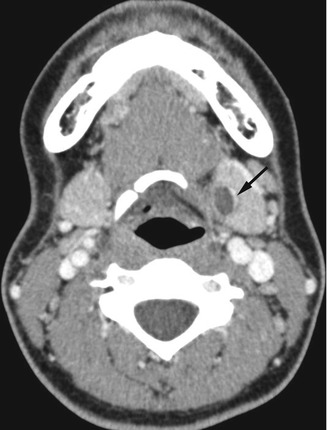
Fig. 11.19
Pleomorphic adenoma mimicking salivary cyst. Axial contrast-enhanced CT image shows a cystic mass in the left submandibular gland (arrow) which was diagnosed as a salivary cyst based on CT appearance. The pathologic examination showed cystic pleomorphic adenoma
Many pleomorphic adenomas and other tumors in the major salivary glands may have equal density to the surrounding gland parenchyma on the routine contrast-enhanced CT and are missed (Kei and Tan 2009). The problem is less likely to occur in the patients with fatty change of the parotid gland because the soft tissue density of the tumor is contrasted to the surrounding fat density. Performing non-enhanced CT or delayed contrast-enhanced CT can help in identifying the tumor (Fig. 11.20). Using ultrasound imaging or MRI is another alternative to demonstrate the salivary gland mass in questionable cases. However, oncocytoma arising in the parotid gland has been reported to be characteristically isointense to the surrounding parenchyma or vanish on fat-suppressed T2-weighted and contrast-enhanced fat-suppressed T1-weighted MR images (Patel et al. 2011). Fortunately, the tumor appears well delineated on T1-weighted MR imaging and does not cause problem in detection.