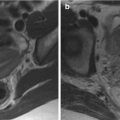
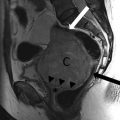
Fig. 8.1
(a–f) Normal prostate anatomy depicted with T2-weighted MR images; in coronal plane (TR: 2300; TE: 116) (a); in axial plane (TR: 5130; TE: 108) at the level of the seminal vesicles (b), the mid-gland of the prostate (c) and the apex, and membranous urethra (d); in sagittal plane (TR: 3600; TE: 114), medially (e) and laterally (f). The letters (a–f) correspond to b urinary bladder, c central zone, fs anterior fibromuscular stroma, p peripheral zone, r rectum, s symphysis pubis, sv seminal vesicles, u urethra
The peripheral zone envelops the posterior, lateral, and apical portions of the prostate and shows high signal intensity on T2-weighted MR images, constituting 70 % of the glandular tissue. The central zone is located superiorly, just posterior to the proximal urethra, and constitutes 25 % of the glandular tissue. Just anterior and lateral to the proximal urethra is the transition zone, which constitutes 5 % of the glandular tissue. The urethra and periurethral glandular tissue represents less than 1 % of the glandular prostate and are located anteriorly in the prostate gland and are best seen in the inferior region (i.e., the apex) of the prostate. On MR images, the central and transition zones have similar signal intensities and are best differentiated by their respective anatomic locations; however, the transitional zone is often inseparable from the central zone due to benign prostatic hypertrophy (BPH), the incidence of which increases with age; the two zones together are referred to as the central gland. The signal intensities in the central and transition zones are lower than those in the peripheral zone on T2-weighted images; often heterogeneous, with a mixture of hyperintense glandular tissue and hypointense hypertrophic fibrotic nodules; and show less contrast enhancement [37–39]. The zones are not only defined histologically; many prostatic diseases have a zonal distribution: benign prostatic hyperplasia usually involves the transition zone, whereas prostate cancer arises in glandular tissue.
The junction of the transition and peripheral zones is marked by a visible linear boundary, which is often referred to as the prostate pseudocapsule or surgical capsule.
The true prostate capsule is an outer band of fibromuscular adherent tissue and appears as a thin layer of low-signal-intensity tissue surrounding the prostate on T2-weighted images. The capsule is most apparent posteriorly and posterolaterally because it contrasts with the higher, more uniform signal intensity of the peripheral zone of the gland. This capsule is an important landmark in the assessment of extraprostatic extension (EPE) of the tumor.
The seminal vesicles (Fig. 8.1) are located posterosuperiorly to the prostate and secrete seminal fluid into the bilateral ductus deferentes, which become the ejaculatory ducts. These ducts traverse the prostate and join the urethra at the verumontanum. A seminal vesicle filled with seminal fluid is typically T2 hyperintense.
Low-signal-intensity foci posterolateral to the capsule are indicative of neurovascular bundles, which course posterolateral to the prostate capsule bilaterally at the 5- and 7-o’clock positions. At the apex and base, the neurovascular bundles send penetrating branches through the capsule, providing a route for EPE.
In the most anterior part of the prostate, there is a region of nonglandular tissue known as the anterior fibromuscular stroma, which has low signal intensity on T2-weighted images.
The proximal urethra is rarely identifiable unless a Foley catheter is present or a transurethral resection has been performed. The distal prostatic urethra can be seen as a low-signal-intensity ring in the lower prostate. The genitourinary diaphragm is clearly definable on MR images. It consists of two layers of fascia enclosing deep transverse perineal muscle and the external sphincter of the urethra [40]. On MR images, the genitourinary diaphragm is seen as a flat plate of fibromuscular tissue suspended between the inferior pubic rami just below the symphysis pubis. The prostate is separated from the rectum posteriorly by the Denonvilliers fascia, which attaches to the peritoneal lining above and the genitourinary diaphragm below. This fascia restricts posterior extension of prostatic carcinoma into the rectum.
8.4 MR Imaging
As previously described, prostate cancer is most common in the peripheral zone (70 % of cases), followed by the transitional zone (25 %) and central zone (5 %) [41].
On T1-weighted MR images, the normal prostate gland demonstrates homogeneous intermediate-to-low signal intensity. As with computed tomography (CT), T1-weighted MR imaging has insufficient soft tissue contrast resolution for visualizing the intraprostatic anatomy or abnormality. Instead, the zonal anatomy of the prostate gland is best depicted on high-resolution T2-weighted images, of which the main application is precisely in local staging of prostate cancer. On T2-weighted images, prostate cancer usually demonstrates low signal intensity in contrast to the high signal intensity of the normal peripheral zone (Figs. 8.2 and 8.3). Low signal intensity in the peripheral zone, however, is not specific for cancer. It can also be seen in several benign conditions, such as hemorrhage, prostatitis, hyperplastic nodules, or posttreatment sequelae (e.g., as a result of irradiation or hormonal treatment). Furthermore, similar modifications can be formed as postbiopsy changes, as a result of hemorrhage: in general, MR imaging is performed at least 6 weeks after prostate biopsy to allow any hemorrhage to resolve (Figs. 8.4 and 8.5). Localization of a tumor in the central gland can be challenging because of the inhomogeneous nature of a benign central gland (Figs. 8.6 and 8.7). Important signs of a central gland tumor include homogeneous T2 hypointensity, disruption of the low-signal-intensity rim of a BPH nodule, and mass effect [42].
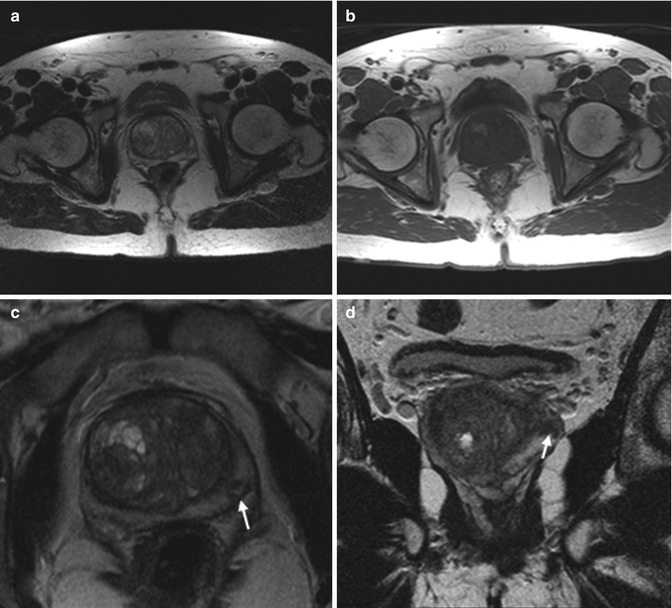
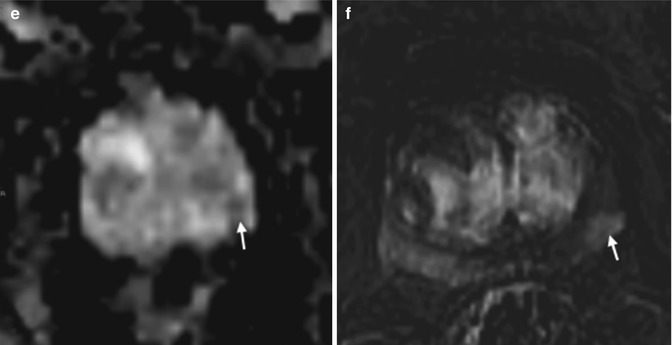
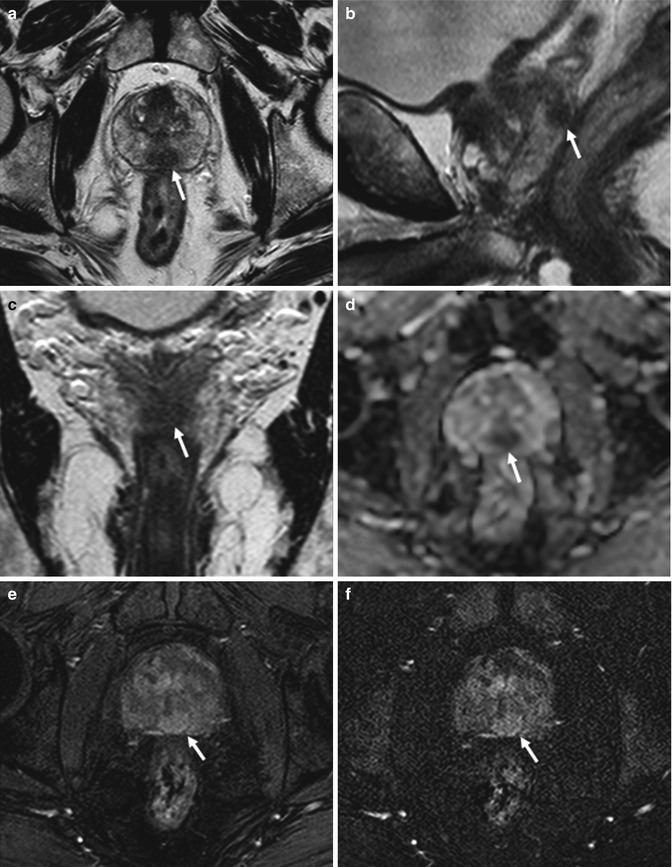
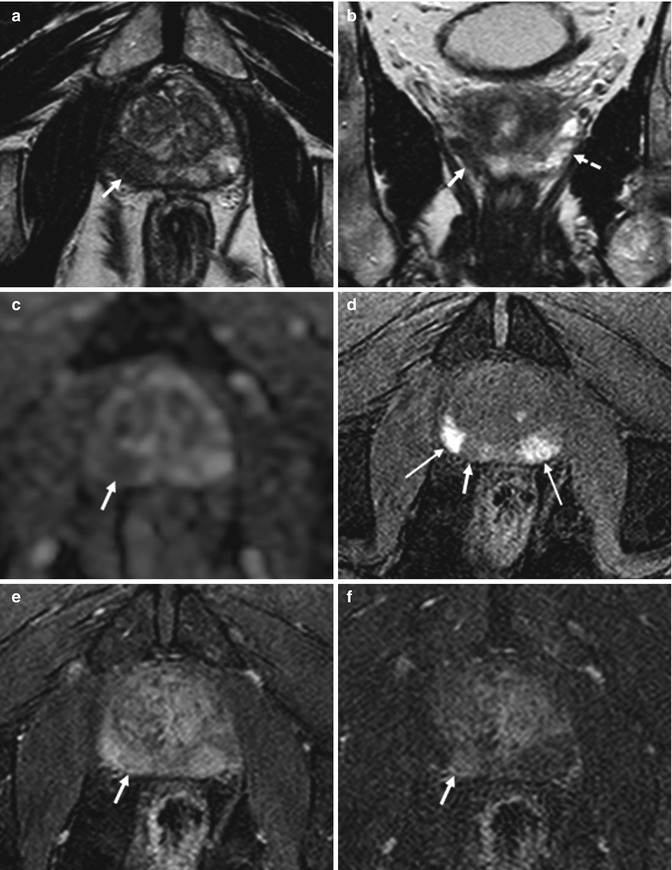
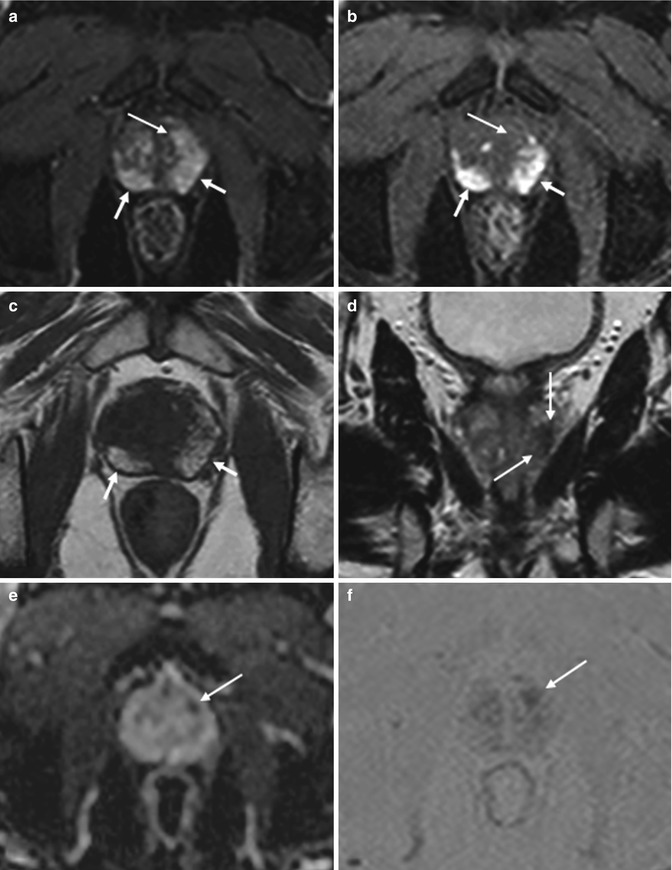
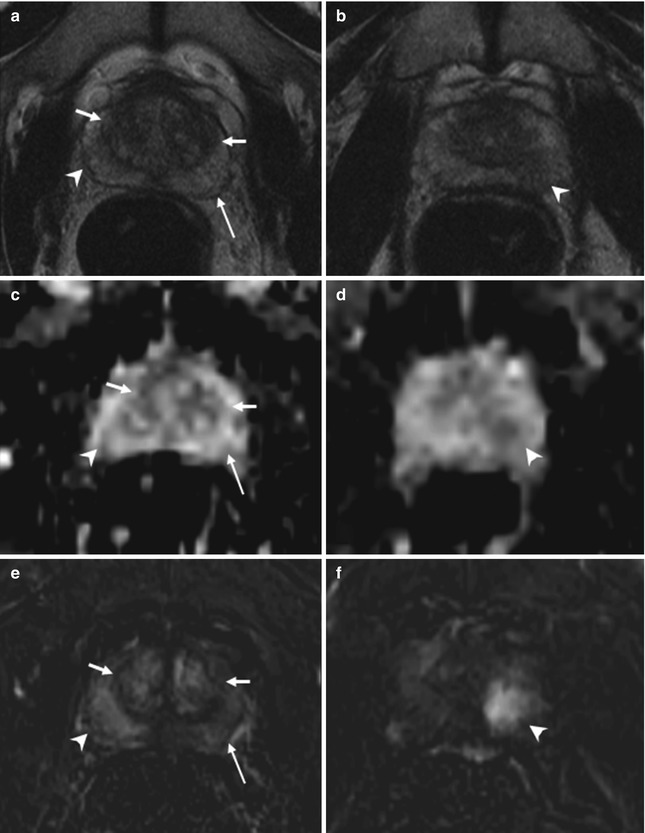
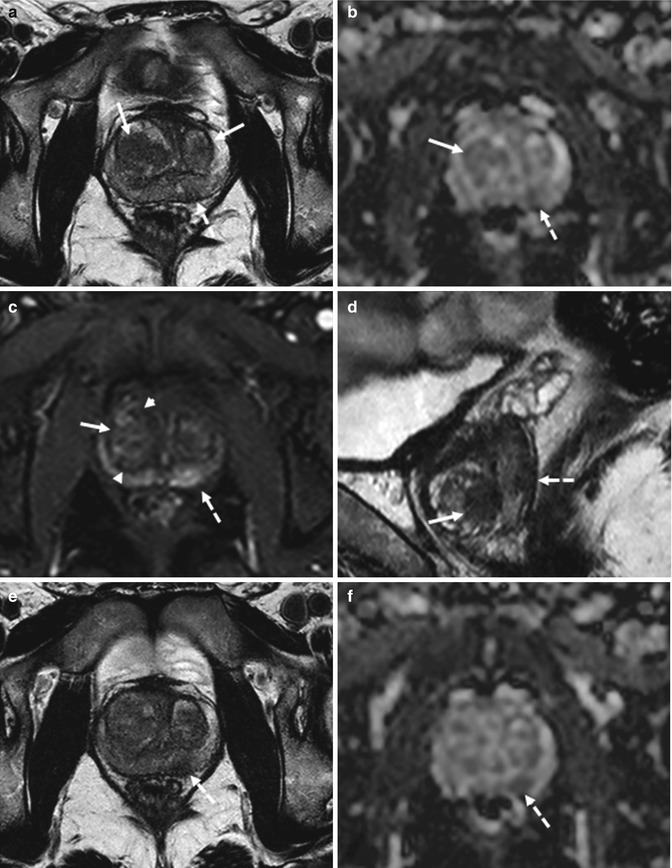
Fig. 8.2
(a–f) 59 years old, PSA 6.7 ng/ml, Gleason 7 (3 + 4). On axial T2-weighted (TR: 5130; TE: 108) (a) and T1-weighted (TR: 550; TE: 9.3) (b) sequences, the central zone of the prostate appears increased in volume, with inhomogeneous appearance, due to adenomatous hyperplasia (estimated volume of 53 ml, weight of all surgical specimen is 64 g). Axial T2-weighted (TR: 3600; TE: 116) sequence acquired with a narrower fov (Field Of View) and thinner layer for study of the prostate (c), at a lower level than in a, and a coronal T2-weighted (TR: 2300; TE: 116) sequence (d) allowed to document the presence of a small (diameter 6 mm) nodule (arrows), hypointense, in the periphery of the left lobe. On the ADC sequence (e), the nodule (arrows) appears hypointense while on the post-contrastographic phase sequence (f) appears hypervascularized (arrows). This lesion did not cause breaks in the prostatic capsule; no infiltration of the vascular nervous bundle and seminal vesicles is documented. No nodule in the right lobe. Pathologic analysis of the surgical specimen yielded neoplasm occupying 5 % of the prostate volume, with extension to both lobes, more to the left
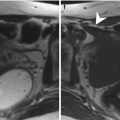
Fig. 8.3
(a–f) 74 years old, PSA 8.2 ng/ml, Gleason 9 (4 + 5). Axial (TR: 4074; TE: 100) (a), sagittal (TR: 4006; TE: 100) (b), and coronal (TR: 4013; TE: 100) (c) T2-weighted sequences show a hypointense nodule (arrows), with major axis of 18 mm, at the middle third, posteriorly and medially, involving both lobes. On ADC sequence (d), the nodule (arrow) appears hypointense, while on post-contrastographic phase (e) and subtractive perfusion image (f) the nodule (arrows) appears hypervascularized (not shown pre-contrastographic phase, in which the nodule is isointense). This lesion did not extend to the vascular nervous bundles and seminal vesicles, in relation to the medial position, and did not break the prostatic capsule. After prostatectomy, tumor is documented occupying both lobes, with infiltration of the prostatic capsule, but without extracapsular extension
Fig. 8.4
(a–f) 64 years old, recently underwent prostate biopsy. Axial (TR: 4074; TE: 100) (a) and coronal (TR: 4013; TE: 100) (b) T2-weighted sequences show hypointense area in the peripheral zone of the right lobe (arrows), more appreciable when compared to the physiologic hyperintensity in the left lobe (dashed arrow). On ADC sequence (c), the nodule (arrow) appears hypointense while on axial T1-weighted (TR: 8,9; TE: 4,3) sequence (d) is more hypointense than the remaining peripheral zone (long arrow) that appears diffusely hyperintense, as a consequence of recent biopsy: if a patient underwent biopsy, the MR exam should be performed at a distance of at least 2 months. On post-contrastographic phase sequence (e), eventual hypervascularized nodules are masked by diffuse hyperintensity. However, on subtractive perfusion image (f), the hypointense area on ADC and T2-weighted sequences is more easily recognizable as hypervascularized (arrow). The patient underwent prostatectomy that confirmed the presence of a tumor
Fig. 8.5
(a–f) 68 years old, PSA 5.6 ng/ml, Gleason 6 (3 + 3), recently underwent prostate biopsy. On axial post-contrastographic (TR: 8.9; TE: 4.3) sequence (a), hyperintensity is appreciable in the entire peripheral zone of the prostate (arrows), extending to both lobes, especially to the left. However, this is not due to the presence of a diffuse lesion. In fact, on pre-contrastographic phase (b), the peripheral zone appears already diffusely hyperintense (arrows); this is evident also in the corresponding (c) T1 TSE (TR: 550; TE: 10). This hyperintensity in T-1 sequences is secondary to paramagnetic phenomenon due to the presence of methemoglobin (recent biopsy). On coronal T2-weighted (TR: 4013; TE: 100) sequence (d), appreciable is a hypointense area at the middle third that corresponds on ADC sequence (e) to a hypointense area (arrows). Also on dynamic sequence (a), a hypervascularized lesion is recognizable (long arrow), not corresponding to a hyperintense area in basal image: using subtractive perfusion image (f), the lesion is more easily appreciable (long arrow)
Fig. 8.6
(a–f) 58 years old, PSA 6 ng/ml, Gleason 6 (3 + 3). (a, c, e) axial sections at the lower third. (b, d, f) axial sections at the middle third. (a, b) T2-weighted images; (c, d) ADC images; (e, f) post-contrastographic phase images. Central zone of the prostate (short arrows); peripheral zone of the prostate (long arrows); abnormal finding (arrowheads). (a, c, e) T2-weighted (TR: 3600; TE: 116) (a) and ADC (c) sequences show increased volume of the central zone of the prostate (estimated volume of 35 ml), with inhomogeneous hypointense appearance; the peripheral zone of the prostate appears homogeneous hyperintense. Both T2-weighted and ADC sequence prove no abnormal finding. On post-contrastographic phase (TR: 12; TE: 5.8) sequence (e), inhomogeneous enhancement of the central zone (normal finding); homogeneous hypovascularized enhancement of the peripheral zone (normal finding) except for a focal hypervascularized area in the right lobe (arrowhead), not confirmed on T2 and ADC: these characteristics are ascribable to inflammation. (b, d, f) the arrowheads point to a hypervascularized area (f) of 13 mm in the left lobe; however, unlike in e, this area is hypointense in T2-weighted (b) and ADC (d) sequence; therefore, in this case the lesion is a neoplastic lesion. The patient underwent prostatectomy that confirmed the diagnosis
Fig. 8.7
(a–f) 56 years old, PSA 9.2 ng/ml, Gleason 6 (3 + 3). On axial T2-weighted (TR: 4074; TE: 100) sequence (a), the transition zone appears inhomogeneous because of the presence of two large hypointense nodules (arrows). On ADC sequence (b), the right nodule is clearly recognizable, appearing hypointense (arrow), while is quite vascularized on post-contrastographic phase (c), bounded by a hypointense edge (arrowheads). The left nodule is better appreciable at a lower axial plane (not shown) and on sagittal (d) T2-weighted (TR: 4006; TE: 100) sequence (arrow). Nevertheless, although these signal features in the peripheral zone are suspected for cancer, in the central gland these are the consequences of adenomatous hyperplasia. However, a neoplastic lesion is recognizable in the peripheral zone of the left lobe, at the middle third, posteriorly (dashed arrows in a–d): on axial T2-weighted and ADC sequences (respectively in e and f), just lower than in a–c, the lesion is well visible (dashed arrows)
Sensitivity and especially specificity of T2-weighted MR imaging of prostate cancer localization vary, ranging from 54 to 91 % and 27 to 91 % [43–46]. Variation of results in these prospective studies might be partially explained by the fact that image analysis was based on different numbers of regions of interest, different cutoff points for a positive result, and inclusion or exclusion of prostate cancer localization in the transition zone. Moreover, results vary as the correlation of MR imaging findings with prostatectomy findings is difficult owing to different angles and section intervals of MR sections and prostatectomy slices and to deformation and shrinkage during histopathologic processing of the prostate specimens.
Therefore, findings on T2-weighted anatomic MR images are often nonspecific. The addition of functional MR imaging techniques to anatomic MR imaging has improved prostate tumor localization, particularly by improving the specificity [45, 47–50]. These functional MR imaging modalities include diffusion-weighted imaging, DCE imaging, and MR spectroscopy. The diagnostic accuracy of multiparametric MR imaging can vary depending on the image acquisition technique and diagnostic criteria used. In general, however, the more functional and anatomic MR imaging techniques are combined, the better the performance of MR imaging in tumor detection.
8.4.1 Diffusion-Weighted Imaging
Diffusion is Brownian motion of free water molecules at the cellular level. Diffusion-weighted imaging can add valuable information about a tissue at the cellular level to the information from conventional T1-weighted and T2-weighted imaging [51]. Because diffusion-weighted imaging measures the Brownian motion of water molecules, it provides important information about the functional environment of water in tissue and reflects the cellular status of normal and pathologic tissue. Furthermore, diffusion-weighted imaging is sensitive to changes in the microdiffusion of water within the intracellular space and extracellular space and cytotoxic edema due to alterations in the adenosine triphosphate-dependent sodium–potassium pumps. Diffusion can be quantitated in terms of the ADC on diffusion-weighted MR images. The ADC quantifies the combined effects of both diffusion and capillary perfusion. A decreased ADC is interpreted as reduced motion of water molecules or diffusion, whereas in tissue with an increased ADC there is less restriction of water molecule motion. In prostate tumors, as in other solid tumors, the motion of water molecules is restricted because of their increased cellular density, with reduction of the extracellular space and restriction of the motion of a larger portion of water molecules to the intracellular space, resulting in decreased ADC. Therefore, diffusion-weighted imaging and ADC provide powerful indicators for characterization of prostate tissue, particularly in differentiation between benign and malignant lesions [52].
To optimize the ability of diffusion-weighted imaging to allow characterization of the diffusion properties of a tissue, imaging parameters should be optimized according to the imaging unit and magnetic field strength used. Selection of the correct b value is particularly important for prostate tissue with a prolonged T2 relaxation time. The b value specifies the sensitivity of diffusion. Use of high b values increases diffusion sensitivity by diminishing the hyperintensity of tissues with long T2 relaxation times (thus avoiding T2 shine-through). In general, a high b value (>700 s/mm2 at 1.5 T and >1,000 s/mm2 at 3 T) is recommended for prostate diffusion-weighted imaging, and a postprocessed ADC map is absolutely necessary for identifying and evaluating prostate tumors both objectively and subjectively. The higher the b value, the lower the signal-to-noise ratio; thus, an incremental increase in the number of excitations is required for optimization of image quality. Although studies have shown significant differences between cancerous and normal prostatic tissue in ADC [52, 53], this should be interpreted carefully in clinical patient care due to the current technical variability and lack of consensus. The advantages of diffusion-weighted imaging are a relatively short acquisition time and high contrast resolution between tumors and normal tissue. In general, regional ADC map values differ depending on location and tissue composition. Malignant lesions have lower ADC values (about 20–40 %) than benign or normal prostatic tissue; also, there are regional variations in the normal tissue values for different zones of the prostate (Fig. 8.8). Some authors have stratified ADC values into benign and malignant and demonstrated that diffusion-weighted imaging and ADC mapping can increase the sensitivity of MR imaging in detection of prostate cancer when diffusion-weighted imaging is used in conjunction with T2-weighted imaging [45] (Fig. 8.9); in particular, the addition of DWI imaging to T2-weighted MR imaging significantly improved sensitivity to 81 % (sensitivity for T2-weighted MR imaging alone, 54 %), whereas specificity was slightly lower for T2-weighted MR imaging combined with DWI (84 %) than for T2-weighted MR imaging alone (91 %). Also, in other prospective studies [54, 55], the addition of DW imaging to T2-weighted MR imaging improved prostate cancer localization performance. However, in a recent retrospective 3-T study in 51 patients, with prostatectomy specimens as reference standard [56], DW imaging did not add value to T2-weighted MR imaging for prostate cancer localization. Preliminary results suggest that diffusion-weighted imaging has the potential to support prediction of tumor aggressiveness [57].
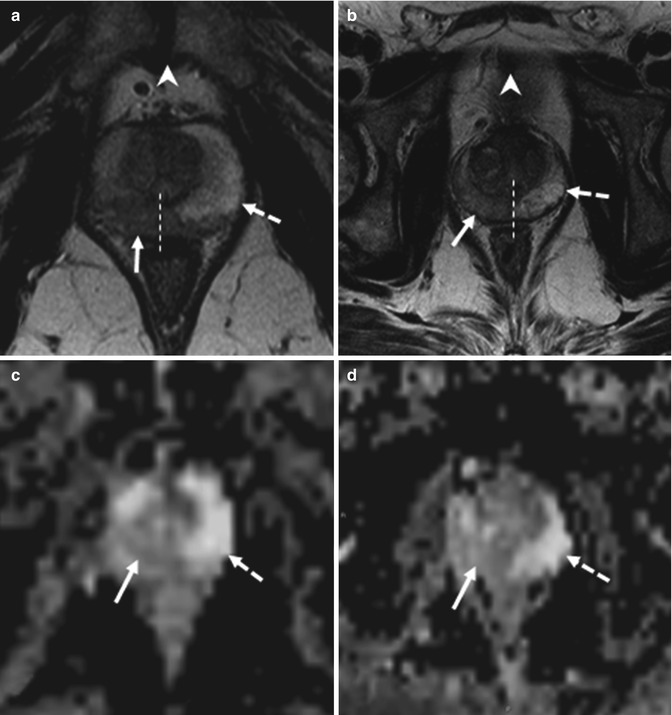
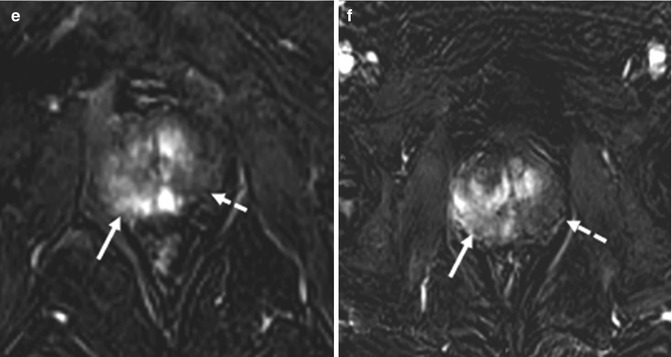
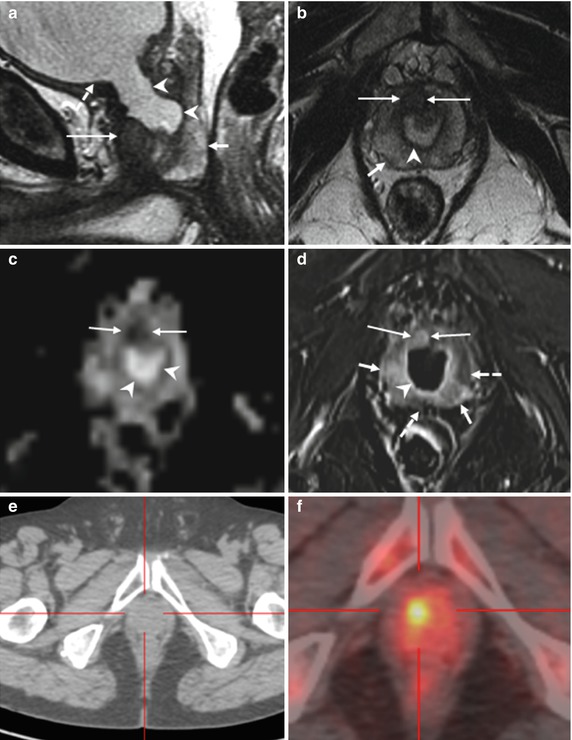
Fig. 8.8
(a–f) 58 years old, PSA 6.7 ng/ml, Gleason 7 (3 + 4). (a, c, e) axial sections at the lower third; on a, the symphysis pubis can be identified (arrowhead in a). (b, d, f) axial sections at the middle third, just above the symphysis pubis, that are not identifiable (arrowhead in b). (a, b) T2-weighted images (TR: 3600; TE: 100); (c, d) ADC images; (e, f) post-contrastographic images (TR: 12; TE: 5,8). On T2-weighted sequence at the lower third (a), a hypointense area (arrow) can be documented at the right lobe of the prostate, with extension to the left lobe (the dashed line represents the limit of the two lobe). On ADC sequence (c), the same nodule appears hypointense while on post-contrastographic sequence (e) appears hypervascularized. On all three sequences, the lesion is clearly visible and has different signal features than the contralateral healthy lobe (dashed arrows). At the middle third, an area with the same signal features but confined in the right lobe (dashed line). Patient underwent prostatectomy that confirmed a tumor occupying 50 % of the prostate volume, with extension to both lobes, more to the right, without break in the prostatic capsule or infiltration of the vascular nervous bundles and seminal vesicles
Fig. 8.9
(a–f) 68 years old, undergone TURP 3 years ago for BPH (PSA: 4–5 ng/ml; free-to-total ratio: 18 %); in the next years, the PSA values increased and free-to-total PSA ratio dropped (last values: respectively, 11–2 ng/ml; 7 %); these values are suspected for neoplastic lesion. The patient underwent prostate biopsy that revealed a prostatic cancer (Gleason 3 + 3). On sagittal T2-weighted sequence (TR: 3600; TE: 114) (a), the prostate (short arrow) appears regularly hyperintense, with the exception of a hypointense lesion anteriorly (long arrow); appreciable in this plane is a large bladder neck (arrowheads), consequence of a previous resection of the median lobe, just below the bladder (dashed arrow). Axial T2-weighted (TR: 3600; TE: 116) sequence (b) shows the hypointense lesion (long arrow), anteriorly, just to the right of the midline, while the remaining prostate is hyperintense (short arrow); within the prostate, the bladder neck is homogeneous and markedly hyperintense (arrowhead). At the same plane in b, ADC sequence (c) shows the hypointense lesion (long arrows) and the urine in the bladder neck, markedly hyperintense (arrowhead). On post-contrastographic phase (d), the lesion appears hypervascularized (long arrows) while the prostate is less vascularized (dashed arrows); however, some hypervascularized areas are recognizable (short arrows), not significantly hypointense on T2-weighted and ADC sequence, therefore to refer to inflammation. Urine is regularly markedly hypointense (arrowhead). On axial landmark CT image (e) and choline PET–CT scan (f), a hypermetabolic lesion is clearly visible. Patient underwent prostatectomy that confirmed presence of tumor occupying 50 % of the prostate volume, with extension to both lobes (Gleason 4 + 3)
The location of prostate cancer affects the sensitivity of diffusion-weighted imaging. Noncancerous peripheral zone tissue has been found to have higher average ADC (less overlap with cancerous tissue) than the transition zone and prostate base. Overlap limits the ability to differentiate prostate cancer from noncancerous tissue [58]. The high prevalence of BPH in elderly men significantly contributes to this difficulty. The stromal form of BPH in particular exhibits lower ADC and low T2 signal intensity, mimicking prostate cancer, whereas glandular BPH and prostatic intraepithelial neoplasia can be more readily distinguished because of their higher average ADC and higher T2 signal intensity [59] (Figs. 8.7 and 8.10). A higher Gleason score has repeatedly been shown to be associated with decreased ADC, likely due to the dedifferentiated infiltrative growth of these tumors, as opposed to the glandular organization of a more well-differentiated prostate cancer, which more closely resembles normal prostatic tissue [60, 61] (Fig. 8.11).
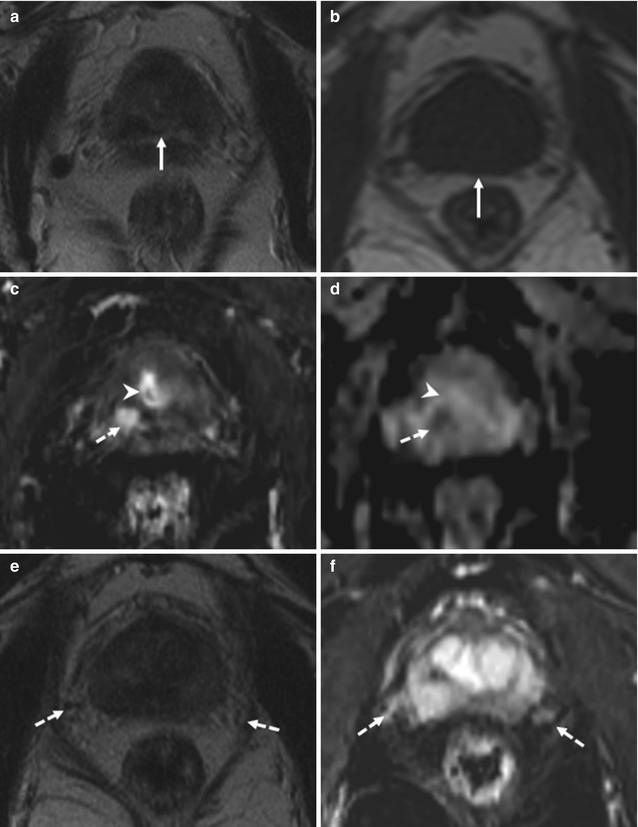
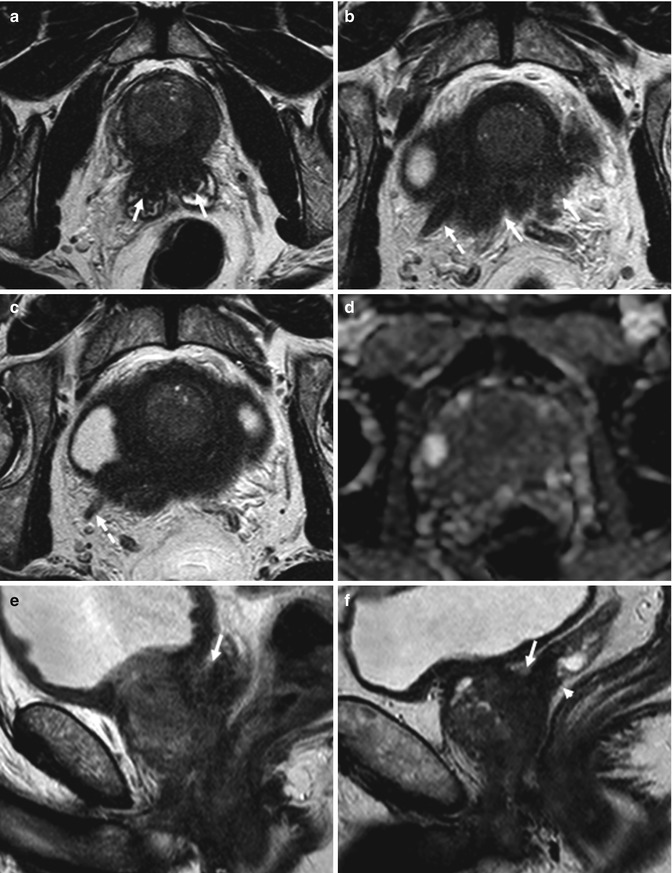
Fig. 8.10
(a–f) 72 years old, previous diagnosis of prostate cancer 8 years ago, treated with hormonotherapy and radiotherapy. Recent PSA 1.4 ng/ml. On axial T2-weighted (TR: 5130; TE: 108) (a) and T1-weighted (TR: 550; TE: 9.3) (b) sequences, the prostate (arrows) appears to have a regular volume (estimated volume of 14 ml, surgical specimen weight 27 g), inhomogeneous, and diffusely hypointense on T2-weighted sequence (consequence of both hormonotherapy and radiotherapy). On axial post-contrastographic sequence (c), a hypervascularized lesion of 9 mm (dashed arrow) can be observed in the right lobe, at the middle third, in the posterior zone; on ADC sequence (d), lesion is hypointense (dashed arrow). In the central zone, in the post-contrastographic sequence (c), a hypervascularized area is identified, not confirmed in ADC sequence (d) (arrowheads both in c and d); the presence of hypervascularized areas is frequent in the central zone, but it is not suggestive of neoplastic lesions. On axial T2-weighted sequence (e), at a lower plane than in a–d, the vascular nervous bundles can be identified as areas of low signal (dashed arrows), while on post-contrastographic sequence (f) the right is surrounded by hypervascularized tissue (sign of infiltration). After prostatectomy, histopathological examination confirmed presence of tumor occupying 50 % of the prostate volume, with extension to both lobes
Fig. 8.11
(a–f) 70 years old, Gleason 6 (3 + 3). (a–c) Axial T2-weighted (TR: 4074; TR: 100) MR images, obtained at the middle third (a) and at the upper third (b, c), show a low-signal-intensity tumor which infiltrates both seminal vesicles (arrows in a), breaks capsule (arrows in b), with extension and envelopment of the right neurovascular bundle (dashed arrows), and asymmetry of the two neurovascular bundles. On ADC sequence (d), at the same level in (b), the prostate appears diffusely hypointense. On sagittal T2-weighted (TR: 4006; TE: 100) sequence (e), the fat plane between the seminal vesicle and the posterior urinary bladder is obliterated (arrow) in relation to local extension; conversely, in another patient (f), although the seminal vesicles are involved (arrowhead), the fat plane (arrow) is maintained
The principal pitfall of diffusion-weighted imaging includes a potential for false-positive findings of tumor related to postbiopsy hemorrhage: it has been reported that postbiopsy hemorrhage lowers the ADC of benign peripheral zone tissue and therefore limits the usefulness of diffusion-weighted imaging in this setting [60]. However, more recent data demonstrated excellent ability of the ADC in differentiation of prostate cancer from hemorrhage in the peripheral zone, and it was suggested that delayed imaging after biopsy may not be necessary [61] (Figs. 8.4 and 8.5).
The shortcomings include susceptibility-induced distortions, which are caused by susceptibility effects from an air-filled rectum or endorectal coil balloon, bone–tissue interfaces, poor local magnetic field homogeneity, and chemical shift artifacts caused by periprostatic fat.
8.4.2 DCE MR Imaging
Dynamic contrast-enhanced MR imaging was developed to help achieve a higher accuracy in prostate cancer localization and staging than that obtained with conventional T2-weighted MR imaging. DCE MR imaging is an advanced, fast, dynamic imaging technique (e.g., temporal resolution <5–10 s) that allows derivation of parameters that are closely related to microvascular properties and angiogenesis in tissues. As a response to the tumor hypoxia, there is a strong expression of angiogenesis-inducing factors, such as vascular endothelial growth factor and fibroblast growth factor receptor in their endothelial cells [62], with budding of new blood vessels from existing blood vessels (angiogenesis) or de novo formation of blood vessels (vasculogenesis). Tumor neovessels are in general more permeable than normal vessels, more heterogeneous in size and branching pattern, and more disorganized, making prostate tumors highly vascular and manifesting early hyperenhancement (higher and earlier peak enhancement than in normal tissue) and rapid washout of contrast material from the tumor, in comparison with normal prostate tissue. Microvascular alterations and neovascularity are in general most severe in prostate cancer, in comparison with other processes in the prostate such as BPH or prostatic intraepithelial neoplasia [63].
Numerous contrast enhancement parameters can be used to differentiate cancerous from benign tissue, including onset time, time to peak enhancement, peak enhancement, relative peak enhancement, and washout time; results of numerous studies suggest that the peak enhancement of cancer relative to that of surrounding benign tissue is the most accurate parameter for cancer localization [64] (Fig. 8.12). Typically, prostate cancer appears as an early and rapidly enhancing lesion with fast washout of contrast material in comparison with that of normal prostate tissue. The presence of rapid washout is highly indicative of prostate cancer [65], even in the absence of low T2 signal intensity. On contrast-enhanced MR images, the peripheral zone enhances more than the transition or central zone. In prostate cancer, onset time and time to peak enhancement are lower and peak enhancement is higher than in high-grade prostatic intraepithelial neoplasia and chronic inflammation, and abnormalities are more distinct in high-grade prostate cancer [66]. All DCE MR imaging parameters can be converted into pseudocolor parametric maps and overlaid on the anatomic T1- and T2-weighted images for interpretation. The contrast resolution is similar to that seen on T2-weighted images.
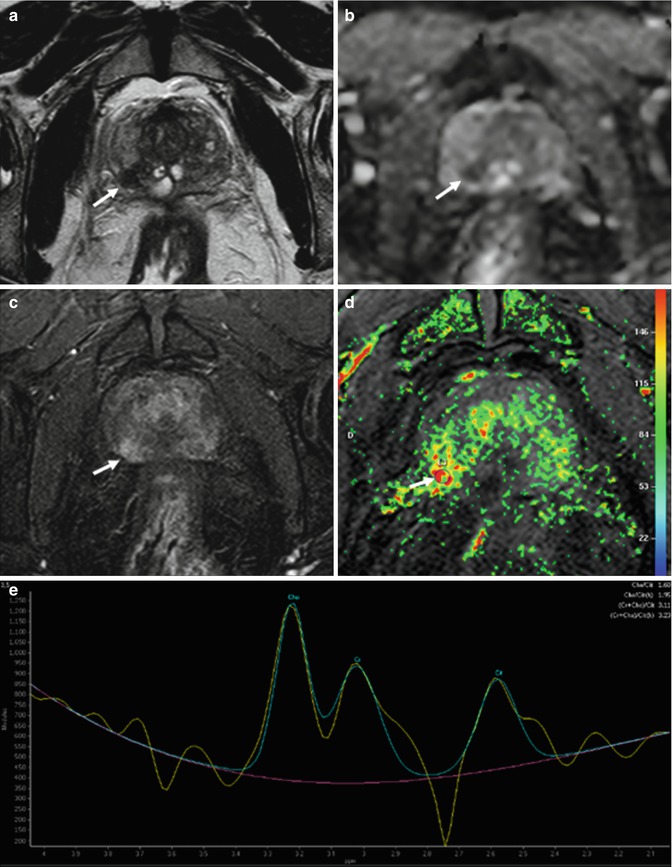
Fig. 8.12
(a–e) 68 years old, Gleason 7 (3 + 4). On axial T2-weighted (TR: 4074; TE: 100) sequence (a), a small hypointense nodule (arrow) is appreciable in the right peripheral zone, posteriorly. On ADC sequence (b), the lesion (arrow) appears hypointense while on post-contrastographic phase (TR: 8.9; TE: 4.4) (c) hypervascularized. Although these features allow to diagnose a neoplastic lesion, the exam was completed with a color map from DCE and MR spectroscopy. The color map from DCE MR imaging (d) shows that the area of highest permeability is the suspicious lesion (arrow), while an MR spectrum (e) obtained in the abnormal area shows an elevated ratio (in arbitrary units) of choline (Ch) and creatine (Cr) to citrate (Ci). Both findings are indicative of prostate cancer
Results of studies indicated that dynamic contrast-enhanced MR imaging can help improve the accuracy of prostate cancer staging. Localization accuracy with dynamic contrast-enhanced MR imaging increased to 72–91 %, as compared with 69–72 % for anatomic T2-weighted MR imaging only [49, 67–69]. DCE MR imaging in combination with MR spectroscopy allows detection of prostate cancer in 46 % of patients with prior negative transrectal US-guided biopsy results and a persistently elevated PSA level (4–10 ng/mL) versus a prostate cancer detection rate of 24 % with repeat transrectal US-guided biopsy in these patients [66] (Fig. 8.13). Although much progress has been made, challenges for DCE MR imaging remain. Benign prostate tissue (e.g., some BPH nodules) is also highly vascular, limiting the overall accuracy of DCE MR imaging in tumor detection, in particular the differentiation of prostatitis from cancer in the peripheral zone and BPH from transition zone tumors [63].
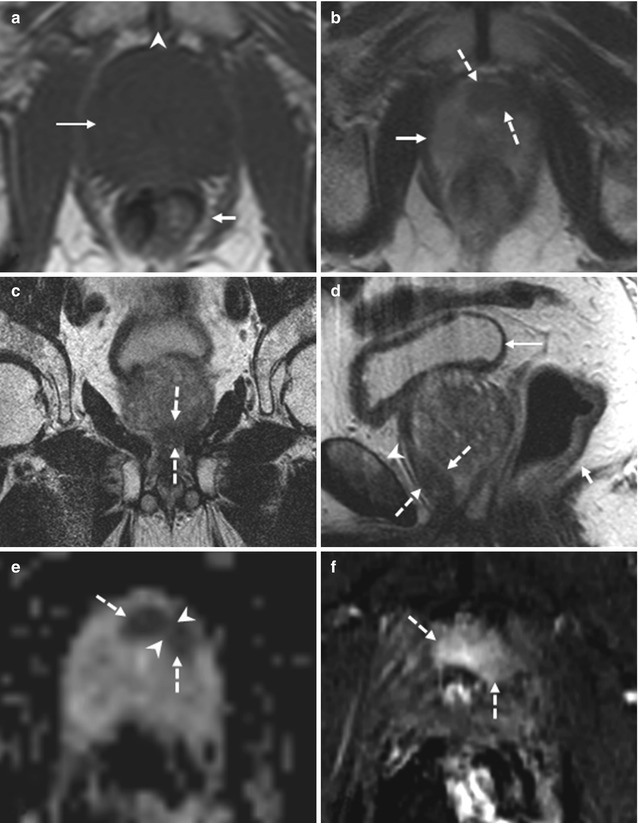
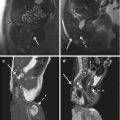
Fig. 8.13
(a–f) 74 years old, underwent randomized prostate biopsy both 2 years ago and 3 months ago because of increasing PSA (last value 15.6 ng/ml). Axial T1-weighted (TR: 550; TE: 9.3) sequence (a) shows a prostate (long arrow), homogeneously and regularly hypointense, with increased volume (estimated 89 ml). In this plane the rectum (short arrow) and symphysis pubis (arrowhead) can be recognized. On axial T2-weighted (TR: 3600; TE: 116) sequence (b), acquired just below a, the prostate (continued arrow) appears homogeneously hyperintense with the exception of an hypointense nodule, 10 mm long, at level of the anterior apex, mostly included in the left lobe (dashed arrows); on coronal (TR: 2300; TE: 116) (c) and sagittal (TR: 3600; TE: 114) (d) T2-weighted sequences, its position anteriorly in the apex is better appreciable (dashed arrows); in d, the rectum (short arrow), the symphysis pubis (arrowhead), and the bladder is recognizable (long arrow). On ADC sequence (e), the hypointense area on the T2-weighted sequences corresponds to two markedly hypointense contiguous nodules, but divided (arrowheads). On post-contrastographic sequence (f), the area appears hypervascularized. The identified lesion underwent targeted biopsy that revealed a prostatic cancer. This case shows the difficulty to detect cancer during randomized biopsy, if localized in the apex
Prostatic intraepithelial neoplasia and well-differentiated prostate cancer demonstrate less neovascularity and permeability changes than higher-grade prostate cancer, therefore representing a source of false-negative results at DCE MR imaging. Differentiation of chronic prostatitis from low-grade prostate cancer may not be possible, while differences were found in DCE MR imaging parameters between high-grade prostate cancer and chronic prostatitis [70]. In addition, low tumor volumes and infiltrative prostate cancer are affected by partial volume effects and are more difficult to detect. However, continuous evolution of rapid imaging techniques has allowed well-designed DCE MR imaging to improve the accuracy of intraprostatic detection of prostate cancer [47–49].
Criteria for extracapsular extension or seminal vesicle invasion at DCE MR imaging include abnormally high or asymmetric peak enhancement, contrast agent washout, and short onset time and time to peak enhancement. In the case of extracapsular extension, these findings are detected near the neurovascular bundle or rectoprostatic angle, broadly abutting the capsule, or in an extracapsular location. In seminal vesicle invasion, these abnormalities are found in the lumen of the ejaculatory ducts or in the seminal vesicles themselves and are associated with wall thickening of the ejaculatory ducts (Fig. 8.14). DCE MR imaging can improve the staging accuracy of less-experienced readers for detection of capsular penetration and seminal vesicle invasion and can allow detection of cancers that are not apparent on T2-weighted images. In addition, in multifocal cancers, DCE MR imaging may demonstrate additional foci of higher stage than the known lesions, leading to adequate upstaging of tumors [71].
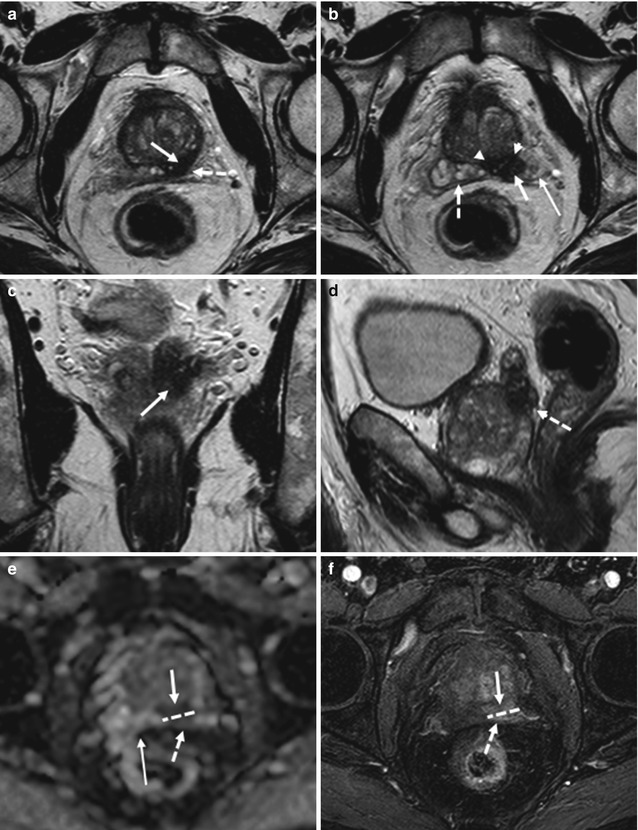
Fig. 8.14
(a–f) 72 years old, PSA 12.8 ng/ml, Gleason 9 (4 + 5). Axial T2-weighted (TR: 4074; TE: 100) sequence (a) shows a nodule, hypointense (arrow), in the posterior left lobe, at the upper third; at this level, the prostatic capsule appears diffuse thickening (dashed arrow). On the same sequence than in a, just at a upper plane (b), the anterior border (arrow) of the left seminal vesicle (long arrow) is not clearly definable because of an hypointense nodule (arrowheads) extending from the prostate: this is a sign of infiltration of the seminal vesicle. The right vesicle (dashed arrow) appears regularly hyperintense; however its medial border is close near the nodule. Coronal (TR: 4013; TE: 100) (c) and sagittal (TR 4006; TE: 100) (d) T2-weighted sequences show the nodule (arrow) with diffuse hypointensity of the left vesicle (dashed arrow). On ADC sequence (e), the nodule (arrow) and the infiltrated part of the seminal vesicle (dashed arrow) appear hypointense while on post-contrastographic phase sequence (f) hypervascularized; dashed lines show the border between the prostatic capsule and seminal vesicle, while the long arrow shows the right vesicle, hyperintense on ADC sequence, in relation to the physiological high level of water. Analysis of surgical specimen documented the presence of a tumor occupying both lobes, with involvement of the prostatic capsule and extension to both seminal vesicles
8.4.3 MR Spectroscopy
Because MR spectroscopy provides metabolic information about prostatic tissue by displaying the relative concentrations of chemical compounds within contiguous small volumes of interest (voxels), it is increasingly being used as a biomarker for detection of cancers, including prostate cancer [72]. MR spectroscopy is also known as chemical shift imaging. Chemical shift is the physical phenomenon in which the electron cloud surrounding the imaged nucleus (in prostate MR spectroscopy, hydrogen nuclei = protons) shields the nucleus partially from the external field and is highly dependent on the chemical environment (chemical bond, adjacent molecules, or atoms) and the molecule the proton is located in. Some chemical compounds have simple spectra (a singlet or single spectral peak) while others possess highly coupled spectra with multiple spectral main peaks, each of which may be composed of multiplets (doublet, triplet, etc.). The analyzed metabolites are choline, citrate, creatine, and polyamine.
Choline is represented by its distinct methyl proton resonance, which forms a composite peak of phospholipid cell membrane components (e.g., phosphocholine, glycerophosphocholine, and free choline) at 3.2 ppm. Owing to elevated cell membrane turnover (phospholipid synthesis and degradation) and increased cell surface compared with cell volume in cellular tumors, the choline level is elevated in the proliferating malignant tissue. Increased choline signal or concentration is considered the spectroscopic hallmark of cancer [73]; however, it has also been found in benign conditions of the prostate such as prostatitis [74].
Citrate is a normal secretion of the healthy prostatic glandular epithelium, and normal prostate tissue contains high levels of citrate (higher in the peripheral zone than in the central and transition zones) [75]; glandular hyperplastic nodules, however, can demonstrate citrate levels as high as those observed in the peripheral zone. The normal prostate has an MR spectrum with a prominent citrate peak at 2.6 ppm, which is usually seen as a doublet with occasional visualization of small additional side peaks. In the presence of prostate cancer, the citrate level is diminished or undetectable because of a conversion from citrate-producing to citrate-oxidating metabolism, but reduced levels can be found also in prostatitis and hemorrhage.
Creatine resonates at 3.0 ppm and is related to energy metabolism. Normal prostatic tissue contains high polyamine levels, of which spermine is a predominant component. Polyamines are represented by a relatively broad spectral peak between creatine and choline (3.1 ppm) that shows significant overlap with creatine and choline. Polyamine levels are reduced in prostate cancer because of higher metabolism.
Lipids cause signal in a broad range at the lower end of the citrate peak (typically 1.3 ppm). Adequate placement of saturation bands around the prostate is important to avoid contamination of the spectra by inclusion of extraprostatic fat, which causes large lipid signals.
Typically, the method for depicting tumors is based on an increased choline/citrate ratio. Because the creatine peak is very close to the choline peak in the spectral trace, the two may be inseparable; therefore, for practical purposes, the (choline + creatine)/citrate ratio is used as a biomarker in prostate tumor detection. An increase in the choline-to-citrate ratio or the (choline + creatine)/citrate ratio is often used as a marker of malignancy in prostate cancer and increases the specificity of diagnosis; however, it is most reliable in the peripheral zone (Figs. 8.12 and 8.15).
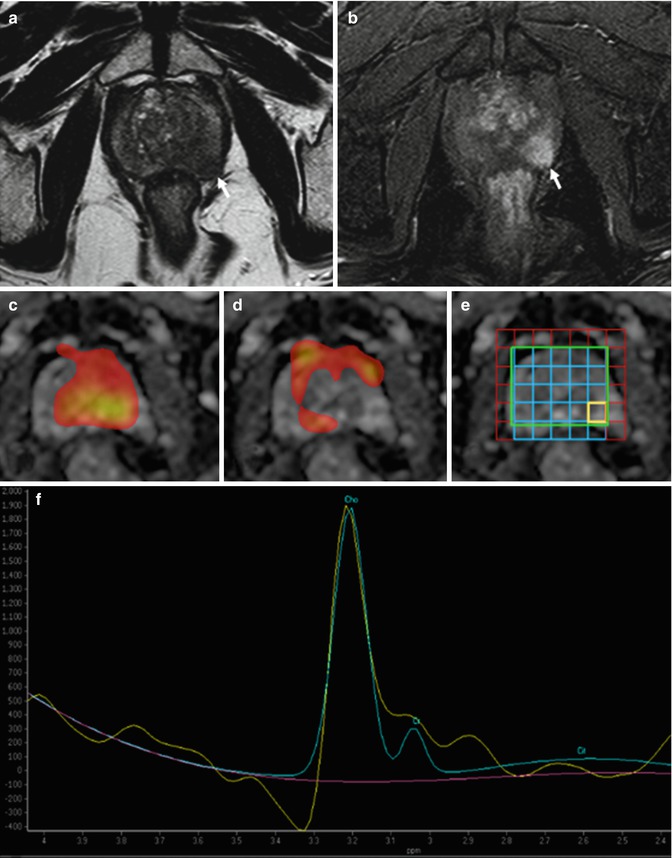
Fig. 8.15
(a–f) Axial T2-weighted (TR: 4074; TE: 100) MR image (a) shows a low-signal-intensity lesion in the left lobe of the prostate (arrow), which appears hypervascularized on post-contrastographic phase (arrow in b). MR spectroscopic images (c, d) demonstrate the areas respectively rich in choline (c) and citrate (d): the zone with suspected nodule is rich in choline and poor in citrate. MR spectrum (f) at the level of the lesion (yellow square in e) shows high ratios (in arbitrary units) of choline (Ch) and creatine (Cr) to citrate (Ci). The findings are indicative of cancer, which was confirmed with targeted biopsy
There is no consensus about spectral interpretation. The classification system described by Kurhanewicz et al. [76] is often used. In that system, a voxel is classified as normal, suspicious for cancer, or very suspicious for cancer. Furthermore, a voxel may contain nondiagnostic levels of metabolites or artifacts that obscure the metabolite frequency range. Voxels are considered suspicious for cancer if the ratio of choline and creatine to citrate is at least 2 standard deviations (SDs) higher than the average ratio for the normal peripheral zone. Voxels are considered very suspicious for cancer if the ratio of choline and creatine to citrate is higher than 3 SDs above the average ratio [77]. Voxels considered nondiagnostic contain no metabolites with signal-to-noise ratios greater than 5. In voxels in which only one metabolite is detectable, the other metabolites are assigned a value equivalent to the SD of noise.
Although MR spectroscopy shows promise as a problem-solving modality with high specificity, it is limited by low sensitivity. Partial volume effects may obscure the presence of prostate cancer, especially small or infiltrative lesions, which are obscured by strong signals from glandular BPH or surrounding normal tissue present in the MR spectroscopic voxels. By shifting the MR spectroscopic voxels to a position centered on the area of suspected abnormality, a voxel containing the highest possible partition of abnormal tissue can be generated; with this method, some of the lost information can occasionally be recovered.
The combined use of MR imaging and MR spectroscopy improves detection of tumors within the peripheral zone [44, 77, 78]; it has also been shown to increase the specificity in the localization of prostate cancer in the peripheral zone. MR spectroscopic imaging has shown higher specificity (68–99 %) and lower sensitivity (25–80 %) for prostate cancer localization, when compared with anatomic T2-weighted MR imaging (specificity, 61–90 %; sensitivity, 68–87 %) in prospective studies with prostatectomy specimens as reference standard [44, 46, 49, 79]; however, a multicenter trial that included 110 patients, with prostatectomy findings as reference standard, did not show any benefit for the addition of 1.5-T MR spectroscopic imaging to T2-weighted MR imaging in prostate cancer localization [80].
Related posts:

Stay updated, free articles. Join our Telegram channel

Full access? Get Clinical Tree


