Fig. 5.1
Schematic shows the uterus demonstrating the different locations of fibroids (image from the web)
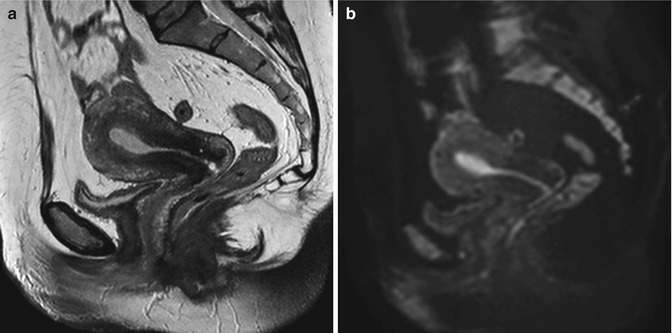
Fig. 5.2
Sagittal T2-weighted (TR 3,250 ms, TE 80 ms) (a) and sagittal DWI with b-Factor 800 ms (TR 4,000 ms, TE 75 ms) (b) of a normal uterus. We can see very well the distinction between the endometrium, which has low signal intensity on T2-weighted and on DWI images, and the myometrium, which has a higher signal intensity than the endometrium in both images
Leiomyomas occur more frequently in the body of the uterus (95 % of cases) (Fig. 5.3) and, rarely, in the cervix (<5 % of cases) (Fig. 5.10) and between the folds of the broad ligament (Fig. 5.9).
The incidence of fibroids is about 20–30 % among women of reproductive age, and it increases with age; by the age 50, myomas occur in 70 % of white women and in 80 % of black women, indeed [2]. This different incidence between white women and black women indicates the race as a factor that influences fibroids’ onset. Prospective cohort studies have shown that also body mass index, parity, birth control pill usage, and cigarette smoking are all factors affecting the prevalence and incidence of fibroids. These studies have also shown that the susceptibility to fibroids has a genetic component: there is a higher risk of leiomyomas in monozygous twins than in dizygotic ones [2–4]. Although the cause of fibroids is still unknown, there is an important familiar predisposition to fibroids and some factors that affect the incidence and prevalence.
Estrogens and progesterone affect the growth and maintenance of fibroid, because fibroids have not been described before menarche and because they regress after a woman reaches in menopause [5]. Furthermore, some studies have shown that most fibroids neither grow nor become smaller during pregnancy [6].
Microscopically, fibroids are composed by smooth muscle spindle-shaped cells, orientated by various directions. Among these cells, there is varying amount of fibrous connective tissue.
The cut surface has a characteristic whorl-like, trabeculated appearance, by whitish to reddish color according to the prevalence of fibrous connective tissue or the prevalence of smooth muscle cells.
Macroscopically, fibroids may be singular, but more often, in the same uterus at the same time, there are multiple fibroids, very variable in size, in structural composition, and in location (Figs. 5.3 and 5.4). This great variability of fibroids in the same uterus is due to the fact that each one arises from one cell in the myometrium and so there is not a clonal relation [7].
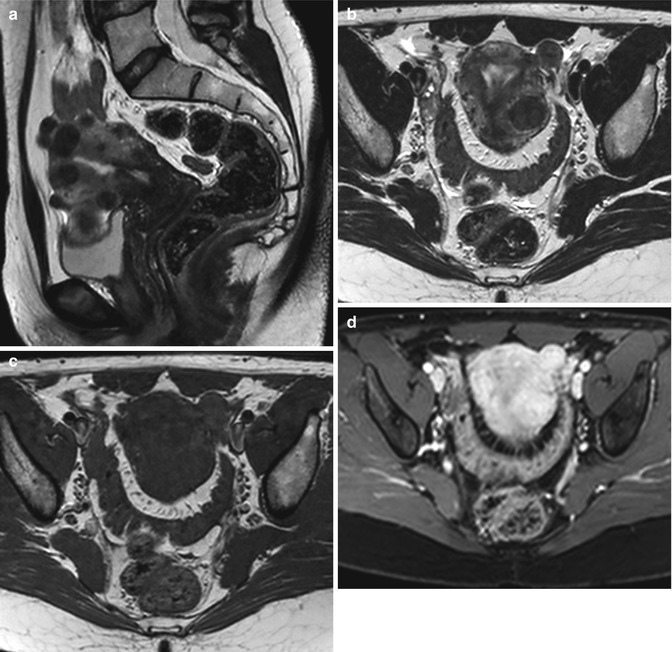
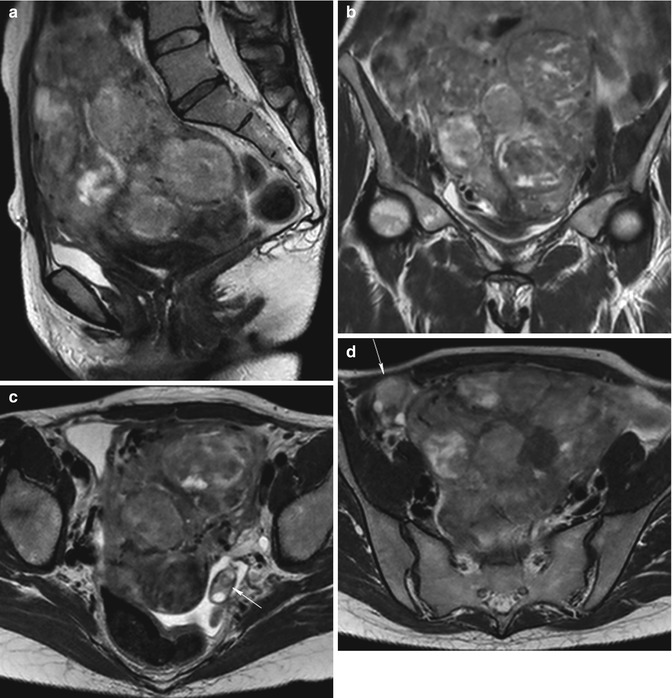
Fig. 5.3
Multiple uterine leiomyomas. Uterine leiomyomas are well-defined masses in the myometrium, with a homogeneous low signal intensity on T2-weighted images (TR 4,000 ms, TE 100 ms) (a, b) and a homogeneous isointense signal on T1-weighted image (TR 590 ms, TE 12 ms) (c), compared with that of the normal myometrium. On T1-weighted contrast-enhanced image (TR 4 ms, TE 2 ms) (d), they are homogeneous enhancing masses, but less than normal myometrium
Fig. 5.4
Multiple uterine leiomyomatosis. Sagittal (TR 4,800 ms, TE 80 ms) (a), coronal (TR 4,800 ms, TE 80 ms) (b), and axial (TR 5,800 ms, TE 80 ms) (c, d) T2-weighted images show a bulky and deformed uterus by the presence of multiple voluminous intramural fibroids, with heterogeneous signal intensity and with multiple hyperintensity areas (degeneration areas). The enlarged uterus determines pressure on the bladder and rectum (a, b) and displaces the adnexa (arrow in c, d)
The variation in size of fibroids is enormous, ranging from microscopic size (1–2 mm in diameter that are not detectable with imaging) to a quite large size (10–20 cm in diameter). Fibroid growth is a balance between mitosis, which produces more fibroid cells, and necrosis or apoptosis, which kills fibroid cells. As fibroids enlarge, they may outgrow blood supply and they may degenerate. The type of degenerative change depends on the degree and rapidity of the onset of the vascular insufficiency. Often fibroids >5–8 cm in diameter degenerate. Types of degeneration include hyaline degeneration, myxoid or cystic degeneration, necrotic degeneration, red (hemorrhagic) degeneration, calcification or fatty degeneration, and sarcomatous transformation (very rarely, <0.05 % of resected fibroids) [1].
According to their location (Fig. 5.1), fibroids are distinguished in:
Submucosal, when they originate from the myometrium underlying the endometrium; they may be sessile or pedunculated and may protrude into the uterine cavity (Fig. 5.5).
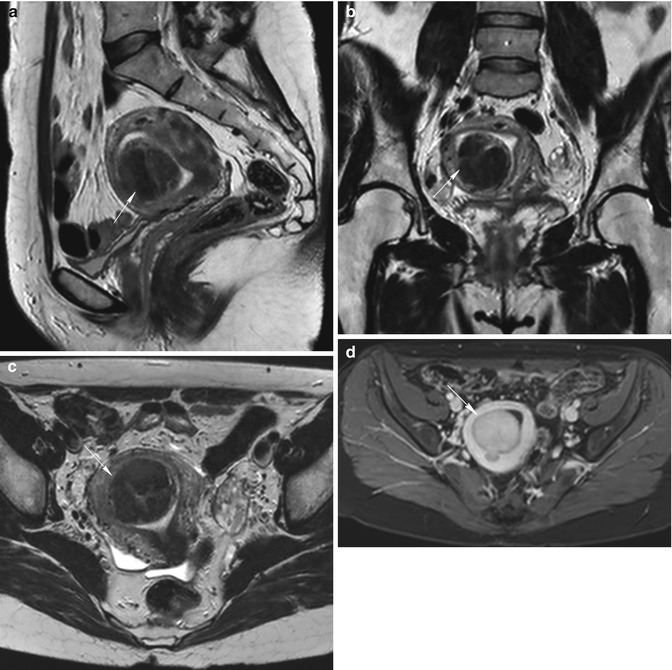
Fig. 5.5
Pedunculated submucosal fibroid (arrow in all images). Sagittal (TR 3,400 ms, TE 80 ms) (a), coronal (TR 3,700 ms, TE 100 ms) (b), axial (TR 4,800 ms, TE 120 ms) (c) T2-weighted, and axial contrast-enhanced fat-suppressed T1-weighted (TR 4 ms, TE 2 ms) (d) images show a pedunculated submucosal fibroid which protrudes into the uterine cavity. Fibroid demonstrates homogeneous low signal intensity on T2-weighted images and homogeneous high signal enhancement on T1-weighted images, but lower than of adjacent myometrium
Intramural, when they grow entirely within the wall of the uterus (Fig. 5.6).
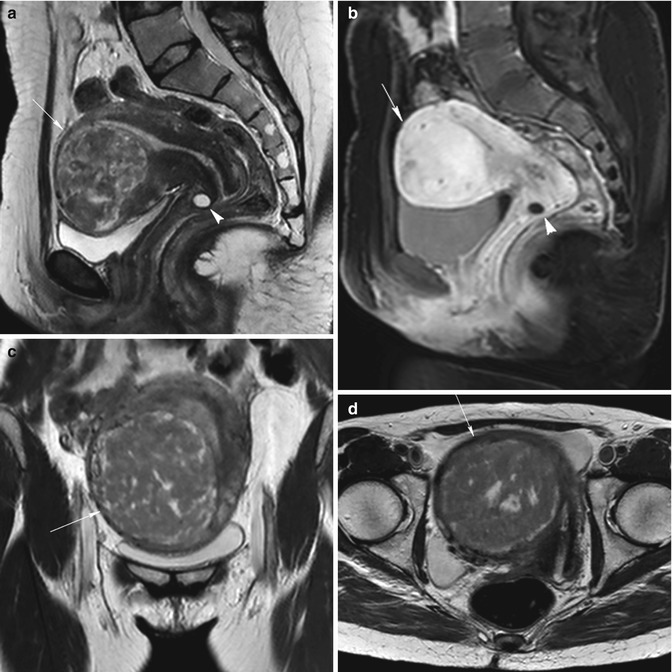
Fig. 5.6
Intramural uterine fibroid (arrow in all images). Sagittal T2-weighted images (TR 2,900 ms, TE 80 ms) (a) show an intramural fibroid (arrow) with heterogeneous low signal intensity. Sagittal contrast-enhanced fat-suppressed T1-weighted images (TR 4 ms, TE 2 ms) (b) show heterogeneous high signal enhancement of the fibroid. Naboth’s cyst in the cervix of the uterus (arrowhead in a and b). Coronal (TR 3,500 ms, TE 80 ms) (c) and axial (TR 3,250 ms, TE 80 ms) (d) T2-weighted images of another woman show a voluminous intramural fibroid that displaces laterally the uterus. This fibroid demonstrates a heterogeneous low signal intensity on T2-weighted images, with some hyperintense areas that correspond to myxoid degeneration areas
Subserosal, when they originate beneath the uterine serosa and distort the contour of the outer face of the uterus; they may be sessile (Fig. 5.7) or pedunculated (Fig. 5.8).
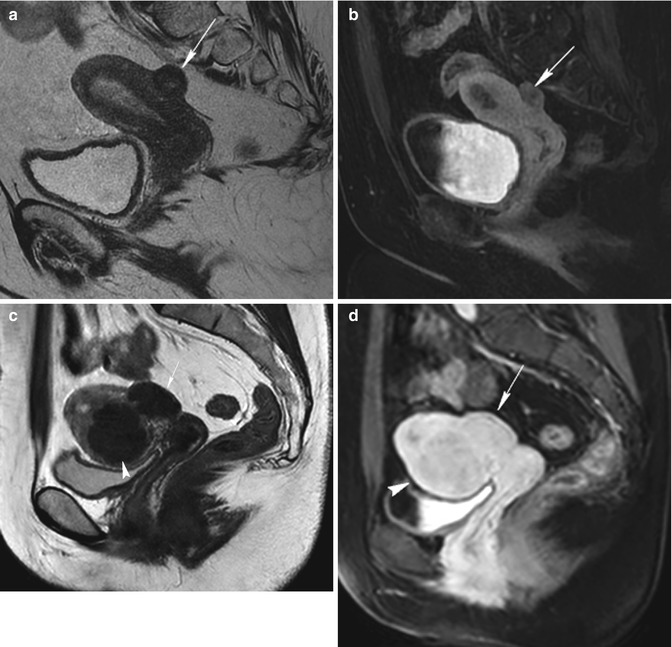
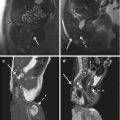
Fig. 5.7
Sessile subserosal fibroids. A little sessile subserosal fibroid on the superior face of the uterus (arrow) with heterogeneous low signal intensity on sagittal T2-weighted image (TR 4,500 ms, TE 90 ms) (a) and with low signal enhancement on contrast-enhanced fat-suppressed T1-weighted image (TR 4 ms, TE 2 ms) (b). Another woman (c and d) with a sessile subserosal fibroid on the posterior face of the uterus (arrow) and with an intramural fibroid on the inferior region of the uterus (arrowhead); both the fibroids have homogeneous low signal intensity on T2-weighted image (TR 2,900 ms, TE 80 ms) (c) and homogeneous high signal enhancement on contrast-enhanced fat-suppressed T1-weighted image (TR 4 ms, TE 2 ms) (d). Both these patients are eligible to uterine fibroid embolization, because the sessile subserosal fibroids have a large attachment to the uterus (larger than one third of the diameter of the fibroid)
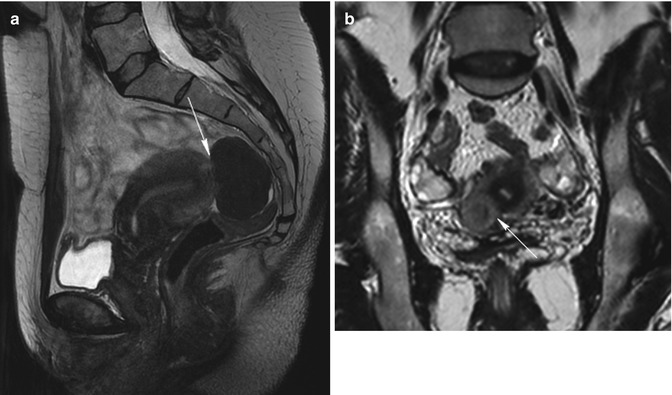
Fig. 5.8
Pedunculated subserosal fibroids. Sagittal T2-weighted image (TR 4,700 ms, TE 90 ms) (a) shows a homogeneous hypointense well-defined mass at the fundus of the uterus that is a pedunculated subserosal fibroid with a little stalk (arrow). Coronal T2-weighted image (TR 3,700 ms, TE 100 ms) (b) of another woman shows a isointense well-defined mass within a hypointense area at the inferior region of the uterus that is a pedunculated subserosal fibroid with a large stalk (arrow) and a little degenerated area within. The patient (a) is not eligible to uterine artery embolization, because the base of the stalk of the fibroid is less than one third of the diameter of the fibroid (this is a contraindication to UFE), while the patient (b) is eligible too
Intraligamentous, when they grow by lateral side of the uterus and may extend between the folds of the broad ligament (Fig. 5.9).
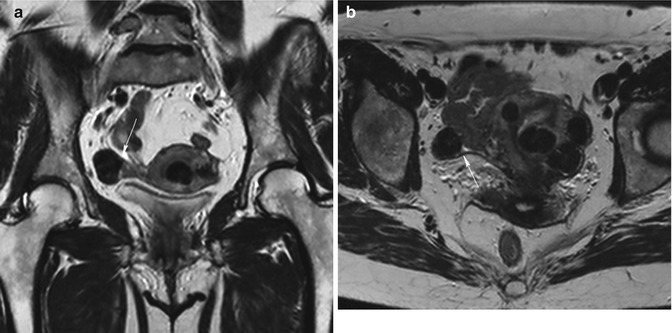
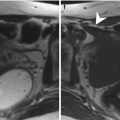
Fig. 5.9
Intraligamentous fibroid. Coronal (TR 3,700 ms, TE 100 ms) (a) and axial (TR 4,800 ms, TE 120 ms) (b) T2-weighted images show multiple hypointense well-defined uterine masses with different locations (submucosal, intramural, subserosal fibroids). One of them (arrow) is located between the folds of the right broad ligament
Cervical, when they grow by the cervix of the uterus (Fig. 5.10).
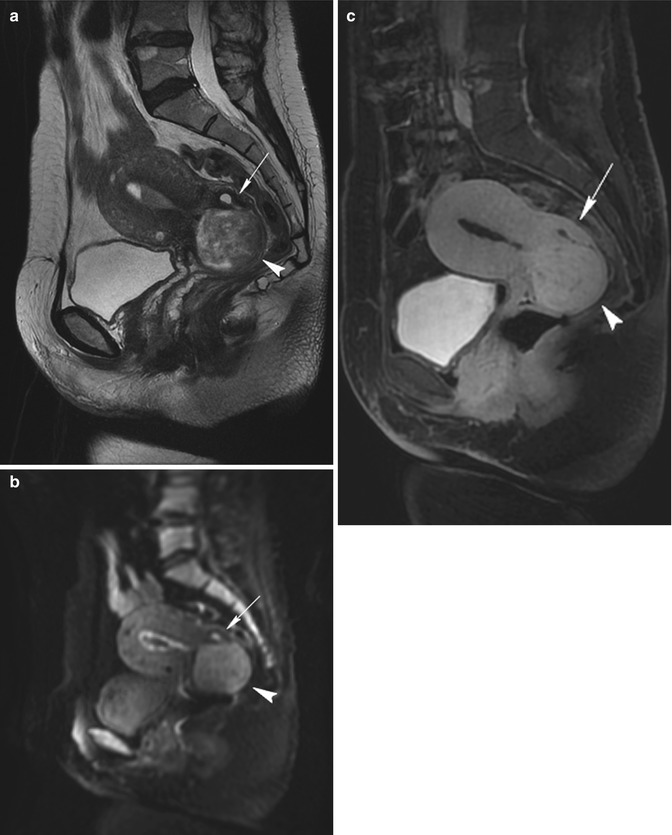
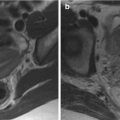
Fig. 5.10
Cervix leiomyoma with duplicity of the uterus. Sagittal T2-weighted (TR 4,900 ms, TE 90 ms) (a), sagittal DWI with b-Factor 800 ms (TR 5,000 ms, TE 70 ms) (b), and sagittal contrast-enhanced fat-suppressed T1-weighted (TR 4 ms, TE 2 ms) (c) images show a leiomyoma in the cervix of the uterus (arrowhead). On the posterior site of the uterus, there is an embryonic residue that represents a second little uterus (arrow). In both the uteri, endometrium is shown, and there is a little intracavitary fluid (exam obtained during menstrual phase)
We define submucosal or subserosal pedunculated leiomyomas when they protrude into the uterine cavity or out of the uterus through a stalk.
The most common fibroid location is intramural (40 % of women after age 35) [8].
This classification has clinical significance because the symptoms and the treatment vary among the subtypes of leiomyomas.
Uterine leiomyomas are generally less vascular in comparison to adjacent myometrial tissue [9] (Fig. 5.11).
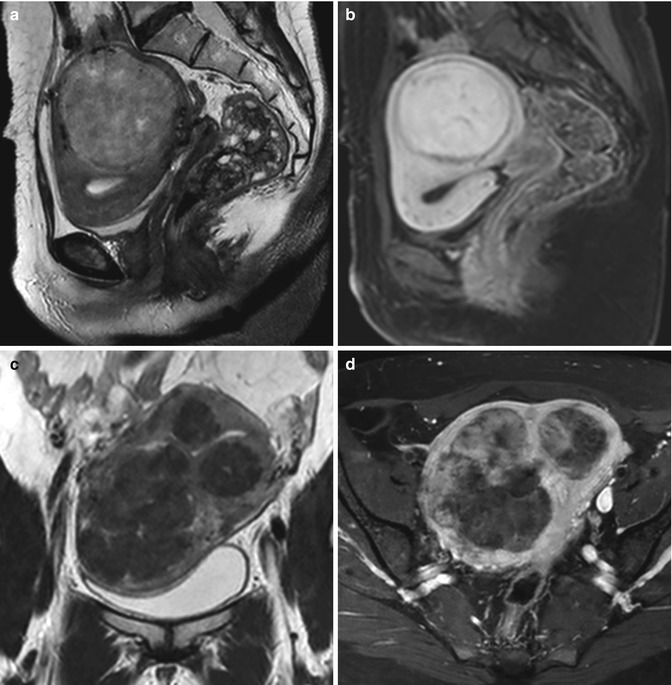
Fig. 5.11
Leiomyomas with different vascularization. First patient. Sagittal T2-weighted image (TR 3,250 ms, TE 80 ms) (a) shows a heterogeneous iso-hypointense intramural voluminous leiomyoma, which deforms the uterus; on sagittal contrast-enhanced fat-suppressed T1-weighted image (TR 4 ms, TE 2 ms) (b), it shows high signal intensity, similar to that of adjacent myometrium, and low-signal-intensity rim enhancement. Second patient. Coronal T2-weighted image (TR 3,700 ms, TE 80 ms) (c) shows a uterus with multiple heterogeneous hypointense signal intensity leiomyomas that, on axial contrast-enhanced fat-suppressed T1-weighted image (TR 450 ms, TE 12 ms) (d), show heterogeneous low-signal-intensity enhancement to that of adjacent myometrium
Fibroids derive their main blood supply almost exclusively directly from branches of the arcuate (intramural) arteries. The arcuate arteries course through the outer third of the myometrium and are branches of the uterine artery. The uterine artery is the first or the second branch of the anterior division of the internal iliac artery (also called the hypogastric artery) in 51 % of cases, and it has several branches: the cervicovaginal artery and the arcuate arteries. The uterine artery may be replaced by small arterial branches or may be absent; it is often replaced by the ipsilateral ovarian artery. In 80–90 % of cases, the ovarian artery originates directly anteromedially from the abdominal aorta a few centimeters below the renal arteries; rarely, they can originate from the renal, lumbar, adrenal, or iliac arteries [10, 11].
The arcuate arteries give rise to peripheral arteries that course toward the serosal surface of the uterus and radial arteries that course toward the endometrial cavity. The radial arteries terminate at the endometrial junctional zone border by giving off multiple branches that enter and supply the endometrium. Longer, tortuous branches are described as “spiral arterioles.” Arterial blood from the spiral arterioles can pass directly into veins through arteriovenous anastomoses at multiple levels.
The perifibroid plexus is composed of terminal arteries, and it has any type of vascular anastomosis. These arteries have a diameter of 500–1,000 μm in most cases; instead, the arcuate and radial arteries, the spiral arterioles, and the utero-ovarian anastomosis have usually a diameter less than 500 μm.
The fibroid region next to the periphery, the most biologically active zone, has a higher density of vessels than the central region, where, as a consequence, frequently there is a necrotic area. Differences in vascularization between fibroids’ periphery and central zone are more evident when fibroids are great in size. In support of this, there is the observation that large fibroids are more hypoxic than small ones [12].
As leiomyomas enlarge, they may outgrow blood supply, and they may have degenerative changes.
Degeneration occurs primarily in large leiomyomas and causes an increase of the symptoms or the onset of new symptoms (abdominal pain, menorrhagia, and bulk-related symptoms such as pelvic heaviness, palpable mass, urinary urgency, constipation, and bowel obstruction).
Types of degeneration are:
Hyaline degeneration, a smooth homogeneous translucent zone in the fibroid.
Myxoid (or cystic) degeneration, a gelatinous zone with small cystic cavities that may be a consequence to hyaline degeneration.
Fatty degeneration, it may be a consequence to hyaline degeneration or due to lipomatous metaplasia, and it is more frequent during puerperium.
Fibroid’s calcification, more frequent in subserosal fibroids.
Red degeneration, it is a hemorrhagic infarction of the uterine leiomyoma, due to venous obstruction at the periphery of the lesion.
Necrotic degeneration.
Sarcomatous transformation (very anecdotic), it begins in the center of the lesion and causes rapid important growth of the fibroid that becomes fixed and painful.
The clinical presentation is variable, depending on the size, location, and number of fibroids.
The most frequent symptoms of fibroids are abnormal uterine bleeding (menorrhagia or menometrorrhagia) and pelvic pain and discomfort (due to “mass effect”). As fibroids enlarge, they may produce pressure on surrounding structures (Fig. 5.12). When the fibroid uterus presses on the bladder, urinary urgency and frequency occur. When the rectum is pushed and displaced, symptoms are referable to the bowel. Acute pain occurs in 30 % of women with uterine fibroids, usually due to acute degeneration or torsion of pedunculated subserosal myomas or prolapse of pedunculated submucosal ones.
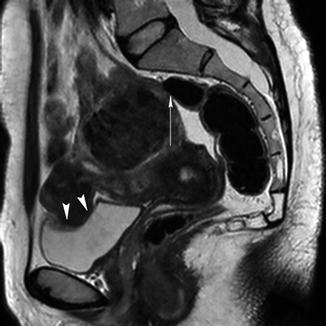
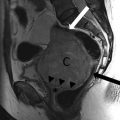
Fig. 5.12
Sagittal T2-weighted image (TR 3,400 ms, TE 80 ms) shows a bulky uterus with two heterogeneous low-signal-intensity fibroids that press on the bladder (arrowheads) and push the rectum (arrow)
Submucosal and intramural fibroids may also cause infertility, spontaneous abortions, or premature placental abruption.
5.2 Role of Imaging (US and MRI)
Ultrasonography is often the first method to detect the presence of leiomyomas due to its availability and low cost. Transvaginal ultrasound provides better visualization of the endometrium and submucosal leiomyomas than abdominal ultrasound, especially in obese women. Limitations of transvaginal ultrasound include operator-dependent variability, failure to detect small uterine fibroids, and difficulty in mapping large uteri, particularly when there are multiple fibroids. Transabdominal ultrasound is able to locate large leiomyomas, while transvaginal ultrasound is better at detecting leiomyomas that are near to the cervix. Larger fibroids may be evaluated best using a combination of abdominal and transvaginal ultrasound techniques. At US, leiomyomas typically appear as symmetrical, well-defined, heterogeneous, solid masses. The uterus may appear bulky or enlarged, with an abnormality in the normal contour. Degenerative fibroids may have a complex appearance. Doppler US shows fibroids’ circumferential vascularity, but some of them have great vascularization, while necrotic fibroids have an absence of flow.
However, pelvic MR imaging provides better soft-tissue contrast resolution, lack of operator dependence, and decreased variability in interpretation of images when compared with transvaginal US. MRI can visualize fibroids as small as 5 mm in diameter, and it is capable of differentiating adenomyosis from uterine leiomyomas. Thus, MRI is the most accurate imaging technique for detection and measuring fibroids (number, volume, and location of each fibroid; its signal intensity characteristics; and its enhancement characteristics), measuring uterine volume, and excluding whatever concomitant pathology that may increase the symptoms or may be the real cause of the symptomatology (Figs. 5.13 and 5.14).
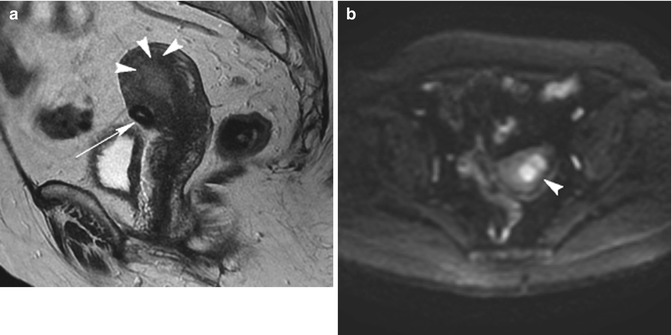
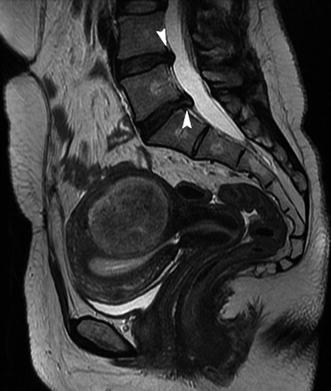
Fig. 5.13
Endometrial tumor. Patient with abnormal uterine bleeding. Sagittal T2-weighted image (TR 4,500 ms, TE 90 ms) (a) shows a little subserosal fibroid (arrow) on the inferior face of the uterus, but it shows also the loss of junctional zone at the fundus of the uterus, where there is an ill-defined homogeneous slightly hyperintense signal mass that penetrates into the myometrial wall (arrowheads). On axial DWI with b-Factor 800 ms image (TR 4,000 ms, TE 70 ms) (b), this mass (arrowhead) has a high restriction of signal intensity that confirms its malignant origin. Symptoms referred by the patient are due to endometrial malignant lesion
Fig. 5.14
Patient with abnormal uterine bleeding and with lumbar pain. Sagittal T2-weighted image (TR 4,400 ms, TE 90 ms) shows an intramural heterogeneous intermediate signal intensity fibroid, which is probably the cause of abnormal uterine bleeding. There is also the presence of two posterior bulgings between the two last lumbar vertebras and the first sacral ones (arrowheads); probably this is the cause of lumbar pain referred by the patient
MR imaging is a noninvasive procedure that allows the diagnosis of fibroids to be established with a great degree of confidence and affects patient treatment by reducing the number of unnecessary surgeries [1]. Accurate detection and localization of leiomyomas with MR imaging can result in planned therapies being changed or obviated [13].
5.3 MRI Protocol
Our MR images are obtained with a 1.5-T Philips Insignia (Philips Healthcare) using a torso phased-array coil. In order to minimize artifacts caused by bowel motion, each patient receives 20 mg of butylscopolamine bromide (Buscopan, Boehringer Ingelheim) in a single dose, with an intramuscular injection. The patient is restricted to clear fluids 4 h before the examination and voided immediately before the study.
Our protocol includes imaging sequences before and after administration of an intravenous bolus of gadolinium-based contrast (0.1 mmol/kg, gadobutrol, Gadovist, Bayer):
Sagittal T2-weighted turbo spin echo (TR 1,000 ms, TE 80 ms, turbo factor 22, flip angle 90°, matrix 200 × 190, slice thickness 2.5 mm, acquisition time 2.5 min)
Coronal T2-weighted turbo spin echo (TR 3,000/5,000 ms, TE 100 ms, turbo factor 30, flip angle 90°, matrix 180 × 176, 3 mm slices, acquisition time ±2 min)
Axial T2-weighted turbo spin echo (TR shortest automatic, TE 100 ms, turbo factor 22, flip angle 90°, matrix 200 × 196, 2.5 mm slices, acquisition time 3.5/4 min)
Axial T1-weighted turbo spin echo (TR 400–600 ms, TE 12 ms, turbo factor 4, flip angle 95°, matrix 184 × 182, 2.5 mm slices, acquisition time ±2 min)
Axial diffusion-weighted imaging (DWI) with b-Factor at time 0 ms and 800 ms (TR shortest automatic, TE shortest automatic, flip angle 90°, matrix 88 × 72, 5 mm slices, acquisition time ±1 min, with fat suppression SPIR)
Sagittal DWI with b-Factor at time 0 ms and 800 ms (TR shortest automatic, TE shortest automatic, flip angle 90°, matrix 84 × 80, 3 mm slices, acquisition time ±3.5 min, with fat suppression SPIR)
Apparent diffusion coefficient map (ADC Map)
Coronal THRIVE (T1 high-resolution isotropic volume excitation) (TR shortest automatic, TE shortest automatic, flip angle 10°, matrix 208 × 164, multislice 3D, acquisition time 1.5 min, with fat suppression SPAIR)
Coronal CE-MRA, an angiographic sequence with contrast enhancement, it is a T1-TFE 3D sequence (T1-weighted fast gradient-echo) (TR shortest automatic, TE shortest automatic, flip angle 35°, matrix 360 × 360, acquisition time 22 s)
Axial e-THRIVE (Enhanced T1 high-resolution isotropic volume excitation) (TR shortest automatic, TE shortest automatic, flip angle 10°, matrix 208 × 164, acquisition time 55 s, with fat suppression SPAIR)Related posts:

Stay updated, free articles. Join our Telegram channel

Full access? Get Clinical Tree