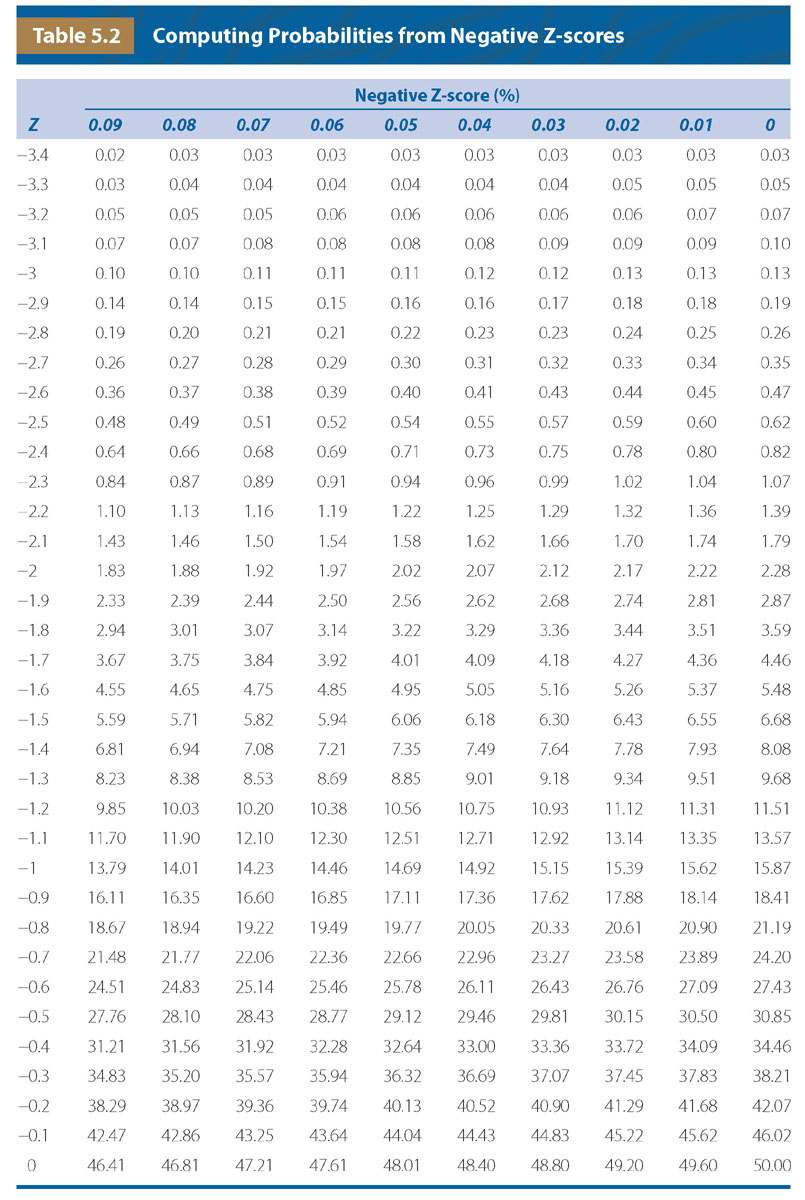
If the measurement for the mean aortic diameter is 4 mm for a given gestational age, and the standard deviation is 0.6, what would be the 5th and 95th percentiles?
The computations are as follows:
1. The Z-score for the 95th percentile is +1.65
2. The Z-score for the 5th percentile is −1.65
3. The Z-score is multiplied by the standard deviation.
a. 95th Percentile = mean + (1.65 × SD) = 4 + (1.65 × 0.6) = 4.99
b. 5th Percentile = mean − (1.65 × SD) = 4 − (1.65 × 0.6) = 3.01
Table 5.3 lists the Z-scores for commonly used percentiles.
Commonly Used Percentiles and Their Corresponding Z-scores
Percentile | Z-score |
1 | −2.33 |
2.5 | −1.96 |
5 | −1.65 |
10 | −1.28 |
20 | −0.84 |
25 | −0.67 |
50 | 0 |
75 | 0.67 |
80 | 0.84 |
90 | 1.28 |
95 | 1.65 |
97.5 | 1.96 |
99 | 2.33 |
Another use of this table would be computation of the standard deviation from the percentiles. The first step would be to find the percentile of interest from Tables 5.1 or 5.2 and then identify the corresponding Z-score that is equal to the standard deviation. For example, if one wanted to find the standard deviation for the 10th percentile, the user would refer to Table 5.2 and find the value closest to the 10th percentile. Once identified, the examiner would find the value on the left side of the table, which is 1.2 and the value at the top of the table, which is 0.08. Therefore, the corresponding Z-score (standard deviation) is −1.28.
Creating Percentile Graphs
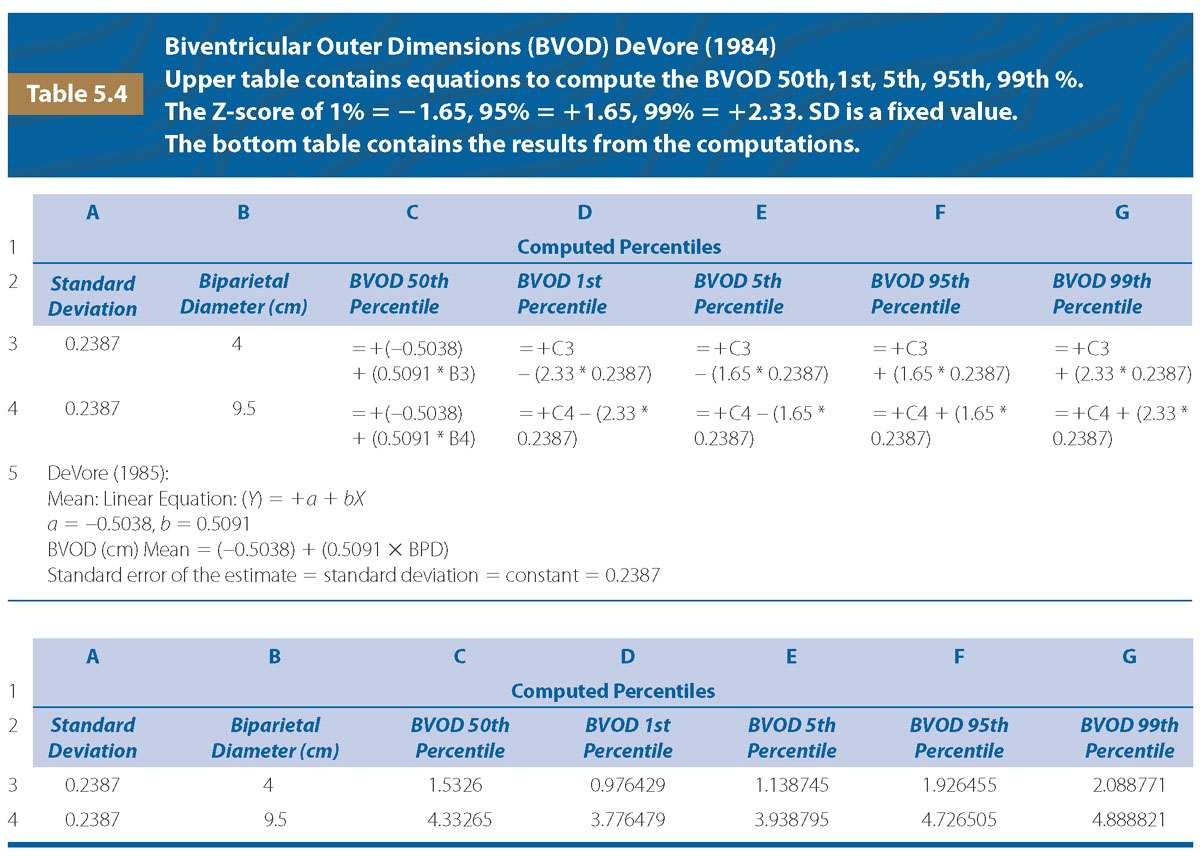
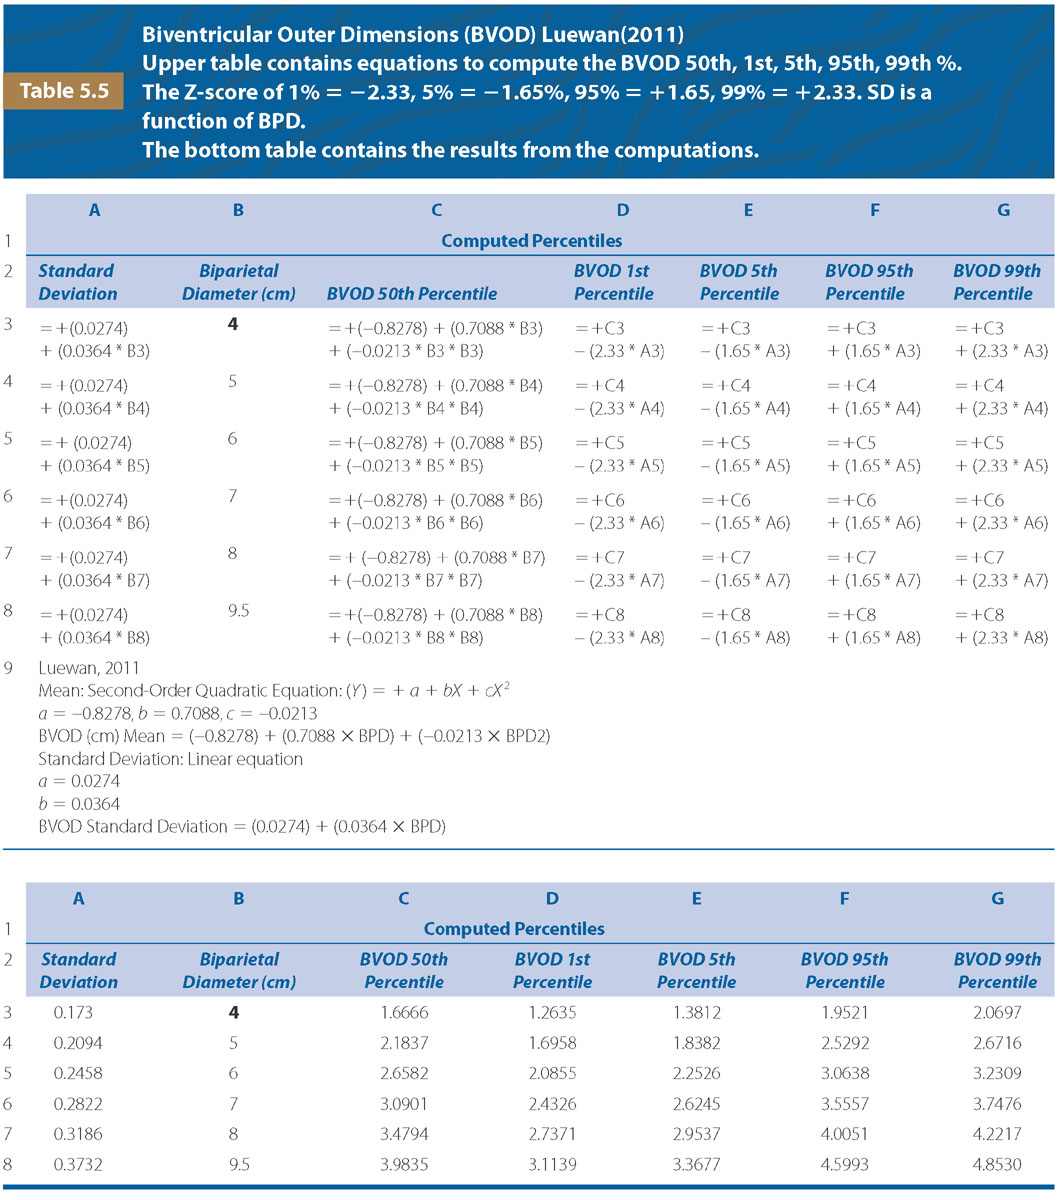
Authors from the studies cited in this chapter have reported various types of data analysis in the form of regression equations, percentiles, standard deviations, and standard error of the estimate. Even though data may be reported in different formats, using the concepts described above, the 1st, 5th, 50th, 95th, and 99th percentiles for various cardiac measurements can be computed using an Excel spreadsheet. Tables 5.4 and 5.5 are examples of the linear and quadratic equations used to create percentile curves used in this chapter.
M-MODE QUANTITATION OF FETAL CARDIAC STRUCTURES
Techniques for Obtaining M-Mode Measurements of the Ventricular Chambers
The use of M-mode ultrasound to detect cardiac motion was first reported in 1971 followed by its use to detect fetal death in 1976.10,11 In 1980, Kleinman et al.12 published the first paper using M-Mode to diagnose abnormal cardiac rhythm and function. In 1981, DeVore et al.13 reported using M-Mode to measure the pre-ejection and ventricular ejection time of the right and left ventricles. Between 1982 and 2011, several investigators reported the use of real-time-directed M-mode echocardiography and cardio-STIC-M-mode to obtain M-mode recordings from which they made cardiac and outflow tract measurements.1–5,14–17 Table 5.6 contains a summary of each of the above studies. Allan, DeVore, Cartier, and Luewan provided regression equations, while St. John Sutton only performed correlation analysis.1–5,14–17 Investigators compared cardiac measurements with gestational age and/or biometric measurements from the fetus (biparietal diameter, head circumference, abdominal circumference, and femur length).1–5,14–17 Figure 5.1 compares the two methods by which the M-mode was recorded from the above studies to measure the ventricular diameters and the corresponding measurements as defined in Table 5.6. The first method obtains the M-mode from a location just below the movement of the mitral and tricuspid valve leaflets (Fig. 5.1). When the M-mode is obtained at this level, often the left ventricular wall is obscured because of the adjacent papillary muscle. The second method obtains the recording at the level of the atrioventricular valves, which is the largest diameter of the chambers (Fig. 5.1). As a result, I prefer measuring all chamber dimensions using this approach.
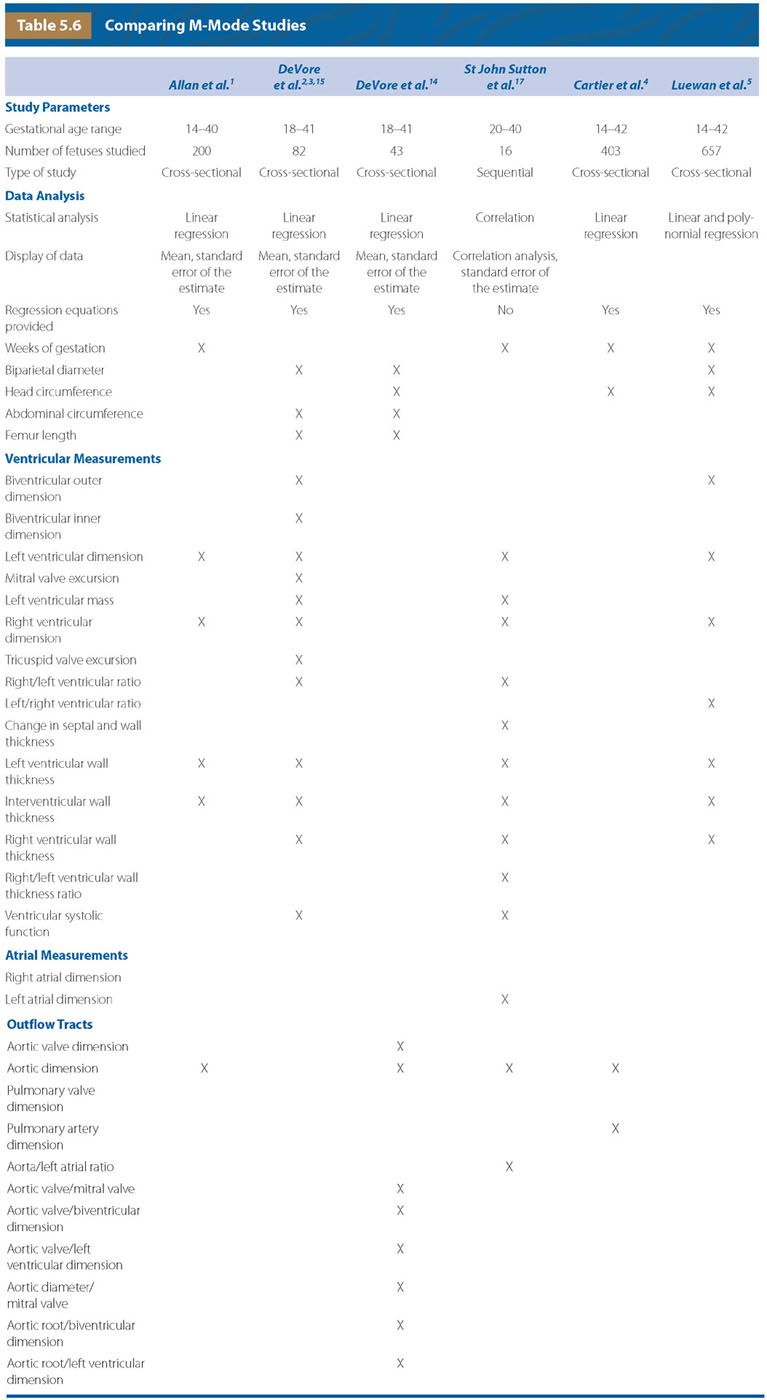
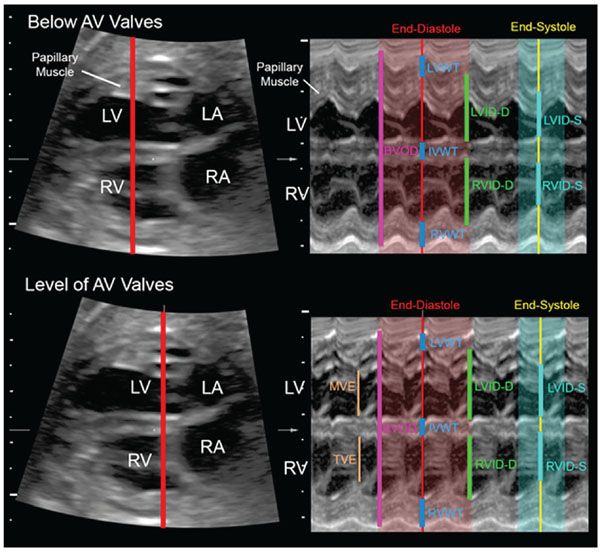
FIGURE 5.1: This illustrates the M-mode recording obtained when the cursor is placed below the level of the atrioventricular (AV) valve leaflets (upper panel) and at the level of the leaflets (lower panel). When the cursor is placed at the level of the valves, the papillary muscle of the left ventricle does not obscure the boundary of the left ventricular wall. In addition, the mitral valve opening excursion (MVE) and tricuspid opening excursion (TVE) can be identified for the measurement of valve size. LV, left ventricle; RV, right ventricle; LA, left atrium; RA, right atrium; BVOD, biventricular outer dimension; RVID-D, right ventricular inner dimension at end-diastole; RVID-S, right ventricular inner dimension at end-systole; LVID-D, left ventricular inner dimension at end-diastole; LVID-S, left ventricular inner dimension at end-systole; LVWT, left ventricular wall thickness at end-diastole; RVWT, right ventricular wall thickness at end-diastole; IVWT, interventricular septal wall thickness at end-diastole; Fractional shortening is computed as follows: Right ventricle: [(RVID-D − RVID-S)/RVID-D]; Left ventricle: [(LVID-D − LVID-S)/LVID-D].
Comparison of 5% and 95% Percentile Graphs for Right and Left Ventricular Inner Dimensions
Gestational Age
Figure 5.2 compares the end-diastolic right and left ventricular inner dimensions between Allan et al.1 and Luewan et al.5 The difference between the 5% and 95% percentiles is narrower during the second trimester but wider in the third trimester when polynomial regression is used (Luewan et al.5) compared with linear regression (Allan et al.1). Allan et al.1 obtained the M-mode measurements at the level just below the mitral and tricuspid valves, while Luewan et al.5 obtained the measurements at the level of the valves.
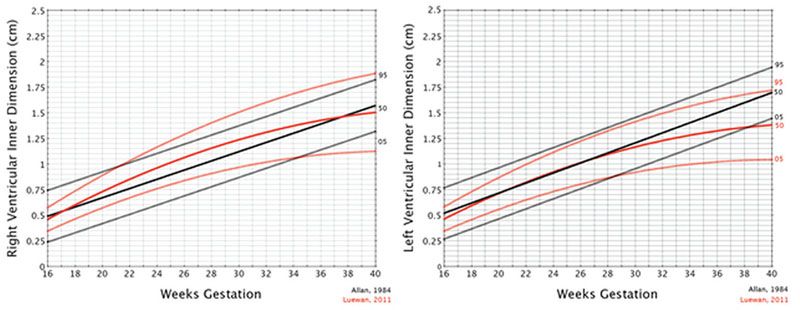
FIGURE 5.2: Comparison of the mean, 95% and 5% for the left and right inner dimensions between studies by Allan et al.1 and Luewan et al.5 Allan et al. found that the best fit for the regression analysis was linear, while Luewan et al. found that it was a second-order polynomial. Luewan’s data demonstrated a narrower band for the 5% and 95% during the second trimester and a larger band in the third trimester.
Biparietal Diameter
Figure 5.3 compares the end-diastolic right and left inner dimensions between DeVore et al.2 and Luewan et al.5 The 5% and 95% confidence intervals are wider in the third trimester when polynomial regression is used (Luewan et al.5) compared with linear regression (DeVore et al.2). Both DeVore et al.2 and Luewan et al.5 obtained the measurements of the ventricles at the level of the opening and closing of the mitral and tricuspid valve leaflets (Fig. 5.1).
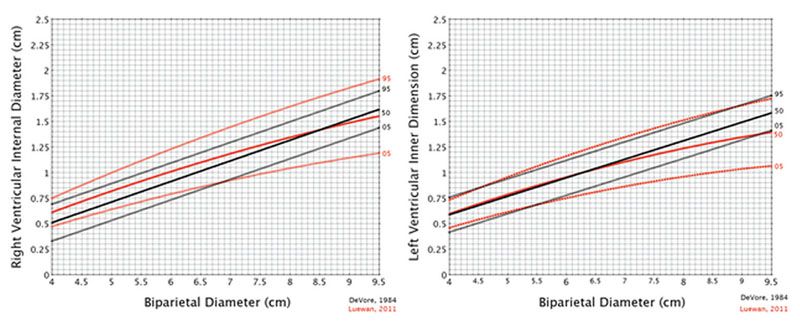
FIGURE 5.3: Comparison of the mean, 95% and 5% for the left and right internal dimensions between studies by DeVore et al.2 and Luewan et al.5 DeVore et al. found that the best fit for the regression analysis was linear, while Luewan et al. found that it was a second-order polynomial. Comparing the two graphs, Luewan’s data showed a wider band for the 5% and 95% during the third trimester for both ventricles.
Comparison of 5% and 95% Percentile Graphs for the Biventricular Outer Dimension
Biparietal Diameter
Figure 5.4 compares the end-diastolic biventricular outer dimension between DeVore et al.2 and Luewan et al.5 The 5% and 95% percentile graphs are wider in the third trimester when polynomial regression is used (Luewan et al.5) compared with linear regression (DeVore et al.2). Both DeVore et al.2 and Luewan et al.5 obtained the measurements of the ventricles at the level of the opening and closing of the mitral and tricuspid valve leaflets (Fig. 5.1).
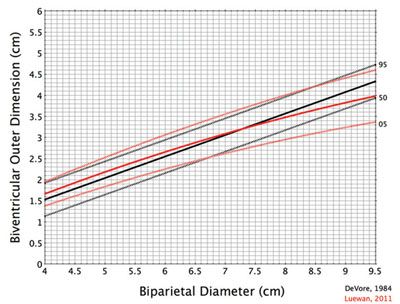
FIGURE 5.4: Comparison of the mean, 95% and 5% for the biventricular outer dimension between studies by DeVore14 and Luewan.5 DeVore found that the best fit for the regression analysis was linear, while Luewan found that it was a second-order polynomial. Comparing the two graphs, Luewan’s data showed a wider band for the 5% and 95% during the third trimester.
Comparison of 5% and 95% Percentile Graphs for the Right and Left Ventricular and Interventricular Wall Thickness
Biparietal Diameter
Figure 5.5 compares the end-diastolic wall and interventricular wall thickness between DeVore et al.2 and Luewan et al.5 The 5% and 95% percentile graphs are narrower in the second and third trimesters when polynomial regression is used (Luewan5) compared with linear regression (DeVore et al.2). Both DeVore et al.2 and Luewan et al.5 obtained the measurements of the ventricles at the level of the opening and closing of the mitral and tricuspid valve leaflets (Fig. 5.1).
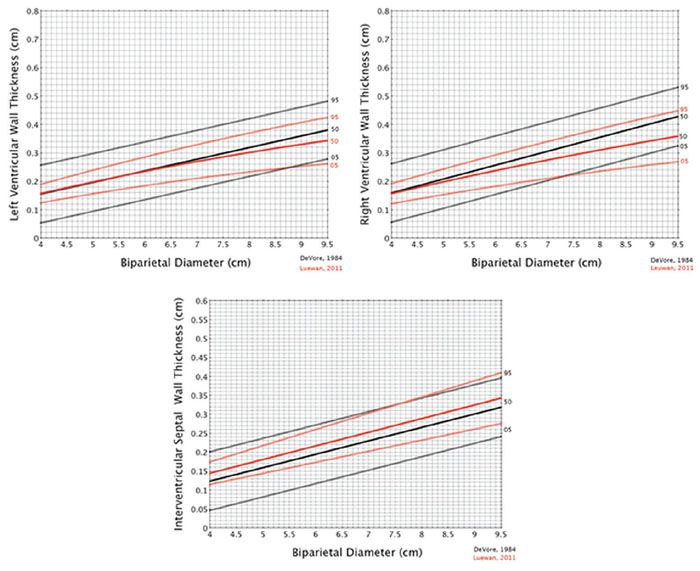
FIGURE 5.5: Comparison of the mean, 95% and 5% for the ventricular walls and interventricular septum between studies by DeVore6 and Luewan.13 DeVore found that the best fit for the regression analysis was linear, while Luewan found that it was a second-order polynomial. Comparing the two graphs, Luewan’s data showed a narrower band for the 5% and 95% throughout pregnancy.
Comparison of 5% and 95% Percentile Graphs for Ventricular Ejection Fraction
Biparietal Diameter
Figure 5.6 compares the ventricular fractional shortening ([diastolic dimension-systolic dimension]/diastolic dimension) between DeVore et al.2 and Luewan et al.5 Both studies found the best fit was using linear regression. Comparing the two graphs, Luewan’s et al.5 data showed a narrower band for the 5% and 95% for the right ventricle, but similar percentiles for the left ventricle. Both DeVore et al.2 and Luewan et al.5 obtained the measurements of the ventricles at the level of the opening and closing of the mitral and tricuspid valve leaflets.
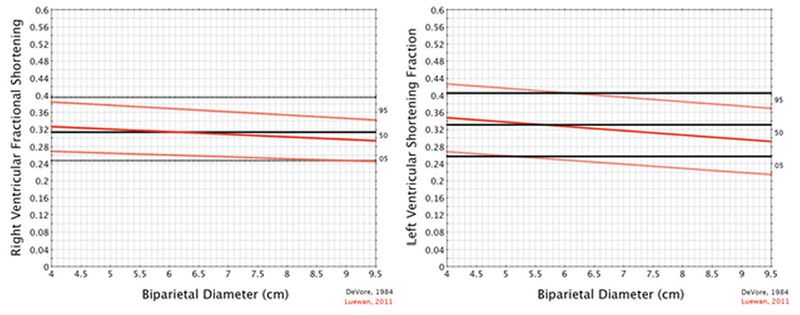
FIGURE 5.6: Comparison of the mean, 95% and 5% for the shortening fraction between studies by DeVore6 and Luewan.13 Both studies found the best fit was using linear regression. Comparing the two graphs, Luewan’s data showed a narrower band for the 5% and 95% for the right ventricle, but similar confidence intervals for the left ventricle.
Comparison of 5% and 95% Percentile Graphs for a Fetus with a Dilated Right Ventricle
Figure 5.7 is an M-mode from a fetus with a dilated right ventricle. In the normal fetus, the excursion of the tricuspid valve leaflet touches the right ventricular wall as the leaflets open at the beginning of diastole. When the right ventricle is dilated, the tricuspid valve leaflet opens but does not touch the lateral right ventricular wall, revealing a space between the full extension of the valve leaflet and the right ventricular wall. From this tracing, the right and left ventricular inner dimension was plotted against gestational age and biparietal diameter1,2,5 (Fig. 5.8). The right ventricular inner dimension was at the 95% using the data from DeVore et al.,2 but normal for Luewan et al.5 The fractional shortening of the right ventricle was 0.238, below the 5% for both DeVore et al.2 and Luewan et al.5 The left ventricular inner dimension was normal for both DeVore et al.2 and Luewan et al.,5 as was the fractional shortening (0.394).
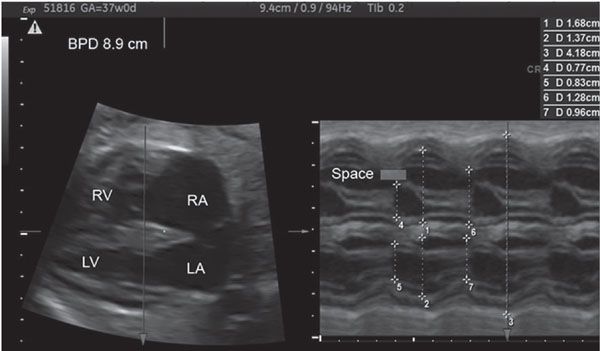
FIGURE 5.7: This is an M-mode recording from a fetus with a dilated right ventricle as manifest by the space between the tricuspid valve excursion and the right lateral wall. The white bar on the M-mode tracing demonstrates this space. The M-mode measurements are listed from numbers 1 to 7 and correspond as follows: 1, right ventricular inner dimension-diastole; 2, left ventricular inner dimension-diastole; 3, biventricular outer dimension-diastole; 4, tricuspid valve excursion; 5, mitral valve excursion; 6, right ventricular inner dimension-systole; 7, left ventricular inner dimension-systole. Fractional shortening = (RVID Diastole − RVID Systole)/RVID Diastole = (Measurement 1 − Measurement 6)/Measurement 1 = (1.68 − 1.28)/1.68 = 0.238.
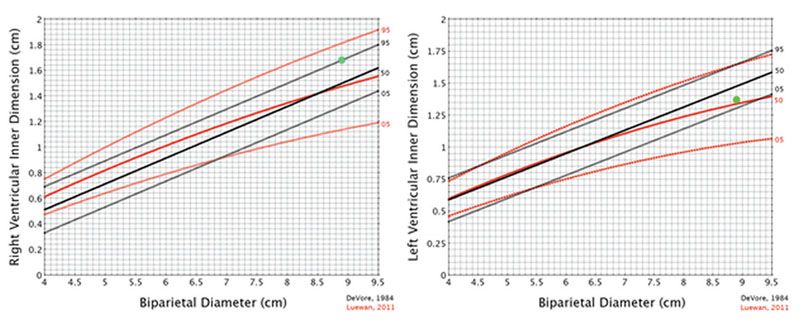
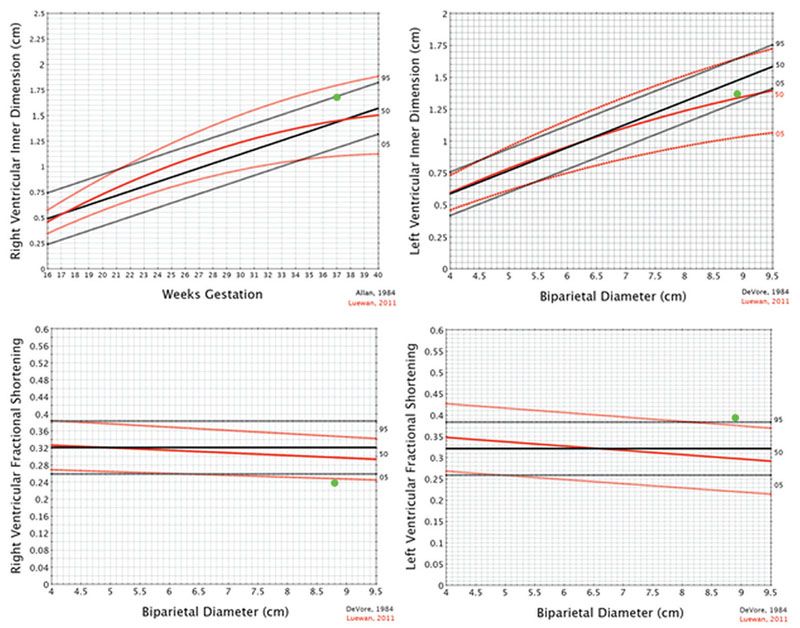
FIGURE 5.8: The case illustrated in Figure 5.7 demonstrates measurement of the right ventricular inner dimension to be at the 95% for DeVore, but in the normal range for Luewan. Comparing weeks of gestation, Allan demonstrated the right ventricular inner dimension to be at the 95%, while Luewan showed that it was in the upper range of normal. The left ventricular inner dimension is normal for DeVore, Allan, and Luewan. The fractional shortening of the right ventricle is decreased for both DeVore and Luewan. It is increased for the left ventricle for Luewan but not for DeVore.
M-Mode Graphs For Evaluating Ventricular Size and Function
From a practical perspective, the reader often desires to use graphs or tables that have been published for clinical purposes. For this chapter, I have created graphs that display the 1st, 5th, 50th, 95th, and 99th percentiles for each of the measurements reported in the literature.1–5 The raw data used to create the graphs were derived from regression equations published by the authors.1–5 From the standard deviations, the percentiles were computed for each measurement using the concepts described in Tables 5.4 and 5.5. The x and y axes for each measurement have been normalized between the various authors for consistency.
End-Diastolic Biventricular Outer Dimension (BVOD)
When cardiomegaly is suspected, the BVOD can be useful to quantitate the overall size of the heart. Depending upon the underlying pathology, the user can select the biparietal diameter, head circumference, femur length, or gestational age (Fig. 5.9). For example, if a fetus is brachycephalic and has a short femur, the examiner may select the head circumference or weeks’ gestation as a reference standard to evaluate the size of the heart other than say the femur length
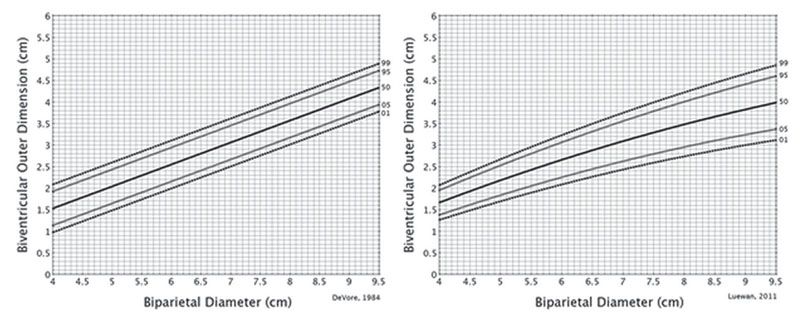
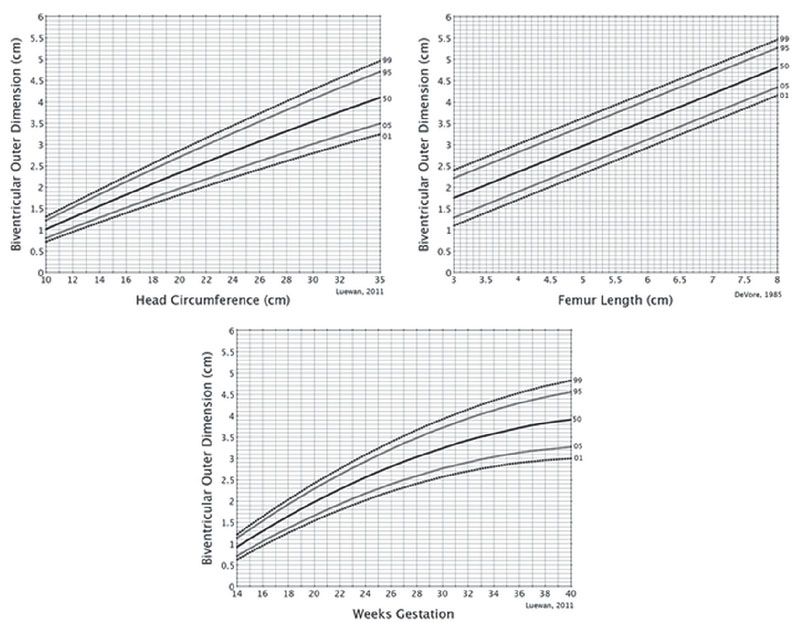
FIGURE 5.9: These graphs demonstrate the 1st, 5th, 50th, 95th, and 99th percentiles for the end-diastolic biventricular outer dimension for the biparietal diameter, head circumference, femur length, and weeks of gestation.
End-Diastolic Left Ventricular Inner Dimension (LVID)
An enlarged left ventricle is observed in early critical aortic stenosis in which the left ventricle is poorly contractile. The LVID is decreased in size in fetuses with coarctation of the aorta, as well as those with varying degrees of the hypoplastic left heart syndrome. Figure 5.10 lists the LVID graphs reference to the biparietal diameter, head circumference, femur length, and gestational age.
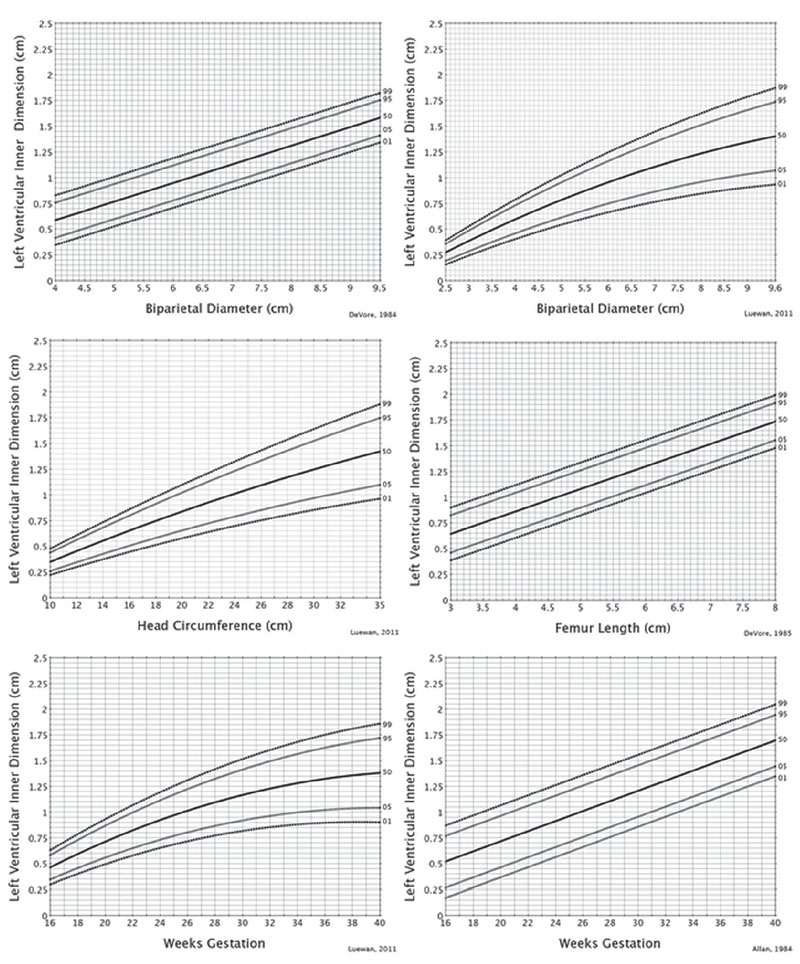
FIGURE 5.10: These graphs demonstrate the 1st, 5th, 50th, 95th, and 99th percentiles for the end-diastolic left ventricular inner dimension refer to the biparietal diameter, head circumference, femur length, and weeks of gestation.
End-Diastolic Right Ventricular Inner Dimension (RVID)
An enlarged right ventricle is the most common finding I observe when evaluating the fetal heart. It can be present with intrauterine growth restriction, postterm pregnancies, coarctation of the aorta, and other fetal conditions that result in either volume loading of the right ventricle and/or increased pulmonary vascular resistance.18–20 Figure 5.11 lists the RVID graphs for the biparietal diameter, head circumference, femur length, and gestational age.
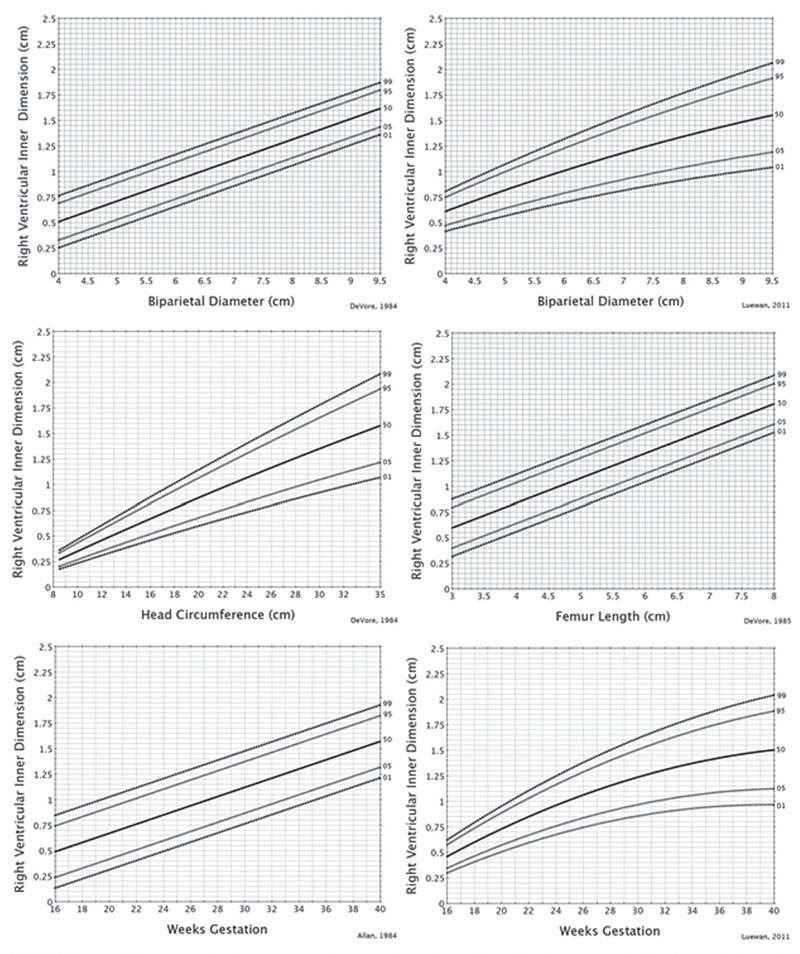
FIGURE 5.11: These graphs demonstrate the 1st, 5th, 50th, 95th, and 99th percentiles for the end-diastolic right ventricular inner dimension for the biparietal diameter, head circumference, femur length, and weeks of gestation.
End-Diastolic Right Ventricle/Left Ventricle and Left Ventricle/Right Ventricle Ratios
When disproportion between the right and left ventricular chambers is suspected, the ratio between the chambers may be useful in evaluating cardiac function.21 Figure 5.12 lists the graphs for the RVID/LVID as well as LVID/RVID ratios for the biparietal diameter, head circumference, and gestational age.
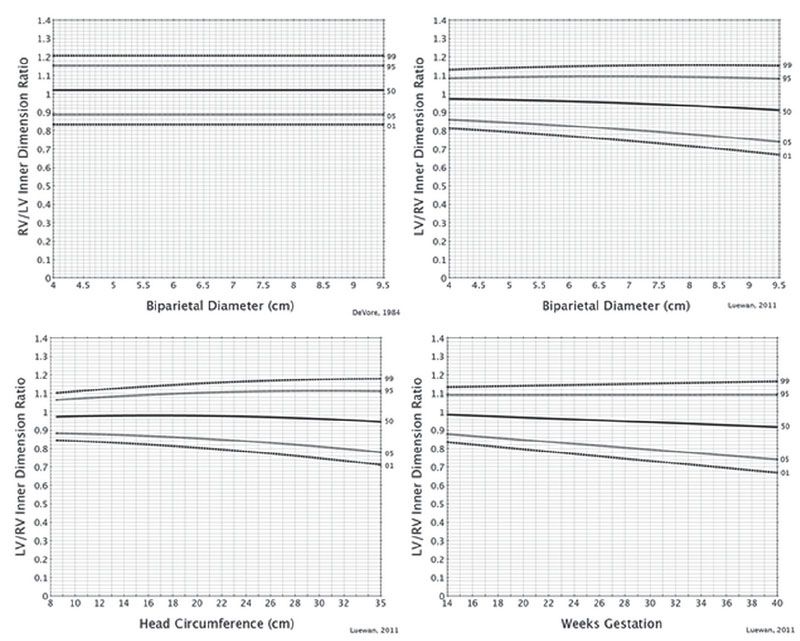
FIGURE 5.12: These graphs demonstrate the 1st, 5th, 50th, 95th, and 99th percentiles for the LVID/RVID ratios for the biparietal diameter, head circumference, femur length, and weeks of gestation.
End-Diastolic Ventricular and Interventricular Wall Thickness
Ventricular wall hypertrophy occurs as a result of primary cardiomyopathy, cardiomyopathy secondary to maternal diabetes, and fetal conditions that are associated with increased volume loading and/or increased outflow tract resistance. For the experienced examiner, a thickened wall or septum is easily visualized. However, the ability to quantify the wall thickness is important for following trends. Figure 5.13 lists the graphs for left ventricular wall thickness, Figure 5.14 for the thickness of the interventricular septum, and Figure 5.15 the thickness of the right ventricular wall.
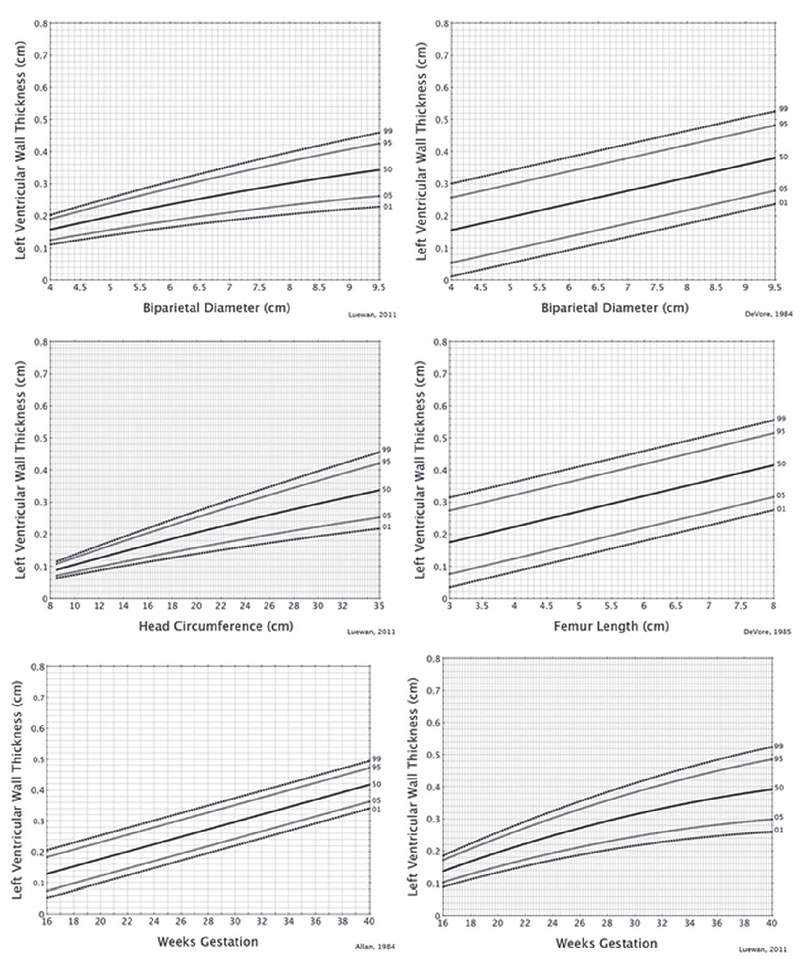
FIGURE 5.13: These graphs demonstrate the 1st, 5th, 50th, 95th, and 99th percentiles for the end-diastolic left ventricular wall thickness for the biparietal diameter, head circumference, femur length, and weeks of gestation.
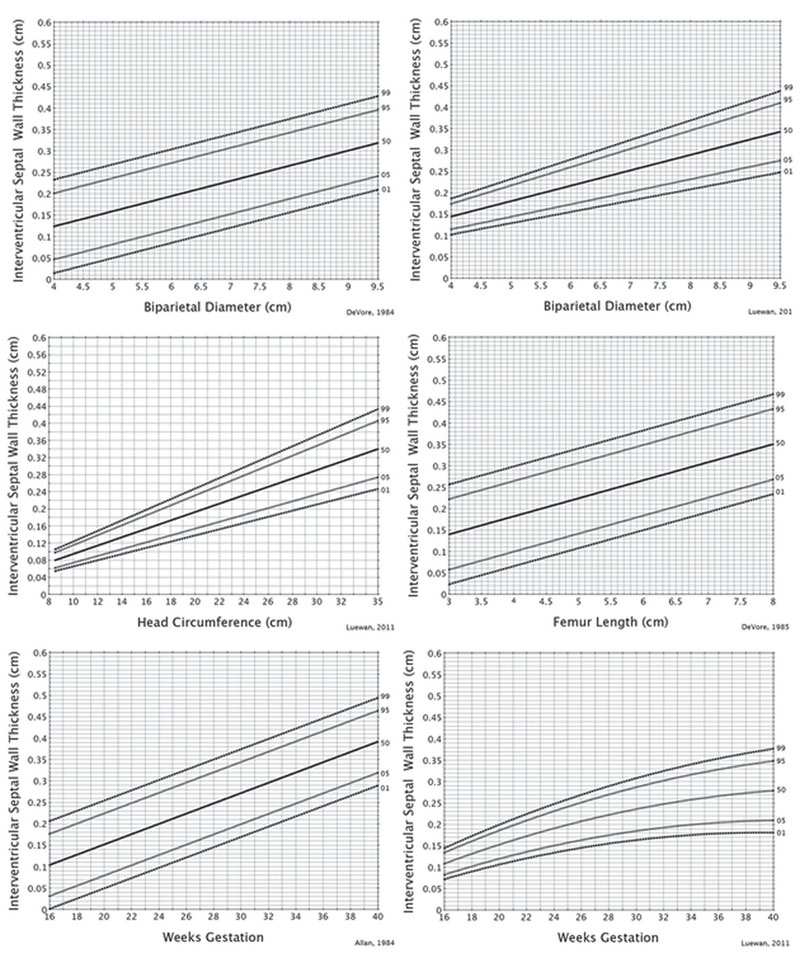
FIGURE 5.14: These graphs demonstrate the 1st, 5th, 50th, 95th, and 99th percentiles for the end-diastolic interventricular wall thickness for the biparietal diameter, head circumference, femur length, and weeks of gestation.
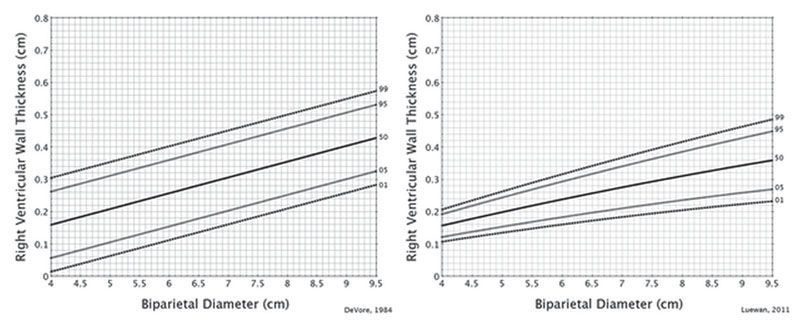
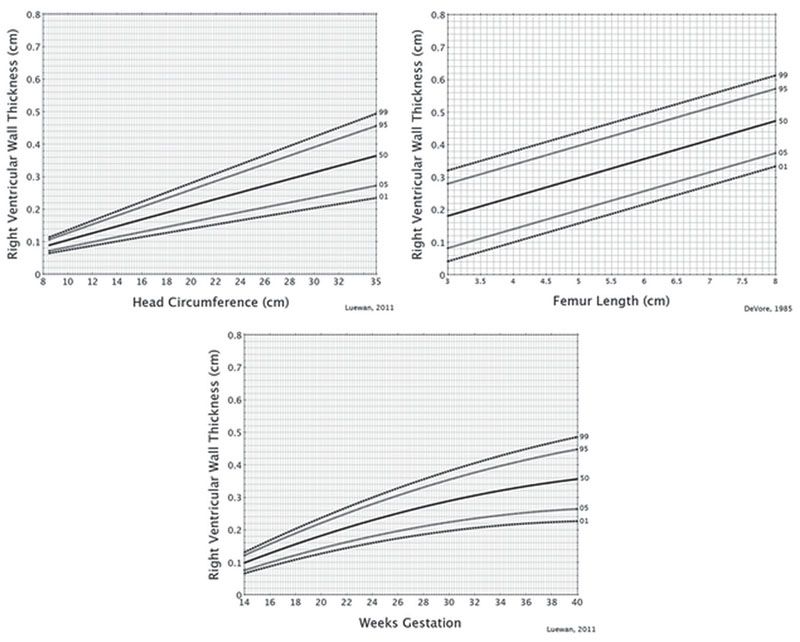
FIGURE 5.15: These graphs demonstrate the 1st, 5th, 50th, 95th, and 99th percentiles for the end-diastolic right ventricular wall thickness for the biparietal diameter, head circumference, femur length, and weeks of gestation.
Fractional Shortening
This is computed by measuring the right or left ventricular chamber dimensions at end-diastole and end-systole (Fig. 5.1). From these measurements, fractional shortening is computed as follows:
(Diastolic measurement − Systolic measurement) / Diastolic measurement
Figure 5.16 lists the graphs for right ventricular fractional shortening, and Figure 5.17 for left ventricular fractional shortening.
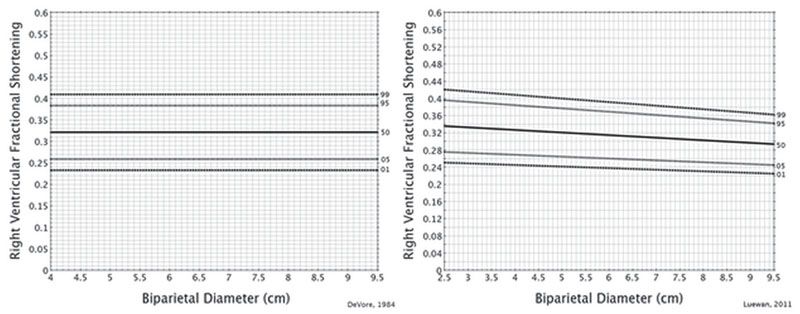
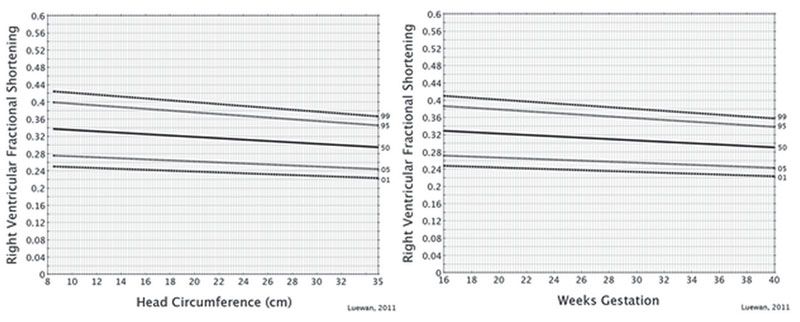
FIGURE 5.16: These graphs demonstrate the 1st, 5th, 50th, 95th, and 99th percentiles for the right ventricular fractional shortening for the biparietal diameter, head circumference, femur length, and weeks of gestation.
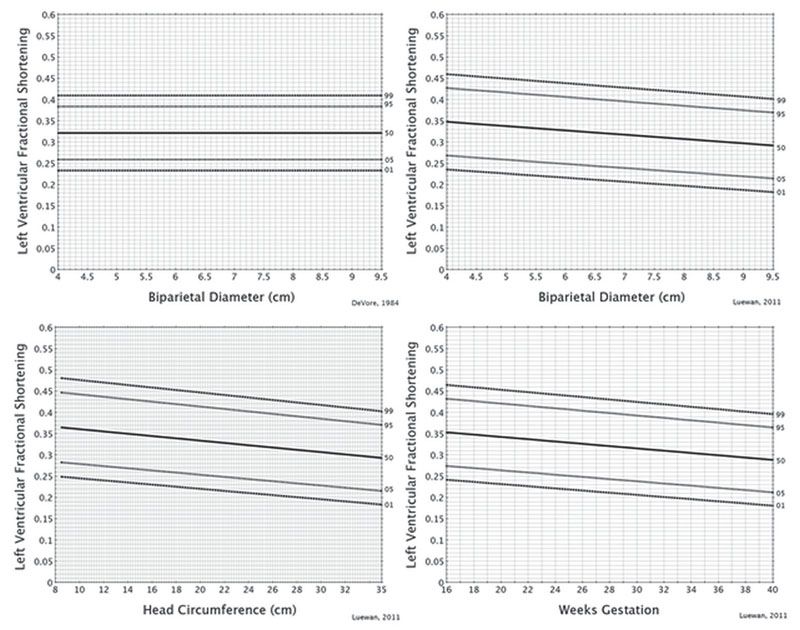
FIGURE 5.17: These graphs demonstrate the 1st, 5th, 50th, 95th, and 99th percentiles for the left ventricular fractional shortening for the biparietal diameter, head circumference, femur length, and weeks of gestation.
Opening Excursion of the Mitral and Tricuspid Valve Leaflets
The opening of these valve leaflets is useful when detecting a small left or right ventricular valve orifice. In addition, investigators have measured the Doppler inflow waveform to compute the cardiac output for the right and left ventricles. Measurement of the valve opening excursion represents the diameter of the valves from which the area can be computed. Figure 5.18 lists the graphs for the mitral and tricuspid valve opening excursion.
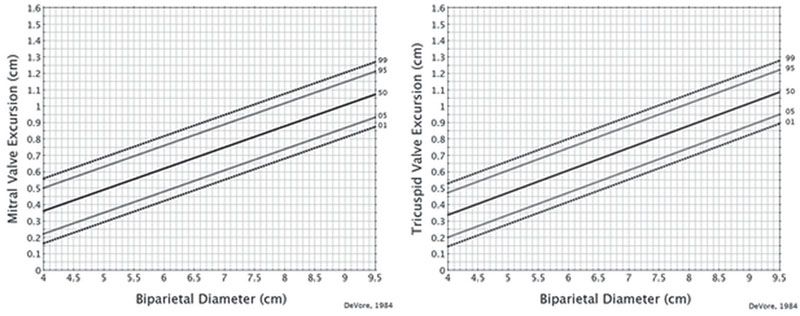
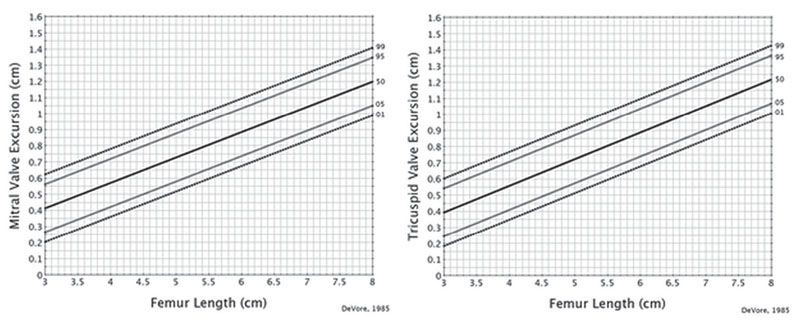
FIGURE 5.18: These graphs demonstrate the 1st, 5th, 50th, 95th, and 99th percentiles for the mitral and tricuspid valve opening excursion for the biparietal diameter and femur length.
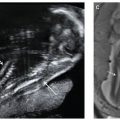
M-Mode Graphs for Evaluating the Aorta and Pulmonary Artery
Measurements of the aorta and main pulmonary artery diameter are important when computing Doppler blood flow through these vessels. Investigators reported using measurements from these vessels to detect fetuses with tetralogy of Fallot, as well as hypoplastic outflow tracts.1,4,13,14,16 Figure 5.19 illustrates the M-mode recording from the aorta and the main pulmonary artery. Figures 5.20 and 5.21 list the percentile graphs for the aorta and the main pulmonary artery.
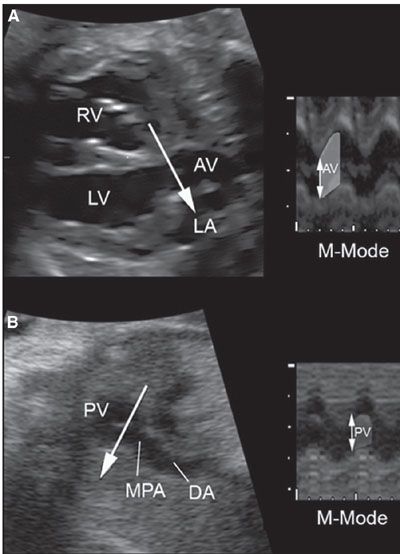
FIGURE 5.19: M-Mode recordings of the aorta and main pulmonary artery. Using traditional M-mode, the cursor is placed perpendicular to the aorta and main pulmonary artery at the level of the aortic valve (AV) and the pulmonary valve (PV). When the M-mode is obtained from a STIC volume, the M-mode line can be drawn through the aorta and main pulmonary artery (MPA) at the level of the valves. RV, right ventricle; LV, left ventricle; LA, left atrium.
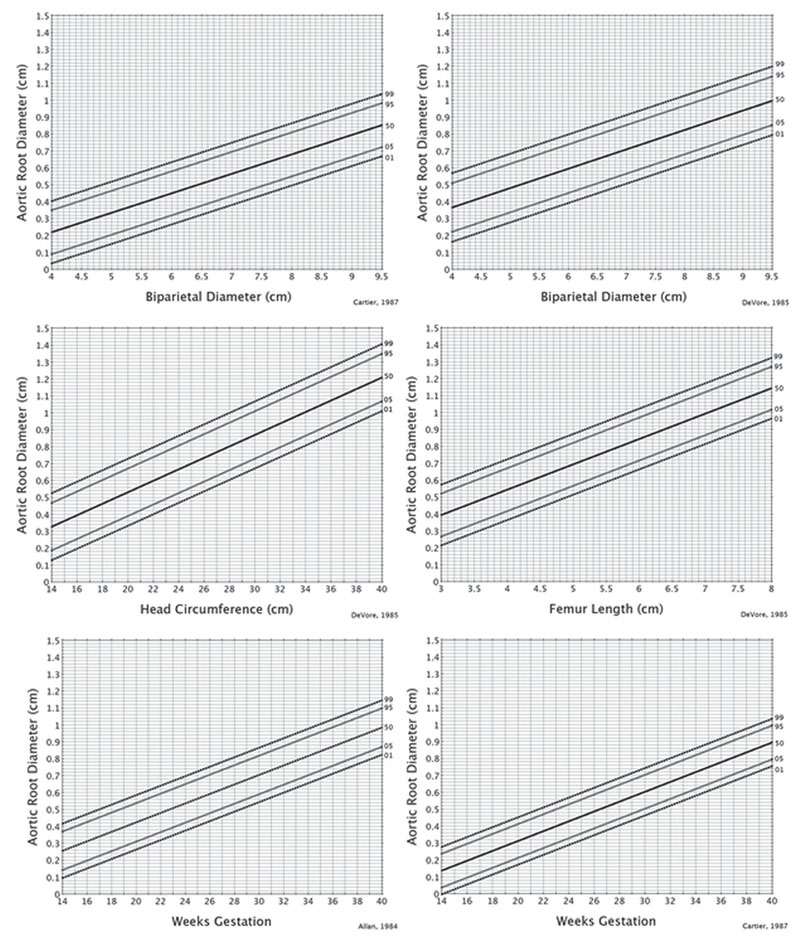
FIGURE 5.20: These graphs demonstrate the 1st, 5th, 50th, 95th, and 99th percentiles for aortic root diameter obtained at the level of the opening of the aortic valve for the biparietal diameter, head circumference, femur length, and weeks of gestation.
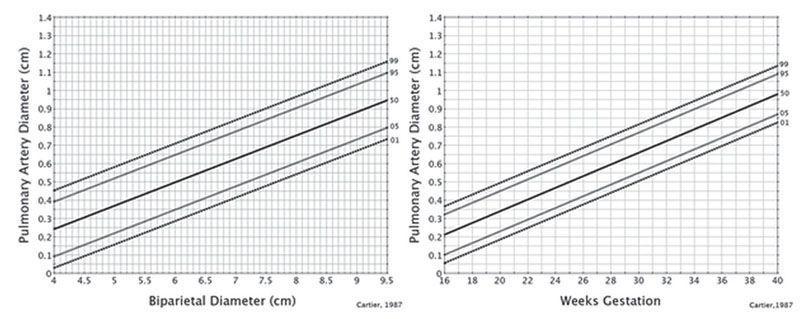
FIGURE 5.21: These graphs demonstrate the 1st, 5th, 50th, 95th, and 99th percentiles for the main pulmonary artery diameter obtained at the level of the opening of the pulmonary valve for the biparietal diameter, and weeks of gestation.
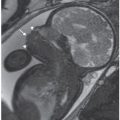
B-Mode Quantitation of Fetal Cardiac Structures
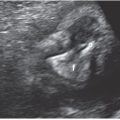
B-mode ultrasound has an advantage over M-mode in that measurements of cardiac structures do not have to be aligned perpendicular to the specific structure to be measured. Therefore, B-mode measurements of chamber and outflow tracts can be more easily obtained. The limitation is that the timing at end-diastole or end-systole may be more difficult because the examiner has to scroll through the cine loop to find the exact phase of the cardiac cycle from which to make the measurement. Figure 5.22 illustrates examples of B-mode images and where specific measurements are made.
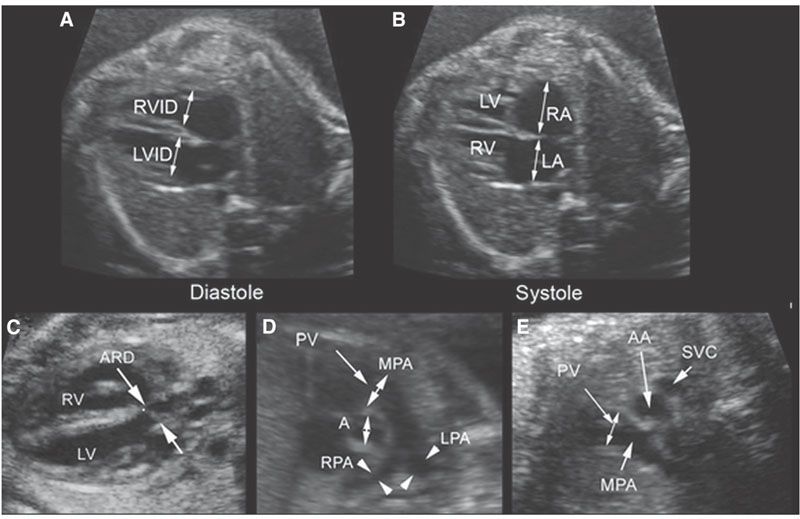
FIGURE 5.22: B-Mode Images of Measurements. A: The right and left ventricular inner dimensions (RVID, LVID) are measured at end-ventricular systole. B: The right and left atrial dimensions (RA, LA) are measured at end-ventricular systole. The aorta and main pulmonary artery (MPA) dimensions are measured at the level of the aortic valve (A). C: Measurement of the aortic diameter (ARD) from the left ventricular outflow tract view. D: The measurement of the aorta and main pulmonary artery from the short-axis view. E: Measurement of the main pulmonary artery at the level of the PV from the three-vessel view. LV, left ventricle; RV, right ventricle; RPA, right pulmonary aretery; LPA, left pulmonary artery; AA, ascending aorta; SVC, superior vena cava.
B-Mode Percentile Graphs for Evaluating the Size of the Ventricular and Outflow Tracts Using Gestational Age
In 1992, Sharland and Allan8 reported measuring ventricular chamber dimensions and the diameters of the outflow tracts from still frames of B-mode images of the heart (Table 5.7). They reported that quadratic polynomial regression equations best described the distribution of cardiac measurements and provided a graphical display of the mean and 95th percentile for each measurement as a function of gestational age.8 When I compared the graphical display of the percentiles with the published equations and computed the intervals, they were not the same. Therefore, I have not used their data in this chapter.
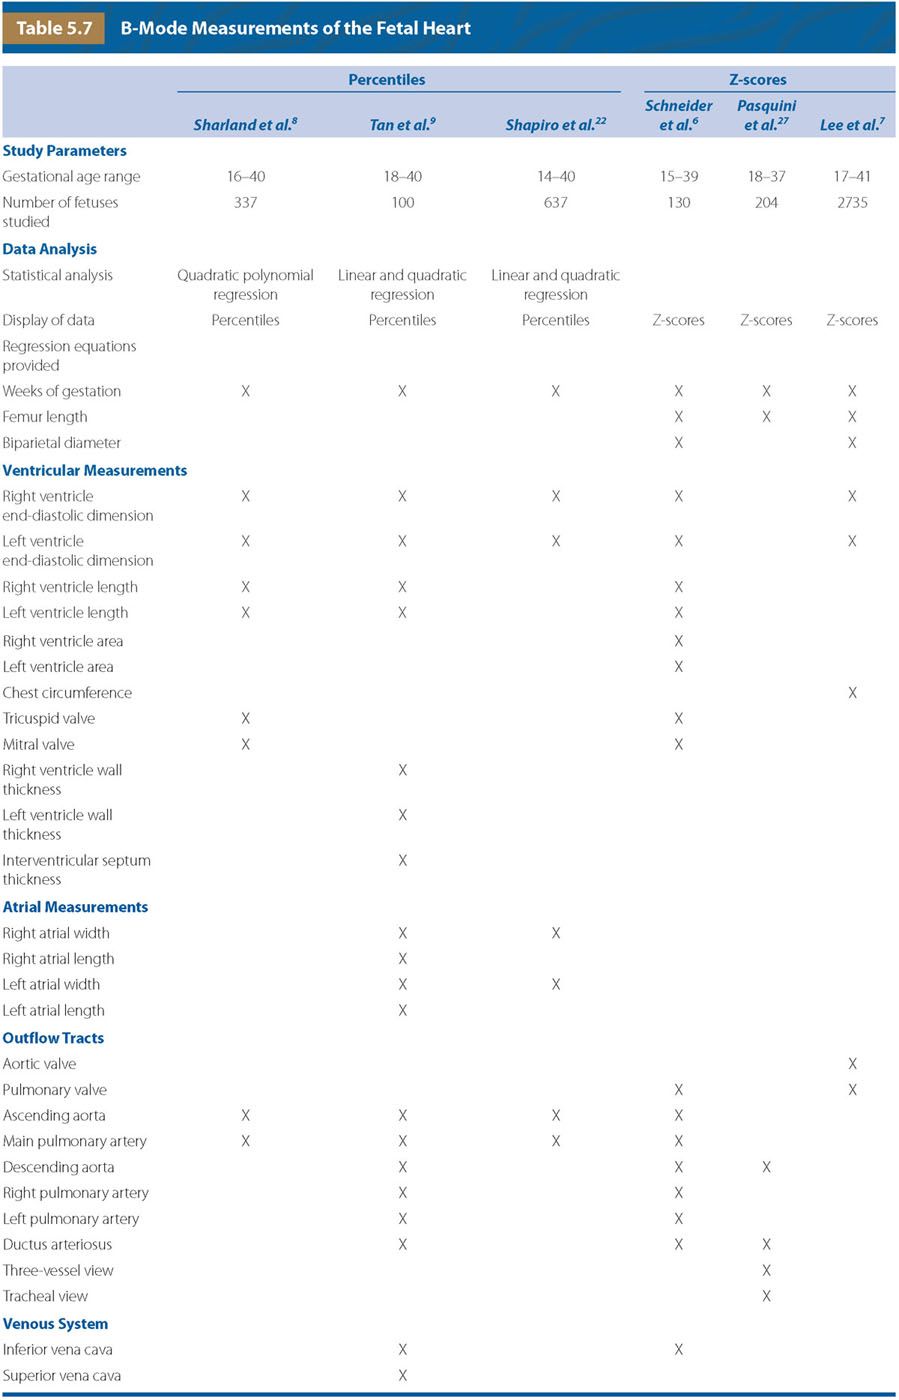
In the same year, Tan et al.9 reported results from their study that included more measurements than Sharland and Allan, and found that linear and quadratic regression equations best fit their data (Table 5.7). They computed the mean and standard error of the estimate, using gestational age as the independent variable.9
In 1998, Shapiro et al. studied a larger number of patients than those from the two previous studies but measured fewer cardiac structures (Table 5.7).8,9,22 Shapiro et al.22 also reported that linear and quadratic polynomial equations best described their dataset and provided regression equations for the 95% confidence intervals. This resulted in narrower distribution bands for the confidence intervals earlier in pregnancy when compared with later in pregnancy and used gestational age as the independent variable.22 In 2001, Firpo et al.23 expanded on the dataset of Tan et al.9 However, when I compared the graphical analysis and the corresponding regression equations provided in this study, I found several errors that were confirmed by the authors (personal communication). Therefore, this dataset should not be used until the errors have been corrected.
While the previous studies by Tan et al.9 and Shapiro et al.22 are important contributions to our understanding of the growth of fetal cardiac structures from B-mode measurements, their use has the limitation that their data were described for only gestational age. This is important because gestational age does not take into account variations in fetal size for a given gestational age. For example, a fetus at 34 weeks could be normal, macrocosmic, or have intrauterine growth restriction. Therefore, using gestational age to compare cardiac dimensions could erroneously suggest pathology when none is present. For this reason, one should use these data only if the fetus is of normal growth for gestational age. Figures 5.23 to 5.26 lists the graphs for gestational age for the right ventricular inner dimension, left ventricular inner dimension, aortic root diameter, and the pulmonary root diameter.
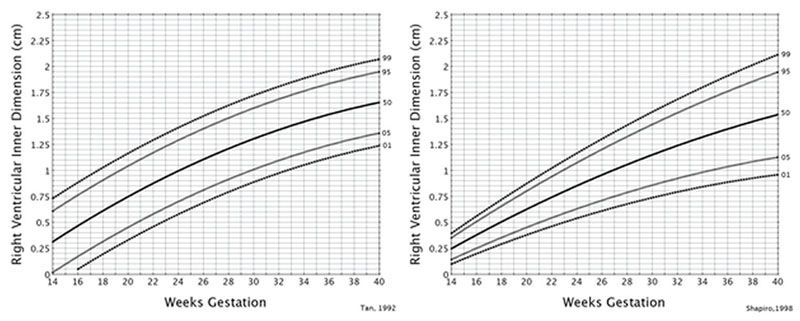
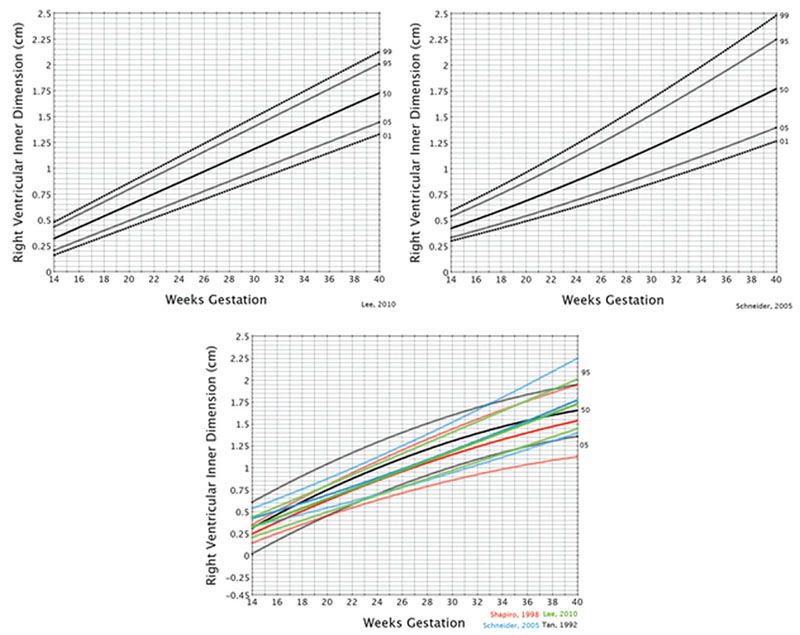
FIGURE 5.23: Weeks of gestation. Measurement of the end-diastolic right ventricular inner dimension. These graphs demonstrate the 1st, 5th, 50th, 95th, and 99th percentiles obtained at the level of the four-chamber view. The bottom graph illustrates the 5th, 50th, and 95th percentiles for the curves from Tan,9 Shapiro,22 Schneider,6 and Lee.7
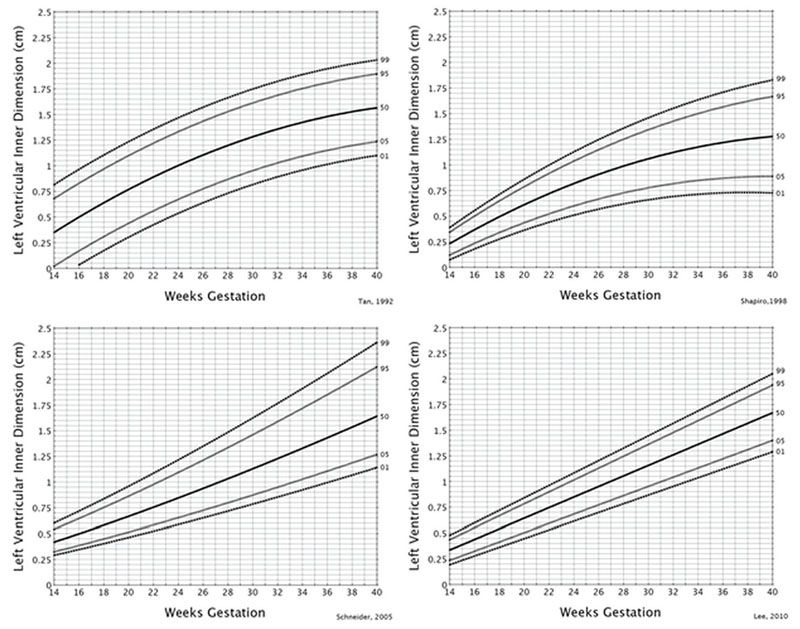
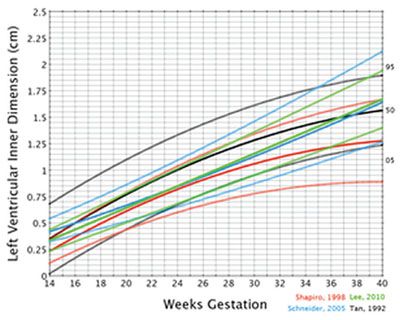
FIGURE 5.24: Weeks of gestation. Measurement of the end-diastolic left ventricular inner dimension. The upper four graphs demonstrate the 1st, 5th, 50th, 95th, and 99th percentiles obtained at the level of the four-chamber view. The bottom graph illustrates the 5th, 50th, and 95th percentiles for the curves from Tan, Shapiro, Schneider, and Lee.
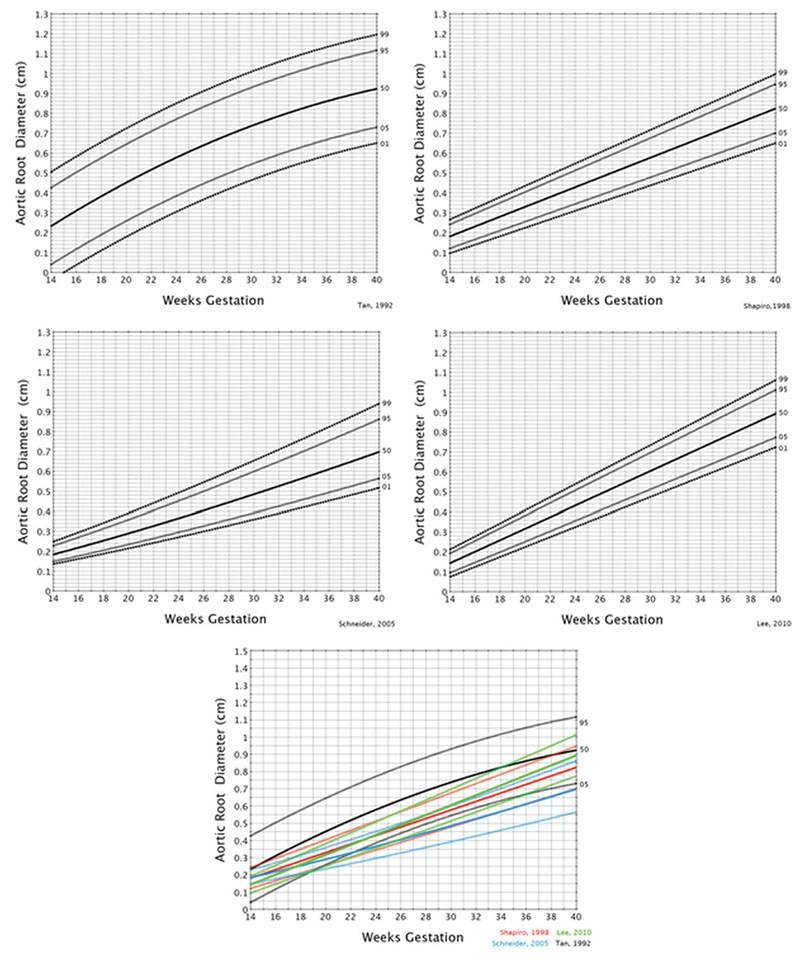
FIGURE 5.25: Weeks of gestation. Measurement of the aortic root diameter at the level of the valve. These graphs demonstrate the 1st, 5th, 50th, 95th, and 99th percentiles. The bottom graph illustrates the 5th, 50th, and 95th percentiles for the curves from Tan, Shapiro, Schneider, and Lee.
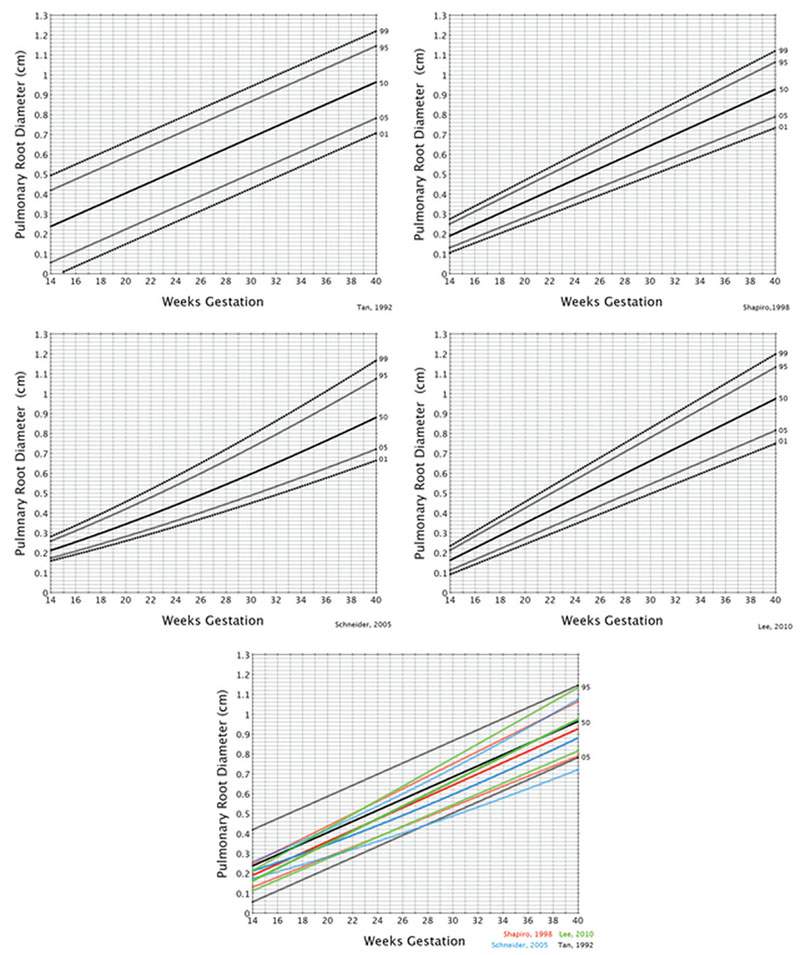
FIGURE 5.26: Weeks of gestation. Measurement of the pulmonary root diameter at the level of the valve. These graphs demonstrate the 1st, 5th, 50th, 95th, and 99th percentiles. The bottom graph illustrates the 5th, 50th, and 95th percentiles for the curves from Tan, Shapiro, Schneider, and Lee.
Z-Scores
Recent papers have focused on converting cardiac measurements to Z-scores, which are simply a measurement of the standard deviation.6,7,24 For example, a Z-score of 3 is equal to 3 standard deviations above the mean, while a Z-score of −3 is equal to 3 standard deviations below the mean. Using this technique allows the examiner to report measurements that are above or below the 1st and 99th percentiles in a quantitative manner.8,9,22 The reason that this is important is that once a particular measurement extends above or below these percentiles, a precise measurement of a cardiac structure is preferable so that trends in growth can more accurately be followed.
In 2005, Schneider et al.6 published results from a large study in which they computed Z-scores as a function of the biparietal diameter, femur length, and gestational age (Table 5.7). Although Schneider et al. provided the raw data for computation of individual Z-scores as well as a graphical display of Z-scores in their paper and supplementary material on the journal’s website, this was inconvenient for some to compute, especially if a computer reporting system is used. At the time of the publication, a companion opinion paper was also published.25 Because of the difficulty for the average clinician to compute Z-scores, I provided an Excel spreadsheet based upon their data that made the computations easier to obtain (Fig. 5.27).25 Since the publication of these papers, a number of investigators have reported using these data in the cardiac evaluation of fetuses with different pathologies.7,26–51
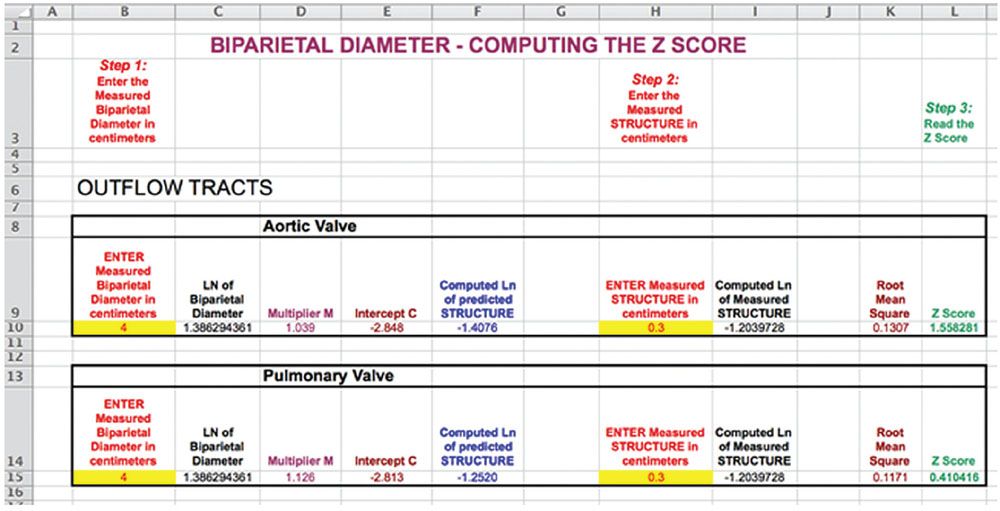
FIGURE 5.27: This is from the Microsoft Excel spreadsheet that can be downloaded from http://onlinelibrary.wiley.com/doi/10.1002/uog.2605/suppinfo. To view the computed Z-score, the user enters the biometric measurement (Step 1) and the measured cardiac structure (Step 2) and then reads the Z-score (Step 3).25
In 2010, Lee et al.7 published a Z-score paper based on a larger database, but fewer cardiac measurements (Table 5.7). Several authors have referred to this study in recent publications.36,44,52,53
Of interest, there is no single paper that provides data for all of the measurements listed in Table 5.7.
Figure 5.28 illustrates a graphical display representing 2 standard deviations and the computed Z-score from an interactive multimedia program created for the iPad, Mac, and Windows platforms using data from Schneider et al.,6 Pasquini et al.,27 and Lee et al.7
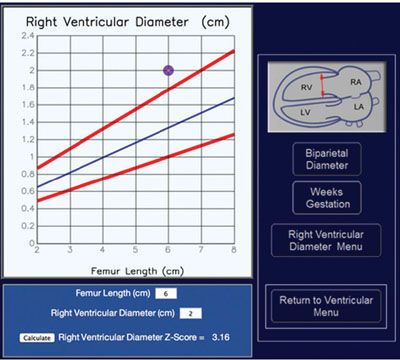
FIGURE 5.28: This is from the multimedia program entitled “Z-scores of the Fetal Heart.” The user can compute the Z-score and display the findings on a graph that shows the mean, ±2 SD. (http://www.fetalecho.com/z_score.html.)
B-Mode Percentile Graphs for Evaluating the Size of the Ventricular and Outflow Tracts Using Biparietal Diameter and Femur Length
Unlike Tan et al.9 and Shapiro et al.,22 the studies by Schneider et al.6 and Lee et al.7 also provided equations from which to compute percentile graphs based on the biparietal diameter and femur length. Figures 5.29 to 5.33 lists the graphs for gestational age for the right ventricular inner dimension, tricuspid valve opening excursion of the valve leaflets, mitral valve opening excursion of the valve leaflets, left ventricular inner dimension, aortic root diameter, and the pulmonary root diameter.
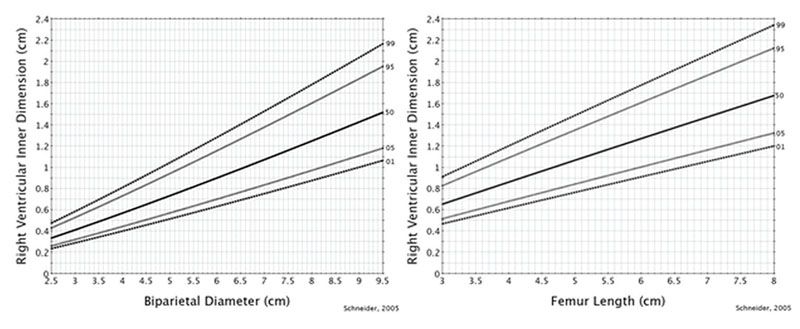
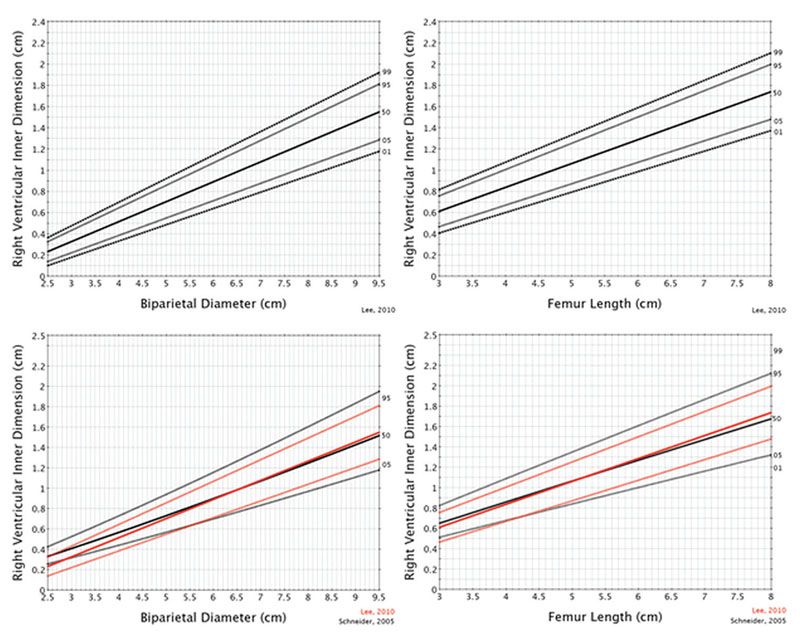
FIGURE 5.29: Biparietal diameter and femur length. Measurement of the end-diastolic right ventricular inner dimension. These graphs demonstrate the 1st, 5th, 50th, 95th, and 99th percentiles obtained at the level of the four-chamber view.
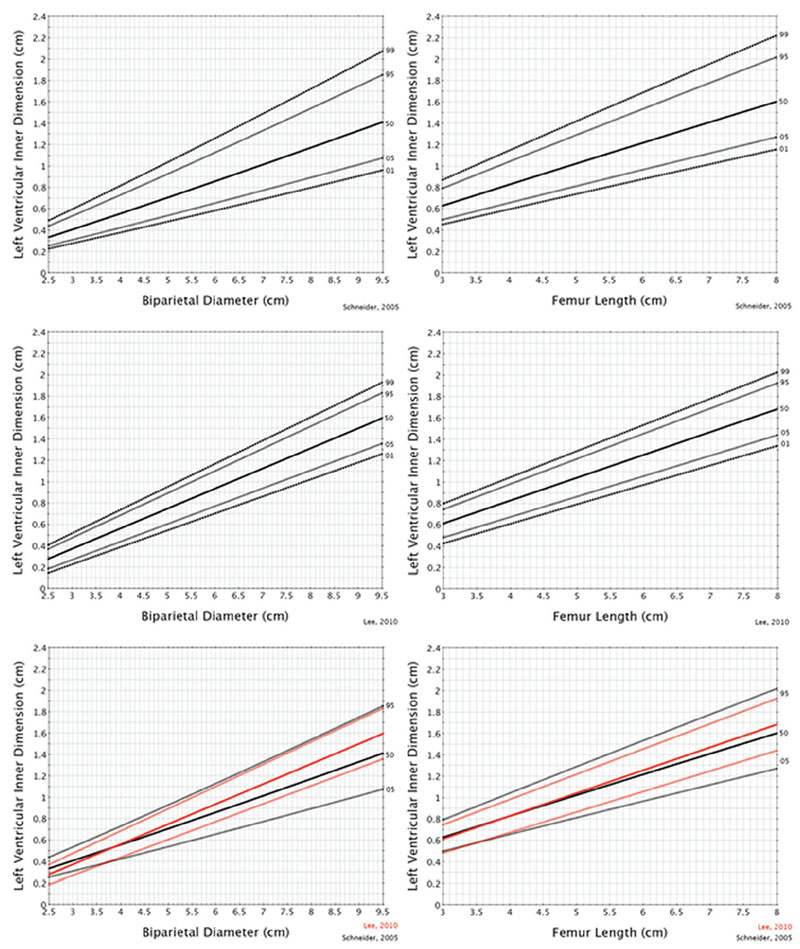
FIGURE 5.30: Biparietal diameter and femur length. Measurement of the end-diastolic left ventricular inner dimension. These graphs demonstrate the 1st, 5th, 50th, 95th, and 99th percentiles obtained at the level of the four-chamber view.
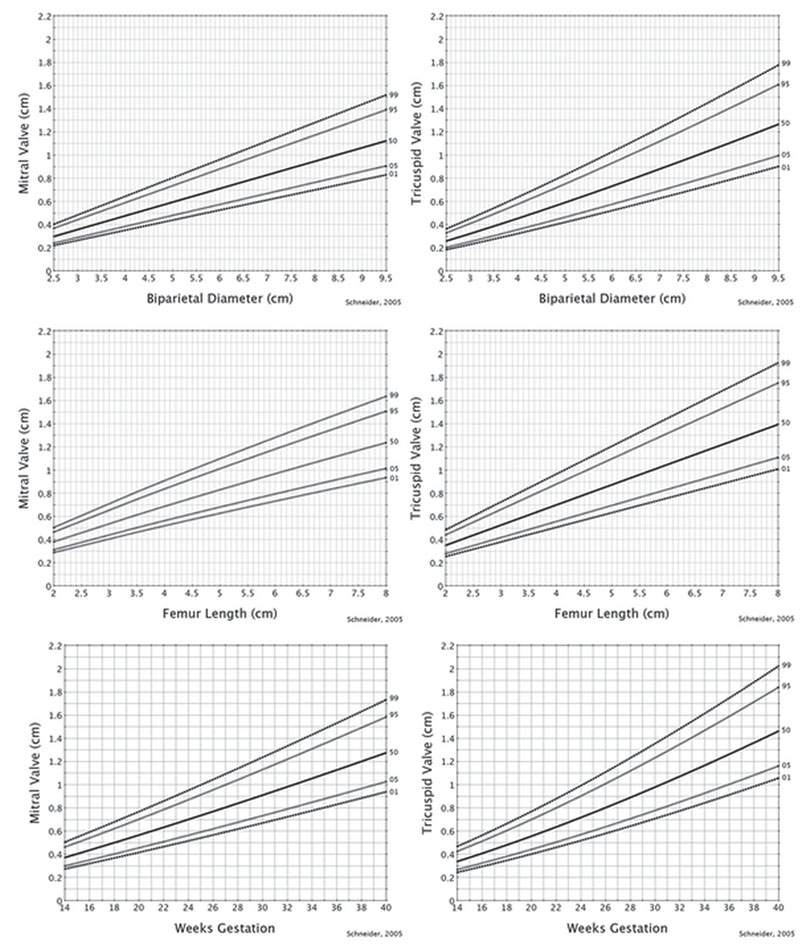
FIGURE 5.31: Biparietal diameter, femur length, and weeks of gestation. Measurement of the mitral and tricuspid valve dimension. These graphs demonstrate the 1st, 5th, 50th, 95th, and 99th percentiles obtained at the level of the four-chamber view.
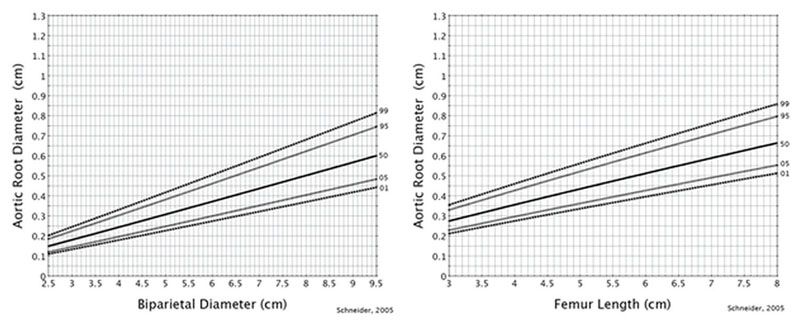
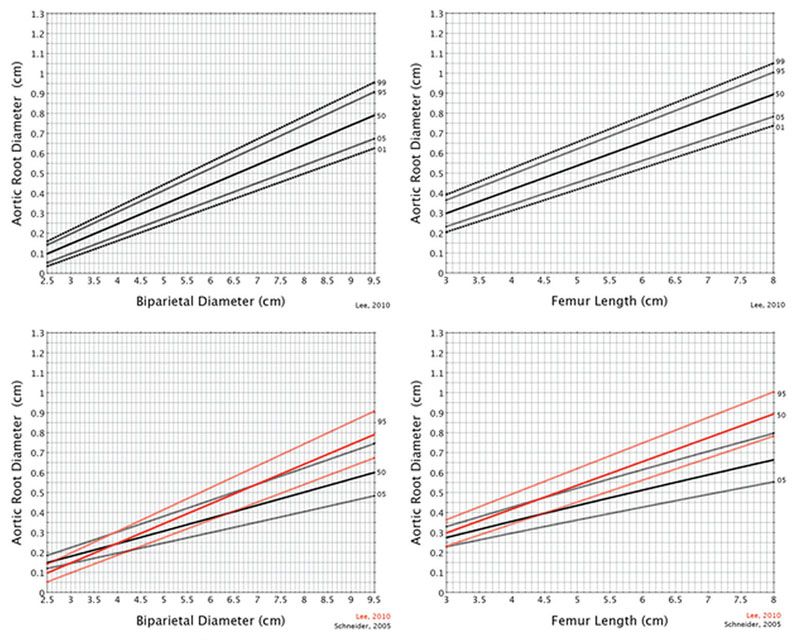
FIGURE 5.32: Biparietal diameter and femur length. Measurement of the aortic root diameter. These graphs demonstrate the 1st, 5th, 50th, 95th, and 99th percentiles obtained at the level of the four-chamber view.
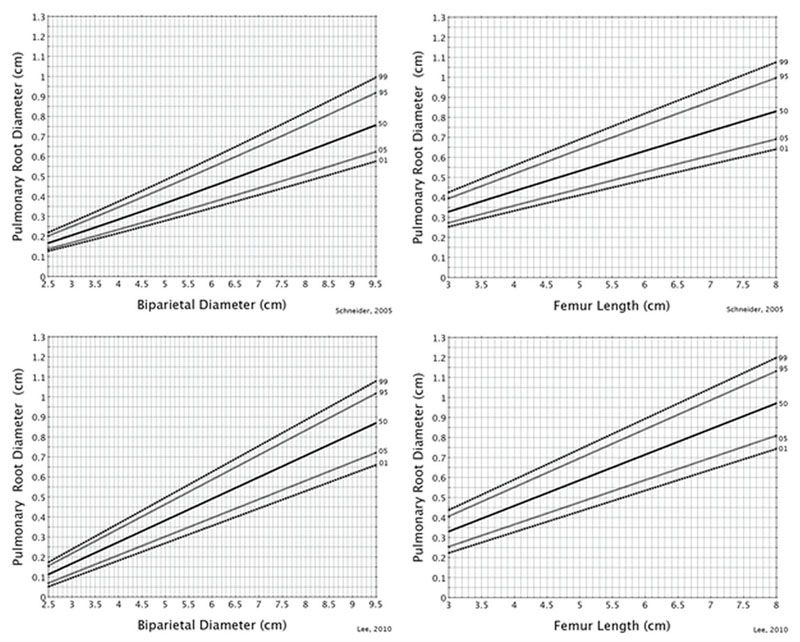
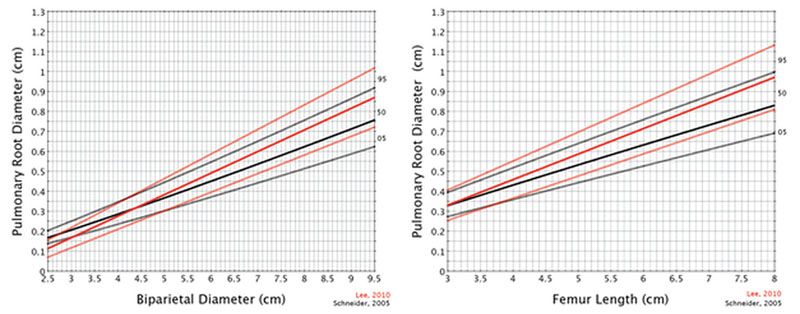
FIGURE 5.33: Biparietal diameter and femur length. Measurement of the pulmonary root diameter. These graphs demonstrate the 1st, 5th, 50th, 95th, and 99th percentiles obtained at the level of the four-chamber view.
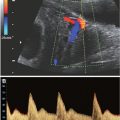
PULSED DOPPLER EXAMINATION OF THE FETAL HEART
Pulsed Doppler examination provides information regarding the direction and the characteristics of blood flow within the heart. Pulsed Doppler devices use one crystal that transmits and receives the ultrasound signal. This is performed by placing a small box that is a sample volume on the cursor that can be steered through any sector line or depth of the image (Fig. 5.34
Related posts:

Stay updated, free articles. Join our Telegram channel

Full access? Get Clinical Tree


