CHAPTER 3 Analysis of Density, Signal Intensity, and Echogenicity
RADIOGRAPHIC/CT DENSITY
Standard Against Which to Measure Density
Conventional radiography and computed tomography are based on the differential attenuation of photons by tissues as they pass from an x-ray source on one side of the body to a detector on the opposite side. Mathematically, the measurement at the detector is determined by the sum of the values of the linear attenuation coefficient, μ, of each individual tissue along the course of the x-ray beam. At each point within an object, μ characterizes the rate at which x-rays are removed by scatter or absorption and thus reflects the biophysical interaction between photons emitted by the x-ray source and the tissue irradiated. For the relatively high photon energies used in diagnostic medical imaging and low atomic numbers of most organic matter, the primary determinant of μ is Compton scatter, which results in a magnitude of photon attenuation that is nearly linearly proportional to tissue density (mass per unit volume).1 There are several additional contributors to x-ray attenuation that depend both on the x-ray source and the object being imaged, but in practice the primary basis of contrast in both radiography and CT can be considered to be tissue density.2,3
Planar projections of linear attenuation, the source of the imaging data depicted on plain films, reliably resolve only five different biologic densities: air, fat, water, soft tissue, and bone. Before the advent of tomographic imaging modalities such as CT and MRI, neuroradiologists went to great lengths to manipulate contrast in plain film radiography to make diagnoses, for example by purposefully introducing air or iodinated media into the subarachnoid space or blood vessels and thereby identify masses in the skull vault, spinal disc herniations, and intracranial aneurysms. Although important diagnoses can still be made from radiographic density abnormalities (Fig. 3-1), conventional radiographs have only limited application in modern neuroimaging and are commonly used at present for the gross evaluation of integrity of medical devices such as cerebrospinal fluid (CSF) shunts or spinal fusion hardware or in the detection of fractures or malalignment of the skull or spinal column.
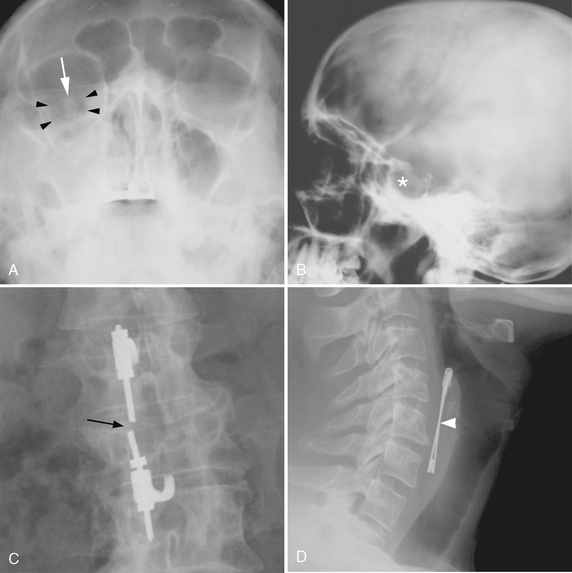
FIGURE 3-1 Diagnosis based on abnormal radiographic density. A, Facial trauma. Frontal radiograph of the face (Waters view) demonstrates low-density orbital emphysema (arrowheads) surrounding the right optic nerve (arrow) and high-density hemorrhage opacifying the right maxillary sinus. B, Calcified sellar mass. Lateral skull radiograph demonstrates enlargement of the sella turcica with ill-defined density (asterisk), suggesting the presence of a calcified pituitary tumor or craniopharyngioma. C, Hardware failure. Frontal radiograph of the lumbar spine demonstrates discontinuity (arrow) of a fusion rod that extends across a vertebral body compression fracture. D, Foreign bodies. Radiodense foreign bodies are readily seen on plain films, as in this psychiatric patient who complained of dysphagia after swallowing a safety pin (arrowhead).
Linear attenuation is a useful physical concept for understanding image formation in radiography and CT but is not directly applicable to the visual interpretation of images. Before display and storage, each pixel in a reconstructed CT image is normalized to an integer value termed the Hounsfield unit (HU) or CT number. This normalized attenuation scale arbitrarily assigns water an attenuation value of zero, such that a difference of 10 HU reflects approximately a 1% difference in linear attenuation. The maximum and minimum values of the Hounsfield scale depend on the numerical storage scheme of the manufacturer, but the range in attenuation that can be discriminated by most modern scanners is 4096 HU (from roughly −1000 HU to 3000 HU). Small numbers correspond to relatively radiolucent structures such as air and fat, and large numbers correspond to radiodense structures such as bone and calcium. There is considerable overlap between CT numbers for different tissues, but certain tissue densities can usually be distinguished based on their typical Hounsfield numbers (Table 3-1).
TABLE 3-1 Typical CT Numbers for Tissues of the CNS and Its Supporting Structures
| Air | <-1000 HU |
| Adipose tissue | −20 to −100 HU |
| Water | −20–20 HU |
| White matter | 20–35 HU |
| Gray matter | 30–40 HU |
| Muscle | 20–40 HU |
| Acute hemorrhage | 50–100 HU |
| Calcification | >150 HU |
| Bone | 800–1200 HU |
HU, Hounsfield unit.
The dynamic range of the human visual system, which can reliably discriminate fewer than 100 shades of gray, is far less than the range in tissue density represented by the Hounsfield scale. To facilitate visual analysis of images on a digital workstation, different display windows are applied to the raw CT numbers to optimally visualize the different tissues of interest. The effect of windowing is to linearly map a subsegment of the Hounsfield scale to 256 shades of gray, a standard range of gray values between black and white depicted on a computer monitor. The central Hounsfield unit of the window is designated the window level. The window width determines the overall contrast of the displayed image, translating the values of the standard Hounsfield scale within the window to various shades of gray that are more easily interpreted by the human eye. Typical window parameters used to evaluate different tissues of interest are given in Table 3-2.
The recognition of abnormal density on CT images relies foremost on familiarity with the range of normal densities of the anatomic structures of the central nervous system (CNS) and its supporting structures. Brain regions where neuronal cell bodies are located comprise the gray matter of the cortex and deep gray nuclei, including the basal ganglia and thalami. These structures normally have CT numbers of 20 to 40 HU, which is slightly greater than those of white matter (20-35 HU), where the neuronal axons and their supporting glia are concentrated. As a consequence, optimal examination of the brain parenchyma requires a narrow display window that allows accurate discrimination between the densities of these two types of tissues. Any interruption of the normally homogenous density within a discrete white or gray matter structure implies a disruption in its normal physiology. The normal brain has sharp, well-defined boundaries between gray and white matter, and any regions where this distinction is lost should be viewed with suspicion.
Alternate Nomenclature
Because the CT number of a structure may vary4 among different patients and scanners (and even in the same patient on the same scanner), it is important to interpret density abnormalities relative to an internal standard of reference. This is accomplished according to the type of tissue. The common nomenclature for describing radiodensity used in practice is as follows:
• Lesions within the brain or spinal cord parenchyma proper are described as hypoattenuating (hypodense), isoattenuating (isodense), or hyperattenuating (hyperdense) relative to normal adjacent structures.
• Soft tissue lesions outside the cranial vault or spinal column are best described in terms of their relative density with respect to muscle.
• Lesions within bone are described as sclerotic (osteoblastic) or lucent (osteolytic), depending on whether the density exceeds or is significantly less than that of normal cortical bone.
• Abnormalities that approximate the absolute density of water are characterized as CSF density or water density.
• Lesions with an attenuation consistent with fat are designated as fat density.
• A lesion is said to “enhance” when the difference in CT number between precontrast and postcontrast scans exceeds normal physiologic and technical variability between scans. For CT elsewhere in the body, this threshold has been taken as 10 HU.5
Causes of Decreased Density
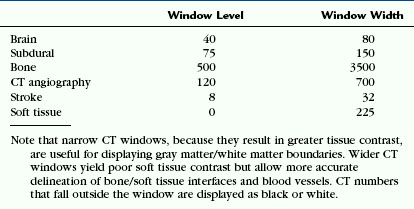
Low density on CT is the manifestation of any of the acute or chronic pathologic endpoints of disorders that cause edema, necrosis, demyelination, or infarction. When it is chronic, low density usually implies an antecedent insult to the brain. After most serious injuries, there is a loss of tissue with time that results in involution of brain parenchyma, either by direct insult or autolysis of neurons. The process of encephalomalacia affects neurons in both gray and white matter and is characterized by a regional loss of brain volume that is primarily localized to the affected neuronal pathways. The ensuing reaction of the supporting white matter cells in this setting is gliosis, the formation of a dense fibrous network of scar tissue. On the cortical surface, encephalomalacia and gliosis are commonly the result of traumatic, infectious, or ischemic injuries and can be the source of recurrent seizures (Fig. 3-2). Within the structures of the deep gray matter, toxic and metabolic insults, intraparenchymal hemorrhage, infection, demyelinating disease, and lacunar ischemia are common causes of encephalomalacia. Confluent areas of hypodensity seen on CT thus reflect the end stage of any type of brain injury and can usually be ascribed to a specific insult only in the context of appropriate clinical history or location within the brain.
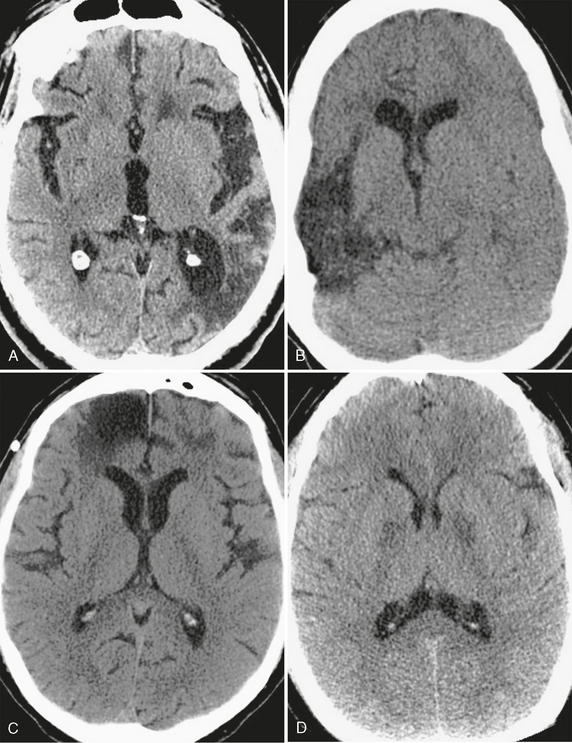
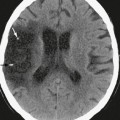
FIGURE 3-2 CT appearance of encephalomalacia. Confluent areas of low density seen in association with focal loss of brain volume representing encephalomalacia and gliosis are nonspecific, but the location of the abnormality often points to an underlying cause. A, Remote stroke. Low density with volume loss, seen as ex-vacuo dilation of the left occipital horn, conforms to the territory of the posterior left middle cerebral artery. B, Encephalomalacia involving the cortical gray matter in multiple vascular territories can be caused by meningoencephalitis, as in this case of herpes encephalitis. Note ex-vacuo dilation of the frontal horn of the right lateral ventricle. C, Bifrontal encephalomalacia is most commonly caused by direct impact of the brain against the noncompliant calvaria years after the trauma. D, Chronic and symmetric low density within the deep gray nuclei is characteristic of toxic ingestion or metabolic abnormality, as seen within the globus pallidus of this patient who had previously attempted suicide by inhalation of carbon monoxide.
Diseases that cause net changes in brain water content also give rise to confluent areas of hypodensity. In contrast to encephalomalacia, which is chronic and irreversible, most alterations in tissue water content reflect an acute disturbance in cerebral hemodynamics. Classically, cerebral edema has been categorized as cytotoxic or vasogenic.6 Cytotoxic edema occurs in both gray and white matter and is the effect of the irreversible intracellular swelling of neurons and glia that occurs with cellular energy depletion. In contradistinction, vasogenic edema predominates in the white matter and reflects the potentially reversible shifts in water within the extracellular space that are due to alterations in the normal blood-brain barrier. Both cytotoxic and vasogenic edema are seen as hypodensity and are not readily distinguished on CT in the early stages of a disease. The identification of edema should prompt a search for its potential primary causes as well as its effects, because edema may secondarily lead to herniation. Edema that involves the entirety of the brain usually reflects hypoxic, traumatic, toxic, or metabolic injury, whereas localized edema suggests either a focal ischemic insult, infection, or a mass lesion inciting changes in the surrounding brain.
Hypodensity localizing to the gray matter of the brain surface (Fig. 3-3) warrants primary consideration of traumatic, infectious, or vascular causes. For example, brain contusion results when rapid acceleration or deceleration causes the cortical surface to come into direct contact with the rigid skull vault or dural reflections. Sources of cerebral infection, such as viral encephalitis and bacterial meningitis, also commonly involve cortical gray matter, usually as the result of direct spread of infection from the subarachnoid spaces. An important infectious cause of gray matter hypodensity that should be considered in the appropriate clinical context is herpes encephalitis. Subtle cortical low attenuation, particularly within the medial temporal lobes and cingulate cortex, can herald this disease and should prompt early treatment with intravenous antiviral chemotherapy. The regions of cortical gray matter hypodensity seen with both traumatic injury and infection are due to acute cellular and interstitial edema and are not infrequently accompanied by hemorrhage and interruption of the blood-brain barrier, the latter manifest by abnormal enhancement on administration of a contrast agent.
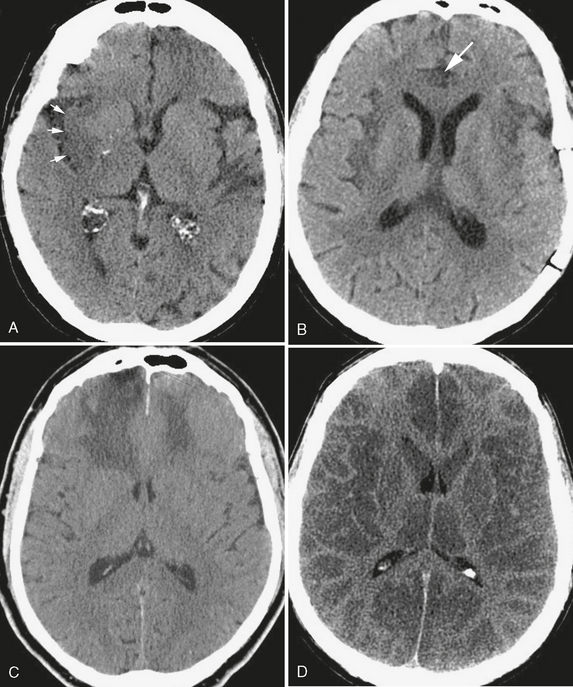
FIGURE 3-3 Cortical low density. The CT finding of cortical low density results in a loss of the normally observed interfaces between gray matter and white matter. A, Acute stroke. In this patient with acute onset of left-sided hemiplegia, effacement of the normal subinsular gray matter/white matter interface (arrows) results in the “insular ribbon sign” of acute right middle cerebral artery infarction. B, Low density of the insular cortices and right cingulate gyrus (arrow) caused by herpes encephalitis, a neurologic emergency in this patient with altered mental status and fever. C, Bifrontal cortical low density extending into the lobar white matter without volume loss, typical of an acute traumatic injury. D, Anoxic encephalopathy. Diffuse cortical low density in this patient who was found unresponsive and hypotensive, giving the false impression of white matter hyperdensity.
Acute interruption of the normal large- or small-vessel arterial supply to the brain and consequent ischemia may also yield hypodensity that involves both gray and white matter. The observation that hypodensity conforms to a vascular territory is central to this diagnosis (Fig. 3-4). In early ischemic injury, the attenuation of acutely ischemic brain parenchyma is inversely proportional to its water content. Specifically, a 1% total increase in tissue water content decreases its CT number by approximately 2.5 HU.7 Interruption in blood flow causes the highly vascular gray matter to lose the ability to control neuronal permeability. As a result, neurons accumulate water and take on an intrinsic density that approximates that of white matter. This process results in the loss of the normal distinct boundaries between the involved gray matter and subjacent subcortical white matter, as well as local gyral swelling. A similar loss of density within ischemic deep gray matter nuclei also may be recognized only as a change in the normal shape of the nucleus. Infrequently, it is possible to detect acute small-vessel ischemia as a subtle focus of relative low density within white matter. To optimally discern the subtle changes in density that are due to acute ischemia, the level and width of the display window should be selected carefully.8 With continued vessel occlusion, both gray and white matter hypodensity and swelling progressively increase and become more pronounced. With time, the infarcted brain tissue loses volume, ultimately resulting in encephalomalacia and glial scar within the involved vascular territory on follow-up imaging.
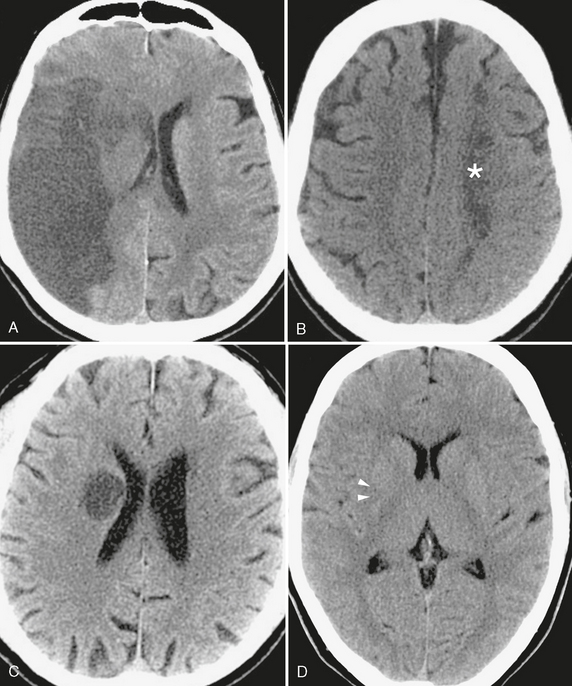
FIGURE 3-4 The manifold appearances of ischemic injury on CT. A, Subacute stroke. Cortical and white matter low density in the distribution of the right middle cerebral artery, characteristic of subacute large vessel infarct. Note the accompanying mass effect, as evidenced by effacement of right hemispheric sulci, compression of the right lateral ventricle, and slight shift of the midline toward the left. B, Low density area (asterisk) conforming to the border zone between the left middle cerebral artery and anterior cerebral artery distributions, typical of watershed infarction. C, Low density and enlargement of the globus pallidus and putamen in this patient with altered mental status due to acute lenticulostriate infarct. It is important that this not be mistaken for a tumor, which could lead to unnecessary morbidity or mortality if surgical resection is attempted. D, Occlusion of the middle cerebral artery (arrowheads), because it also involves the lateral lenticulostriate arteries, may result in the loss of the normal comma-shaped morphology of the posterior putamen. This “comma sign” is a useful early sign of ischemia on noncontrast CT images.
A number of acute and chronic disorders may produce large areas of hypodensity that are localized within the subcortical gray and white matter (Fig. 3-5). Hypodensity in these diseases selectively affects vulnerable brain tissues. For example, cardiopulmonary arrest, drug overdose, and other causes of acute global hypoxic injury preferentially injure tissues that have high metabolic demand. Early findings in this setting can be subtle on CT immediately after the insult, seen only as uniform low attenuation in white matter or effacement of normal gray-white interfaces. Confluent periventricular low density is a common finding in the aging population, where small- and medium-sized vessels supplying the deep white matter of the brain are subject to chronic occlusive disease. In acute hydrocephalus, low density CSF may accumulate within the white matter surrounding the distended ventricles, a phenomenon referred to as transependymal edema. Metabolic leukodystrophies represent a broad class of dysmyelinating disorders that characteristically lead to varying distributions of low density within the subcortical white matter and often gray matter.
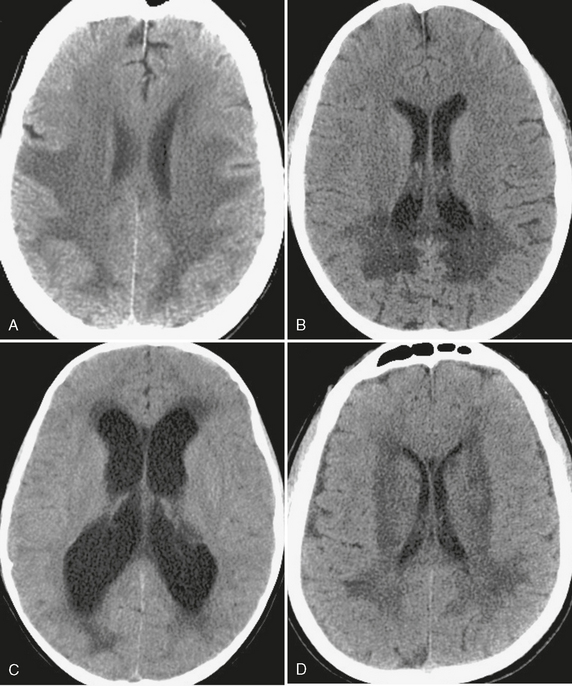
FIGURE 3-5 White matter hypodensity. The relatively common CT finding of white matter hypodensity has a broad differential diagnosis but should be distinguished from hypodensity that involves both gray and white matter. A, Global hypoxic-ischemic injury. Uniform low density within the white matter of the supratentorial brain, with involvement of the deep gray nuclei, in a patient after an episode of hemorrhagic shock due to gastrointestinal bleeding. B, X-linked adrenoleukodystrophy. In this child there is a classic distribution of low density within the white matter of the occipital lobes and splenium of the corpus callosum. C, Transependymal edema. Low density “capping” the ventricular margins, combined with ventriculomegaly, is characteristic of the interstitial white matter edema that results when CSF outflow is obstructed. D, Microvascular leukariosis. Low density in the subcortical and periventricular white matter is a common finding in the aging brain and is thought to be due to the chronic ischemic effects of small vessels “pruned” by small vessel vasculopathies such as hypertension or diabetes.
Inflammatory demyelinating diseases such as multiple sclerosis and acute disseminated encephalomyelitis and intracranial infections represent another broad class of disease that should not be overlooked as a potentially reversible causes for low attenuation (Fig. 3-6). Small areas of circumscribed low density in white matter, especially around the margins of the lateral ventricles, may suggest the diagnosis of multiple sclerosis or other autoimmune demyelinating disease given the appropriate clinical history. A cerebral abscess is a cavity that contains pus, necrotic debris, and immune cells due to bacterial, fungal, or parasitic infection that appears as a focal area of suppurative necrosis within the brain, usually with surrounding low density vasogenic edema. Progressive multifocal leukoencephalopathy, human immunodeficiency virus (HIV) encephalopathy, and infections such as those caused by Toxoplasma, cytomegalovirus, and Cryptococcus merit special consideration as causes for low density in the immunocompromised population.
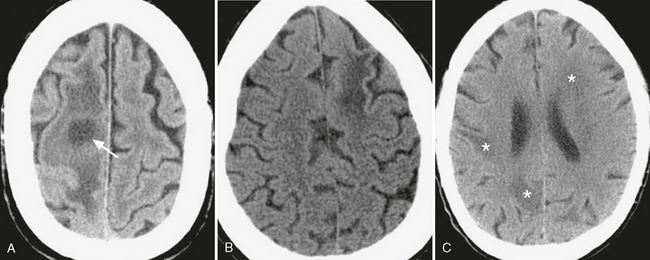
FIGURE 3-6 Low density due to cerebral inflammatory disease. A, Typical appearance of a cerebral abscess: round, low-density cavity (arrow) surrounded by low-density vasogenic edema. Differentiation from other cavitary lesions such as radionecrotic cysts or cystic neoplasms often requires clinical/laboratory correlation, with help often provided by contrast-enhanced and diffusion weighted MRI. B, Progressive multifocal leukoencephalopathy. Whereas white matter low density is nonspecific, involvement of the subcortical U-shaped fibers in the AIDS patient can help differentiate this disorder from HIV encephalitis. C, Toxoplasmosis. Patchy white matter low density (asterisks) in an immunocompromised patient with altered mental status.
Causes of Increased Density
High density on CT has a more limited differential diagnosis than low density. Specifically, high attenuation is characteristic of mineralization, blood products, iodinated contrast media, and certain neoplasms. Calcification is a feature of several primary brain tumors, including oligodendroglioma, ependymoma, and astrocytoma, as well as metastatic tumors such as renal cell carcinoma, neuroblastoma, and mucinous tumors of the gastrointestinal tract. Extra-axial tumors such as meningioma may also calcify. Calcification may be the result of prior infection, such as neurocysticercosis or tuberculosis, or may be the residua of prior hemorrhage. Tumors of high cellularity referred to as “small round blue-cell neoplasms” including lymphoma, medulloblastoma, and primitive neuroectodermal tumors may have high density relative to normal brain parenchyma (Fig. 3-7).
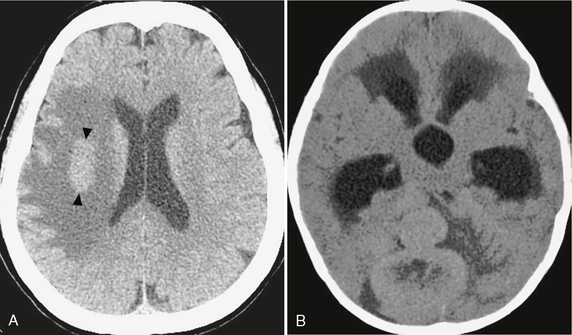
FIGURE 3-7 Tumors of high cellularity. Tumors with densely packed cells and/or high nuclear-to-cytoplasmic ratios can demonstrate intrinsic hyperdensity at CT, even in the absence of calcification or hemorrhage. A, CNS lymphoma. Unenhanced CT demonstrating a circumscribed, hyperdense mass in the right hemispheric white matter (arrowheads) with surrounding low-density vasogenic edema. B, Medulloblastoma. Unenhanced CT demonstrating a lobulated, hyperdense mass in the posterior fossa.
Hemorrhage is a common cause of high density in the brain and extra-axial spaces in the acutely ill patient. Acute blood products have characteristic CT numbers ranging from 50 to 100 HU and often exert mass effect on adjacent structures. Within the brain parenchyma proper, high density due to acute hemorrhage may be the result of trauma, hypertension, hemorrhagic primary or metastatic brain tumor, vascular malformations including arteriovenous and cavernous malformations, dural sinus thrombosis with venous ischemia, hemorrhagic infection such as from angioinvasive Aspergillus, coagulopathy, or amyloidosis. Intravenous administration of a contrast agent may allow discrimination between these causes by the observation of a primary enhancing tumor or vascular malformation or by detection of dural venous sinus occlusion.
High density confined to the lumen of an artery or vein has critical significance in that it suggests the presence of acute thrombosis. Clinical findings of acute hemiplegia, aphasia, visual field changes, or other symptoms of stroke should prompt a careful search for a hyperdense artery. Whereas this is a relatively infrequent finding seen in only approximately 22% of patients presenting with acute middle cerebral artery (MCA) stroke, it portends a poor long-term prognosis and may prompt early thrombolytic treatment.9 The cause of high attenuation within acute thrombus has been posited to arise from accumulation of erythrocytes, fibrin, and cellular debris.10 While originally described within the proximal or distal MCA, hyperdense thrombus can also be visualized within the anterior and posterior cerebral and vertebrobasilar systems (Fig. 3-8). In the absence of a leading clinical history, arterial hyperdensity may alternatively suggest atherosclerotic calcification or hemoconcentration due to dehydration or polycythemia. Within the intracranial venous system, hyperdensity may be the only finding in patients with dural venous sinus or internal cerebral venous thrombosis. In patients with headache and venous hyperdensity, contrast-enhanced CT or MRI should be obtained urgently to guide prompt treatment with anticoagulation, because venous thrombosis remains a frequently missed diagnosis that often has disastrous consequences when missed.
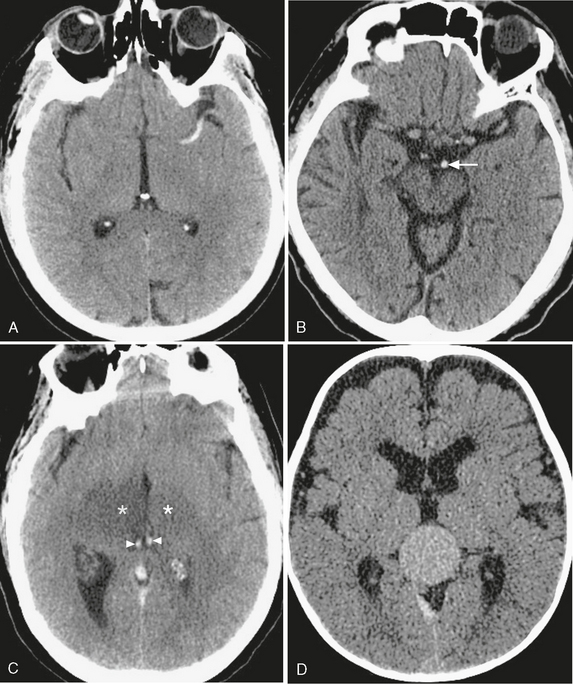
FIGURE 3-8 CT appearance of intravascular hyperdensity. A, MCA thrombosis. The “dense MCA sign” is a specific but insensitive finding in acute stroke. B, Basilar artery thrombosis. Hyperdense basilar artery (arrow); compare with patent branches of the MCA. C, Venous thrombosis. Thrombus within the internal cerebral veins (arrowheads), resulting in bilateral thalamic ischemia (asterisks). D, Vascular malformations. Relative hyperdensity in this patent vein of Galen malformation.
The normal CSF spaces of the brain have an attenuation that is nearly that of water (Fig. 3-9
Stay updated, free articles. Join our Telegram channel

Full access? Get Clinical Tree


