CHAPTER 45 Neurodegeneration: Cerebrum
Dementia is an acquired syndrome of progressive impairment of multiple cognitive domains (including memory), causing significant impairment of social and occupational functioning in the presence of normal consciousness.1 Dementia should be differentiated from acute confusional state, or delirium, in which there is a transient reversible impairment of cognitive function, usually accompanied by fluctuating levels of consciousness. Both dementia and delirium are clinical syndromes and not diagnoses per se.
Mild cognitive impairment (MCI) is a transitional stage between normal aging and dementia.2,3 Approximately 12% of MCI patients advance to frank dementia per year, with 50% doing so over the 5 years after diagnosis. Other MCI patients exhibit mild cognitive deficits that are not severe enough to warrant a diagnosis of dementia. Some of these may follow a benign course (the worried well) or prove to have reversible conditions, such as depression. Because MCI may be the early stage of a dementing illness, particularly Alzheimer’s disease, MCI would be the ideal target for any therapy to modify or prevent disease progression.
An estimated 27.7 million people suffered from dementia in 2003 worldwide, of which 38% lived in the advanced economies.4 The annual incidence of dementia is estimated to be 4.6 million cases, that is, a new case every 7 seconds, worldwide. With projected increases in life expectancy and the exponential increase of dementia with age, the prevalence of dementia is expected to double every 20 years to 81.1 million by 2040.5 Because patients with dementia are heavy consumers of health care services and social care, this will have a significant impact on financial planning and policymaking for health care and social services. In addition, there is a high economic and psychosocial cost for the informal support required from family caregivers.6
The neurodegenerative diseases underlying dementia are defined by their underlying pathology. The common themes appear to be abnormal deposition of a normally soluble protein in the brain tissue (a proteinopathy) and/or a cerebrovascular abnormality. Alzheimer’s disease is defined by (1) the extracellular deposition of insoluble Aβ, a peptide chain of 40 to 42 amino acids, resulting in extracellular amyloid plaques, and (2) the intracellular deposition of hyperphosphorylated tau protein, resulting in intraneuronal neurofibrillary tangles.7 Other neurodegenerative diseases underlying dementia include vascular dementia, cortical Lewy body disease, frontotemporal lobar degeneration, and the prion diseases. Alzheimer’s disease is the most common cause of dementia, followed by cortical Lewy body disease and vascular dementia. In individuals younger than age 60 years, frontotemporal lobar degeneration is the second most common cause of dementia after Alzheimer’s disease. These pathologic processes may coexist with each other or even increase the likelihood of developing a second pathologic process. Mixed dementia (Alzheimer’s disease and concurrent vascular dementia) is probably the most common form of all dementia overall.
ALZHEIMER’S DISEASE
The current clinical definition of Alzheimer’s disease (AD) is incorporated in the National Institute of Neurological and Communicative Disorders and Stroke–Alzheimer’s Disease and Related Disorders Association criteria (NINCDS-ADRDA) (Table 45-1).8 There has been a proposal for the modification of the criteria in view of recent advances of developing biomarkers of AD with structural and functional neuroimaging, genetic testing for familial AD, and cerebrospinal fluid (CSF) analysis (Table 45-2).9 These criteria permit the diagnosis of the disease at an earlier stage. The diagnosis of AD is only definitive after pathologic confirmation by brain biopsy or autopsy. Otherwise, the diagnosis is at best probable. The recent recommendations would allow the definitive diagnosis of AD in autosomal dominant AD to be based on genetic testing without pathologic examination.
TABLE 45-1 NINCDS-ADRDA Criteria for the Diagnosis of Alzheimer’s Disease
• Dementia established by clinical examination and documented by the Mini-mental State Examination (MMSE) or some similar examination and confirmed by neuropsychological tests
• Deficits in at least two areas of cognition
• Progressive deterioration of memory and other cognitive functions
• No disturbance of consciousness
• Onset between ages 40 and 90
• Absence of systemic disorders that in and of themselves could account for the progressive deficits
• Progressive deterioration of specific cognitive functions such as language (aphasia), motor skills (apraxia) and perception (agnosia)
• Impaired activities of daily living
• Family history of similar disorders, particularly if confirmed neuropathologically
• Normal lumbar puncture and electroencephalogram (EEG)
• Evidence of cerebral atrophy on CT with progression documented by serial observation
From McKhann G, Drachman D, Folstein M, et al. Clinical diagnosis of Alzheimer’s disease: report of the NINCDS-ADRDA Work Group under the auspices of Department of Health and Human Services Task Force on Alzheimer’s Disease. Neurology 1984; 34:939-944.
TABLE 45-2 Proposed Revision of NINCDS-ADRDA Criteria for the Diagnosis of Alzheimer’s Disease
A. Presence of an early and significant episodic memory impairment that includes the following features:
• Both clinical and histopathologic (brain biopsy or autopsy) evidence of the disease, as required by the NIA-Reagan criteria10 for the postmortem diagnosis of AD; both criteria must be present.
• Both clinical and genetic evidence (mutation on chromosome 1, 14, or 21) of AD; both criteria must be present.
From Dubois B, Feldman HH, Jacova C, et al. Research criteria for the diagnosis of Alzheimer’s disease: revising the NINCDS-ADRDA criteria. Lancet Neurol 2007; 6:734-746.
Epidemiology
The Alzheimer’s Association estimated that, in 2007, 5.1 million Americans suffered from AD.11 Of these, 4.9 million were older than 65 years. Although only 200,000 patients developed AD before the age of 65, AD is the most common cause of young-onset dementia. The prevalence of AD increases exponentially from 2% between the ages of 65 and 74, to 19% between the ages of 75 and 84, to 42% of individuals older than 85 years.11 In another study, also in 2007, it was reported that AD affected 26.6 million people worldwide, a figure estimated to quadruple to more than 100 million by 2050.12 AD affects women more commonly than men, most likely reflecting the greater longevity of women. There is no significant gender difference in the age-specific incidence of AD or in the risk of mortality due to AD.13
Clinical Presentation
The typical AD phenotype is an insidious onset and progressive decline in episodic (autobiographical) memory with later involvement of other cognitive domains (Box 45-1). Patients typically lose track of day-to-day events, forget names of recent acquaintances, become repetitive in their questioning, and get disorientated in unfamiliar surroundings. The early clinical features of impaired episodic memory reflect the early involvement of the entorhinal cortex and hippocampus in AD. At this early phase, patients may feel depressed, anxious, and frustrated and may lose their self-confidence. As the pathologic process spreads from the medial temporal lobe to the neocortical brain, other cognitive domains become affected, leading to deficits in word finding, language skills, semantic memory (encyclopedic knowledge of facts and figures), calculation, visual spatial and perceptual skills, and praxis. Frontal lobe damage leads to executive dysfunction and deficits in attention, problem solving, judgment, abstract thinking, inertia, behavior, and personality.
BOX 45-1 Alzheimer’s Disease
PATIENT HISTORY
A 57-year-old secretary noticed difficulties typing on a keyboard that she attributed to blurred vision. She had her glasses changed twice with no improvement. Ophthalmologic review found no intraocular abnormality. Over the following year she noticed difficulties with spelling and reading, often getting lost in the middle of the paragraph. Over the following year, her symptoms gradually progressed and she also noticed difficulties operating new household gadgets, such as a new washing machine. Neurologic assessment at that stage revealed biparietal dysfunction with impaired visual perceptual and visual spatial skills (right parietal lobe function) and dyscalculia, apraxia, and dyslexia (left parietal lobe function) and relatively preserved episodic memory. Brain volumetric MRI revealed no structural or vascular abnormality but a suggestion of disproportionate parieto-occipital atrophy with preserved frontotemporal and hippocampal volumes. The working diagnosis was of the posterior variant of Alzheimer’s disease. Over the following 5 years her cognitive function continued to decline with involvement of episodic memory and language. Repeat MRI at the age of 61 revealed further atrophy, demonstrated by fluid registration (Fig. 45-1). By the age of 64 she was totally dependent for basic activities of daily living. She died at the age of 66 of pneumonia. Pathologic examination revealed definite Alzheimer’s disease.
Although most AD patients present with an amnestic syndrome, a small proportion of patients with AD-type pathology present, instead, with relative preservation of episodic memory and disproportionate impairment of other cognitive domains.14 Such patients may manifest a frontal syndrome causing executive dysfunction and behavioral change; a language syndrome resembling progressive nonfluent aphasia or semantic dementia; and/or a parieto-occipital syndrome (posterior cortical atrophy) causing visuoperceptual or visuospatial deficits (nondominant parietal dysfunction), dysgraphia, dyslexia, dyscalculia, apraxia (dominant parietal dysfunction), or impaired early visual processing and visual disorientation (occipital dysfunction).
Pathophysiology
Molecular biology has now identified the principal components of amyloid plaques and neurofibrillary, tangles leading to new hypotheses of AD pathogenesis.15,16
The amyloid precursor protein (APP) is a transmembrane protein of unknown function (Fig. 45-2). Extracellular amyloid plaques are composed of cleavage products of APP in the form of peptide chains of 40 to 42 amino acids, designated Aβ (said “A Beta”). In 1991, the first genetic mutation in the APP gene was identified on chromosome 21, establishing the genetic basis for one autosomal dominant form of AD.17 Discovery of other mutations in the APP gene and of mutations in the genes for presenilin-1 (PSEN1) and presenilin-2 (PSEN2) have confirmed that disordered metabolism of APP plays a central role in the pathogenesis of AD.18
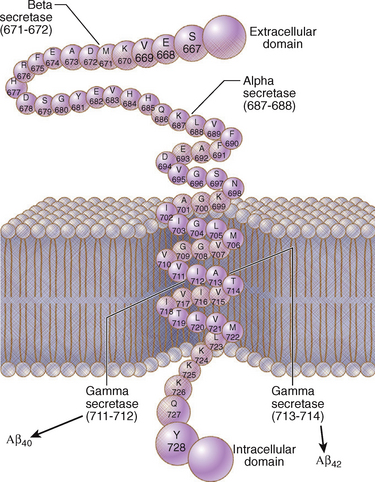
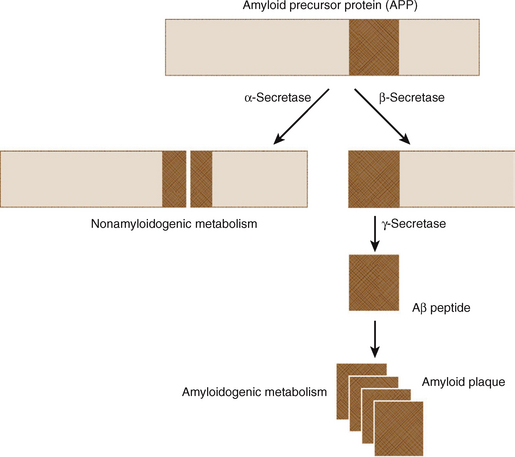
APP is cleaved into components by three enzymes, designated α-, β-, and γ-secretase. α-Secretase cleaves APP in the middle of the Aβ peptide region, generating short, soluble peptide fragments. β- and γ-secretases cleave APP sequentially to produce longer, amyloidogenic Aβ peptides (Fig. 45-3). Most genetic mutations affecting APP, PSEN1, and PSEN2 increase the production of Aβ species that readily form fibrils or alter the relative proportions of the species produced by cleavage of APP.
Tau is a protein that binds microtubules, promotes their stability, and influences axonal transport.19 Tau exists in six isoforms, which vary in length from 352 to 441 amino acids. The six isoforms of tau arise from a single gene on chromosome 17 by alternative mRNA splicing. Three of the isoforms have three microtubule-binding domains (designated “three repeat tau”). The other three isoforms have four microtubule-binding domains (designated “four repeat tau”).20 Intracellular neurofibrillary tangles composed of hyperphosphorylated tau are the second hallmark of AD pathology. Hyperphosphorylation of tau isoforms by the enzyme glycogen synthase kinase-3 promotes aggregation of tau into paired helical filaments that are the building blocks of neurofibrillary tangles.21
Tau also plays a role in other forms of neurodegeneration designated “tauopathies.”22 The clinically heterogeneous group of tauopathies includes frontotemporal lobar degeneration, corticobasal degeneration, and progressive supranuclear palsy. In addition, several mutations in the tau gene cause a familial, clinically heterogeneous disorder referred to as “frontotemporal dementia and parkinsonism linked to chromosome 17 (FTDP-17).”23
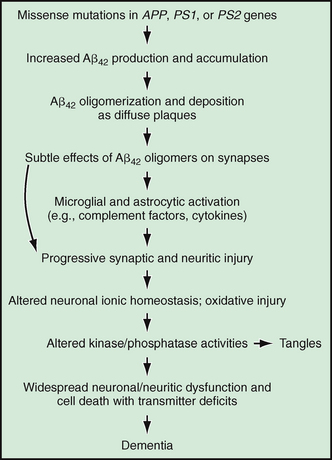
According to the amyloid hypothesis, the primary event in AD pathogenesis is the production of amyloidogenic Aβ peptides. Tau pathology is deemed a secondary, downstream event. Recent animal studies suggest that it is the soluble oligomers of Aβ rather than the sequence of events leading to AD as shown in Figure 45-4.15 The resulting synaptic loss and neuronal death could result in depletion of neurotransmitter release. In AD, there is reduced release of acetylcholine from fibers that originate in the nucleus basalis of Meynert and project from there to all cortical and allocortical areas, including the hippocampal and amygdaloid regions.24 This cholinergic hypothesis of the pathogenesis of AD has prompted development of cholinesterase inhibitors, which have modest benefit in AD, particularly in mild-moderate stage AD.
Pathology
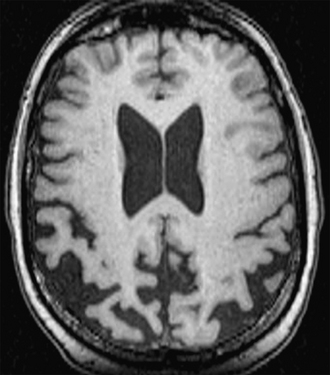
Gross examination of the brain in AD usually shows diffuse, moderate to severe cerebral atrophy with sulcal widening, ventricular dilatation, and reduced brain weight. There is disproportionate atrophy of medial temporal lobe structures, including the entorhinal cortex and hippocampal formation (Figs. 45-5 and 45-6).
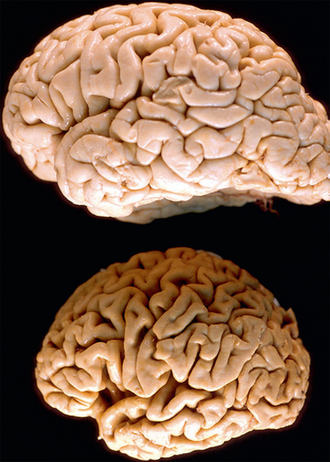
FIGURE 45-5 Comparison of normal and AD brains. Top, Normal brain. Bottom, Brain of a patient with Alzheimer’s disease. The AD brain shows gyral atrophy and sulcal widening greater than that seen in a person with no cognitive impairment.
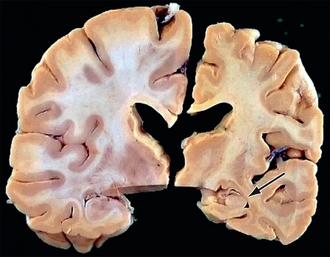
FIGURE 45-6 Comparison of normal and AD brains. Right, Coronal section of a hemisphere from a patient with AD. Left, Coronal section of a normal hemisphere from a subject with no cognitive impairment The AD brain shows hippocampal atrophy (arrow) compared with the hippocampus of the normal subject.
Histopathologically, the hallmarks of AD are extracellular amyloid plaques and intracellular neurofibrillary tangles (Fig. 45-7). Other histologic features identified in AD are neuropil threads, dystrophic neurites, Hirano bodies, neuronal and synaptic loss, gliosis, amyloid angiopathy, granulovacuolar degeneration, and even white matter changes.7
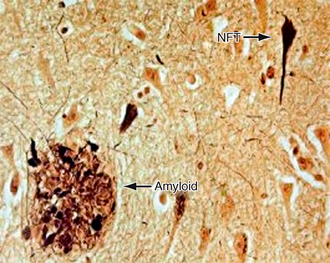
FIGURE 45-7 Extracellular amyloid plaques (labeled amyloid) and intracellular neurofibrillary tangles (NFT).
The definitive diagnosis of AD remains pathologic. However, histologic diagnosis may not be straightforward owing to the heterogeneity in the distribution and severity of the pathologic lesions of AD, the occurrence of similar pathologic lesions with normal aging or other dementia syndromes, and the presence of pathologic features caused by other, concurrent neurodegenerative disorders such as vascular disease. The present criteria for the histopathologic diagnosis of AD rely on the semi-quantitative assessment of the amount and site of deposition of either amyloid plaques (CERAD criteria)25 or neurofibrillary tangles (Braak and Braak criteria),26 or both.10 The Braak and Braak staging of the cortex and the hippocampus in early-stage disease, before AD spreads to the neocortex, is shown in (Fig. 45-8).26 One study postulated that it takes at least 16 years from stage I to stage II, about 14 years pass by from stage II to III, 13 years from stage III to IV, and 5 years from stage IV to V (Fig. 45-9).26,27
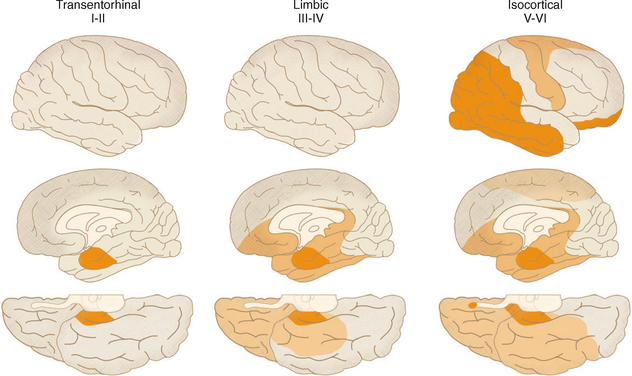
FIGURE 45-8 Diagram illustrating the spread of neurofibrillary-tangle pathology from the entorhinal cortex toward the neocortex.
(From Braak H, Braak E. Neuropathological staging of Alzheimer-related changes. Acta Neuropathol [Berl] 1991; 82:239-259.)
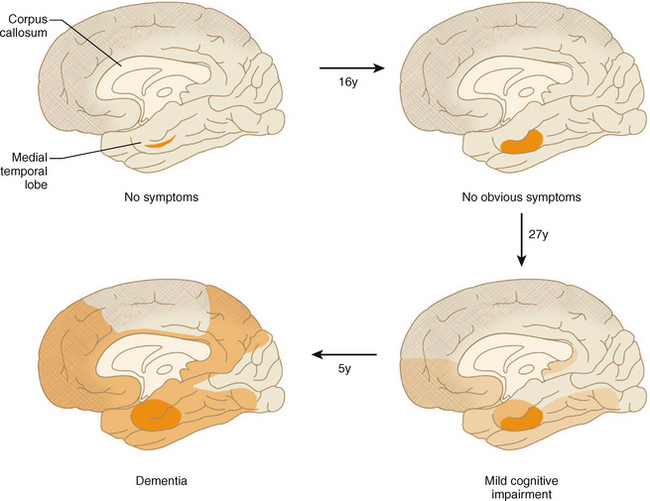
FIGURE 45-9 Time scale for the spread of neurofibrillary tangle pathology. It is estimated that it takes at least 16 years from stage I to stage II, about 14 years pass by from stage II to III, 13 years from stage III to IV, and 5 years from stage IV to V (= Alzheimer’s disease) for 5% of a given cumulative sample.
Imaging
Brain imaging is a necessary part of the clinical evaluation of any dementing illness. The guidelines from the American Academy of Neurology include structural neuroimaging with either noncontrast CT or MRI in the initial evaluation of patients with dementia.28 Although the objective was to exclude abnormalities that are potentially amenable to surgical treatment, such as tumor, hematoma, or hydrocephalus, structural imaging, and in particular MRI, can be used actively to establish the diagnosis of AD and to differentiate AD from normal aging or other forms of dementia.29 Moreover, imaging is essential for assessing the degree of cerebrovascular damage and establishing the coexistence of any vascular dementia.
CT is relatively inexpensive, accessible, and quick to perform. However, MRI is superior to CT because MRI delivers no harmful ionizing radiation and has better tissue differentiation and resolution. Moreover, quantification of MRI parameters may provide biomarkers that can be validated to establish the diagnosis of disease and monitor disease progression over serial MR studies.30 However, MRI does have disadvantages. MRI scanners are more expensive than CT scanners and cause claustrophobia in some patients. The powerful magnetic fields employed in MRI render the study unsafe for patients with pacemakers, certain metallic clips, and implants. Practically, the longer scanning time required for MRI significantly increases motion-associated artifacts, a very large problem in patients with dementia.
CT
The typical CT findings of AD are generalized cerebral atrophy, ventricular dilatation, and atrophy of the medial temporal lobe (Fig. 45-10).
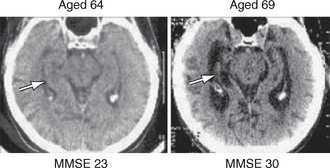
FIGURE 45-10 Serial CT scans of a patient with AD. There is progressive atrophy of the hippocampal formation (arrows) and corresponding increase in the medial temporal sulci as AD progresses from the mild stage (MMSE = 23/30) (left) to the severe stage (MMSE=3/30) (right).
(Picture courtesy of Professor A. D. Smith, OPTIMA, Oxford University.)
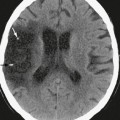
A few quantitative linear CT measures have been suggested to differentiate patients with AD from patients with normal aging or other forms of dementia. The medial temporal lobe width is defined as the minimum width of the medial temporal lobe, measured by temporal-lobe–oriented CT.31 However, the medial temporal lobe width does not differentiate patients with AD from those with other forms of dementia, although it does provide some support for differentiating dementia from depression.32 The temporal horn ratio is the temporal horn width divided by the maximal transversal intracranial width.33 The suprasellar cistern ratio is the suprasellar cistern width divided by maximal transversal intracranial width (Fig. 45-11).33 These two measurements of the temporal horn ratio and the suprasellar cistern ratio have supportive discriminatory value in separating patients with AD from healthy controls.33
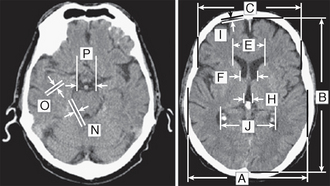
FIGURE 45-11 Linear measurements taken on axial CT slices. The temporal horn ratio is the temporal horn width (O) divided by the maximal transversal intracranial width (A). The suprasellar cistern ratio is the suprasellar cistern width (P) divided by A.
(© Dr. Basil Ridha, Dementia Research Centre, University College London, London, UK.)
MRI
The typical MR feature of the early AD is symmetric atrophy of medial temporal lobe structures including the entorhinal cortex and hippocampus (Fig. 45-12). With disease progression, symmetric atrophy also affects the posterior cingulate gyrus, precuneus, and temporoparietal neocortex with relative sparing of the sensorimotor cortex, brain stem, and cerebellum. Imaging atrophy is best demonstrated using T1-weighted (T1W) volumetric scans with thin slices, currently 1.0 to 1.5 mm.
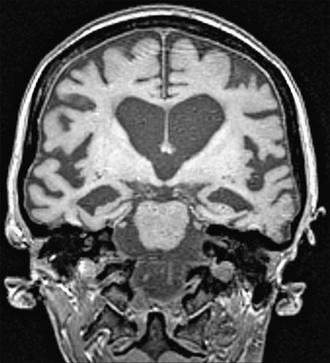
FIGURE 45-12 Coronal section demonstrating hippocampal atrophy on a T1W volumetric MR scan of a patient with AD.
(Courtesy of the Dementia Research Centre, Queen Square, London.)
Cross-Sectional Volumetric MRI Measurements
Compared with controls, patients with moderately severe AD show 30% to 40% reduction in the volume of the hippocampus and/or the entorhinal cortex on quantitative volumetric studies.34–36 This atrophy is already present in patients with mild disease37–39 and in presymptomatic carriers of mutations of APP, PSEN1, and PSEN2.40 Changes in the entorhinal cortex and hippocampus have comparably high discriminative power for diagnosing AD.41,42 Technically, however, it is easier to segment and quantify the volume of the hippocampus than the entorhinal cortex, so metrics of hippocampal volume are used more often.
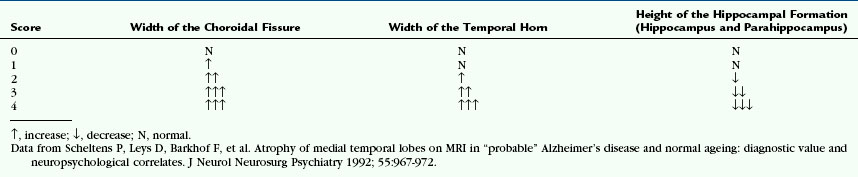
Multiple other brain structures also become atrophied in AD. Callen and colleagues showed an approximate 20% reduction in the volumes of the amygdala and posterior cingulate cortex in patients with mild to moderate AD.36 Lehericy and associates showed that measuring the amygdalar volume in addition to the hippocampal volume adds discriminatory value in identifying AD.38 Semi-quantitative visual scoring of medial temporal atrophy (Table 45-3) has an overall accuracy about 85% as good as quantitative volumetric measures.43
MRI features of hippocampal atrophy do correlate with AD neuropathology. Antemortem measures of hippocampal volume correlate with the Braak stage of the disease44 and with neurofibrillary tangle burden in the hippocampus.45 Hippocampal volumes measured on postmortem MRI correlate with hippocampal neuronal cell counts.46 Volumetric measurements of the hippocampus on postmortem MR images predict successful fulfillment of neuropathologic criteria for AD, whether or not a clinical diagnosis of dementia had been made ante mortem.47
Reduction in whole-brain volume and increase in ventricular size provide global measures of disease burden in patients with established AD.34,48,49 Whole-brain atrophy correlates significantly with neuropsychological measures of disease severity and with the cortical burden of neurofibrillary tangles.45 Total antemortem ventricular CSF volume correlates with the cortical burden of both neurofibrillary tangles and amyloid plaque.
Serial Image Registration
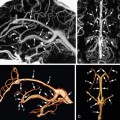
Existing co-registration techniques are designated linear (so-called rigid) or nonlinear (e.g., elastic, fluid) techniques. Rigid body registration applies the same mathematical transformation to all voxels in the scan to realign and match the repeat scan to the baseline scan position. To date, rigid body registration has been used for most serial within-subject volumetric studies. One validated rigid body registration technique relies on intensity matching of all the voxels within a segmented region (e.g., whole brain).50 The registration procedure involves first delineating the brain region to be registered and then applying a series of rotations and translations along and around the x, y and z axes to match the repeat scan to the baseline. This process is called “six degrees of freedom” (“6dof”) registration. If the imaging voxels are also allowed to stretch along any of the three axes, the technique is called “nine-degrees of freedom” (“9dof”) registration. Computer generation of the registered image requires the computer to estimate (“interpolate”) the intensity of voxels “in between” those actually measured on the original scan. Once the two or more scans are registered, the serial images can be subtracted to generate a “difference image,” which can then be displayed to highlight the interval changes (Fig. 45-13).50 Nonlinear registration applies differing transformations to the individual voxels of the repeat scan, expanding some areas while contracting others to achieve the “best” correspondence between the two scans. One such approach is fluid registration,51,52 which models the transformation from one scan to another on the basis of the physical properties of a viscous compressible fluid. Following a “9dof” rigid body registration the model aims to find an exact match between source and target scan. To do so, a displacement vector is generated for each voxel within the image, giving the degree of stretch or contraction—atrophy or expansion—of that voxel over the interval between the scans. This calculation can be presented as an overlay image (voxel compression map [VCM]) that provides an unbiased display of the pattern of regional atrophy between the two scans without the need for a priori decisions as to which structures should be assessed (Fig. 45-14).
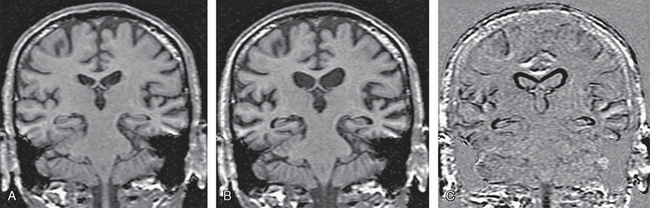
FIGURE 45-13 Registered coronal T1W MR images of an AD patient. A, Baseline scan. B, Repeat scan 1 year later, realigned and co-registered to the baseline scan. C, Subtraction techniques highlight the difference between the two scans to show the regions and extent of disease progression.
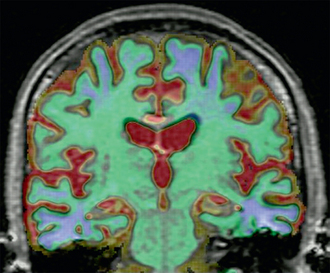
FIGURE 45-14 Voxel compression mapping in AD. Regional atrophy (blue/green) is seen in the medial temporal lobes and parietal cortices. Regional expansion (red/yellow) is seen in the cerebrospinal fluid spaces, including the ventricles and sulci.
In an AD patient with progressive brain atrophy and repeat scanning, the difference image generated by rigidly registering the repeat image to baseline image displays the change in volume along the brain-CSF interface only (see Fig. 45-13). By adding fluid registration, the amount of volume change at each voxel is displayed, thus giving more clinically relevant information on the exact location of atrophy (see Fig. 45-14).
Another nonlinear technique based on cortical pattern matching was shown to map over time the spread of atrophy from the temporal and limbic cortices into frontal and occipital brain regions, sparing sensorimotor cortices.53
Regional Longitudinal Volumetric MRI Assessment
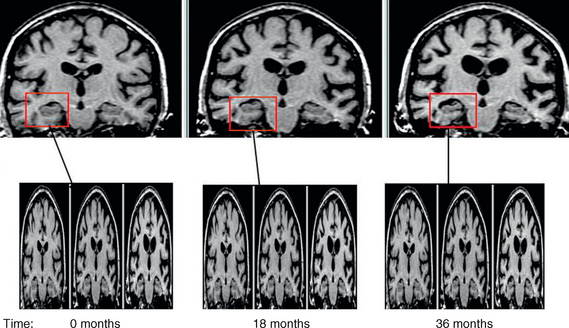
The early pathologic involvement of medial temporal lobe structures in AD has led to interest in utilizing structural MRI to track progression of atrophy of medial temporal lobe structures. AD patients have been shown to have two to three times higher rates of hippocampal atrophy than normal controls (Fig. 45-15). This finding is fairly consistent across many studies (although the exact values vary from study to study) (Table 45-4).
Stay updated, free articles. Join our Telegram channel

Full access? Get Clinical Tree


